Sales variance report with multiple levels
Zebra BI for Excel
Overview
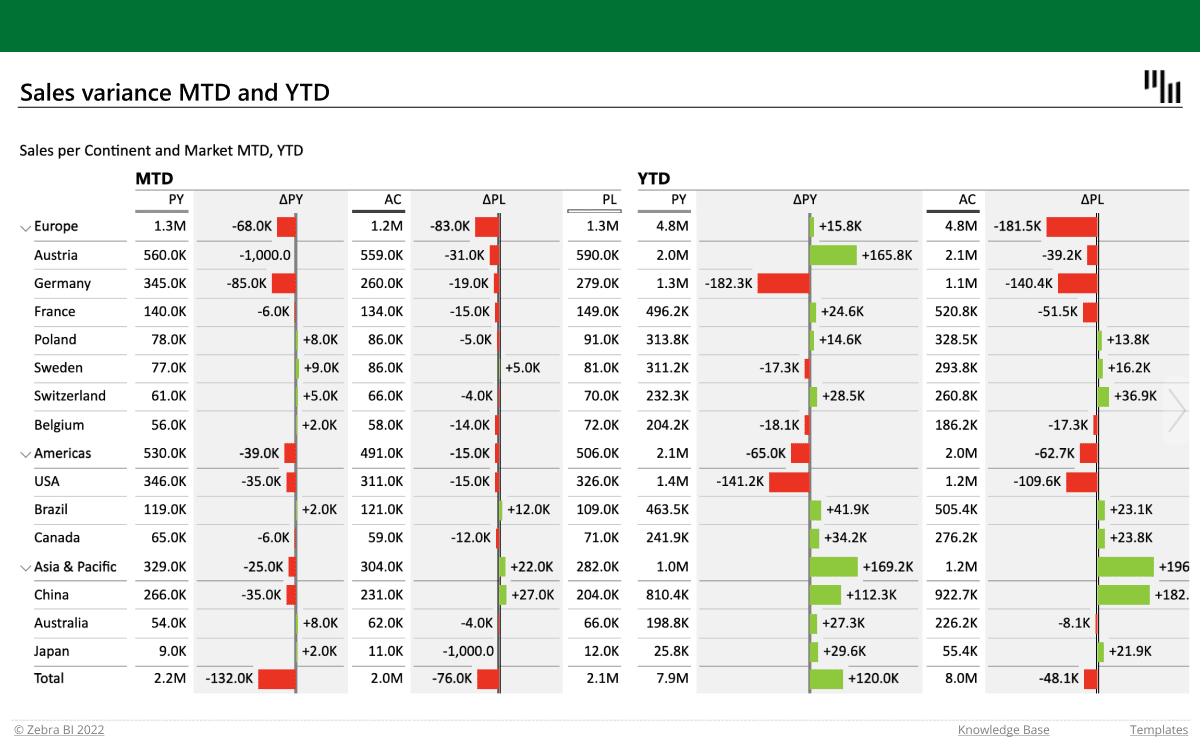
Get immediate insights into your sales performance with a multiple levels table showing the data for continents and countries. Compare the actual values with the previous year and plan, and get a bigger picture by analyzing the year-to-date and month-to-date data.
Get started in 3 steps
1
Download & Open
Download the .xls file and open it in Excel
2
Connect Your Data
Replace sample data with your CRM, ERP, or database source
3
Customize & Publish
Adjust KPIs, colors, and branding, then publish to Power BI Service
Fill out the form and get the Excel template
20,000+ users have downloaded this template


