Create IBCS®-Certified Reports in One Click with Zebra BI
Trusted by 1.5M+ professionals, Zebra BI ensures your reports are fully IBCS® compliant
Used by companies such as:


Verified customer
“This tool is unique. Most tools only show us WHAT happened. Zebra BI answers WHY it happened.”

Gabriel Medina
Analyst at GxSoft Argentina
Verified customer
“Our controllers now spend less time preparing comprehensive reports and more time analyzing data and crystallizing the message.”

Alejandro Meyer
Planning & Controlling Director at SanLucar Fruit
Verified customer
“This a highly professional product. Our company’s leadership (finance and operations) is already asking we roll this out to all our PBI financial reports.”

Joe Pawlowski
Innovation Manager - Business Intelligence, DHL


Zebra BI Visuals are #1 Reviewed Add-In For Financial and Sales Dashboards.
Used by thousands of business analysts around the world. Get Zebra BI Charts, Tables and Cards directly from the Microsoft AppSource.
IBCS Certified
With IBCS standards you make sure reports across your organization stay consistent and follow the same logic for easier understanding.
Power BI Certified

Zebra BI visuals for Power BI have been officially tested and certified by Microsoft ensuring they meet the highest data security standards.
Fill out the form and get started
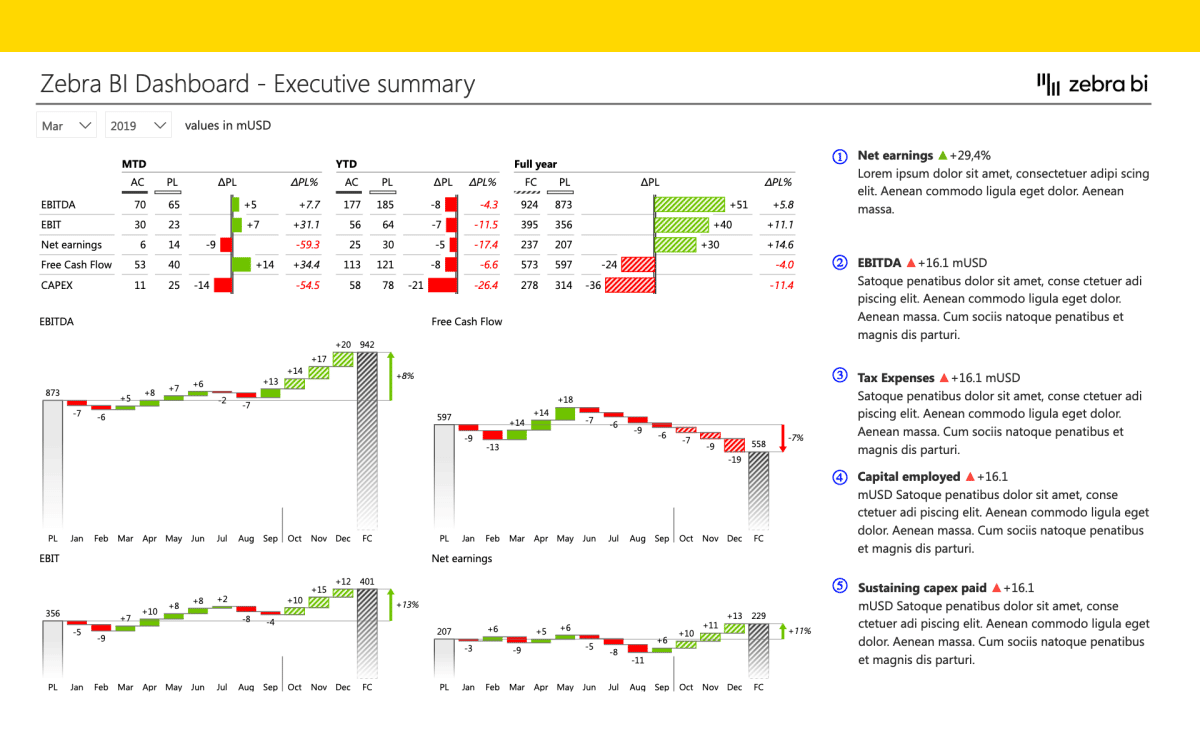
Certified IBCS® Charts, Tables & Cards
Get fully IBCS®-certified charts—built into your Power BI and Excel reports.
With Zebra BI, your reports automatically follow the IBCS® standards for clarity, consistency, and actionable insights.
No need to memorize rules or adjust layouts manually.
Just drag, drop, and let Zebra BI do the rest. It’s all covered—right out of the box.
One-Click Compliance & Visual Standardization
Build consistent, standards-based reports—without ever touching a format pane.
With one click, Zebra BI applies IBCS® layouts, notations, and visual best practices.
Your dashboards look clean. Your story stays sharp.
Skip the manual work—focus on your message.
Built for Business Users, Not Just Developers
You don’t need to be a Power BI expert to build world-class IBCS® dashboards.
Zebra BI is designed for analysts, controllers, and everyday decision-makers.
Choose the right chart. Add variance. Flip between views—all in seconds.
All the complexity happens in the background.
What you see? Just clarity.
All the Advanced Features You Expect — Built In
Zebra BI doesn’t just help you follow IBCS® standards—it gives you everything you need to create truly powerful reports inside Power BI.
Build advanced dashboards using just one visual, then switch effortlessly between tables, charts, and other visual elements without starting over. Need comparisons? Zebra BI calculates year-over-year, budget vs. actual, and other variances automatically—no DAX needed.
Want to go even further? Add comments directly into your
visuals to guide stakeholders through the story. Use Small Multiples to uncover
trends, calculate new measures with the built-in Formula Editor, or adjust your
report’s density with responsive layouts that adapt to the space available.
You can even track multiple KPIs inside a single visual—and apply consistent
styling across your dashboards for clear, executive-ready communication.
From quick insights to complex financial reports, Zebra BI gives you full
control, flexibility, and clarity—without the complexity.
Trusted by the world's leading professionals

1,500,000+
data professionals leverage Zebra BI product and resources

3,000+
clients rely on our services and
trust us with their businesses
trust us with their businesses

129
Countries from across the world uses Zebra BI


*Over 1 million Zebra BI users trust us worldwide. View customer by industry
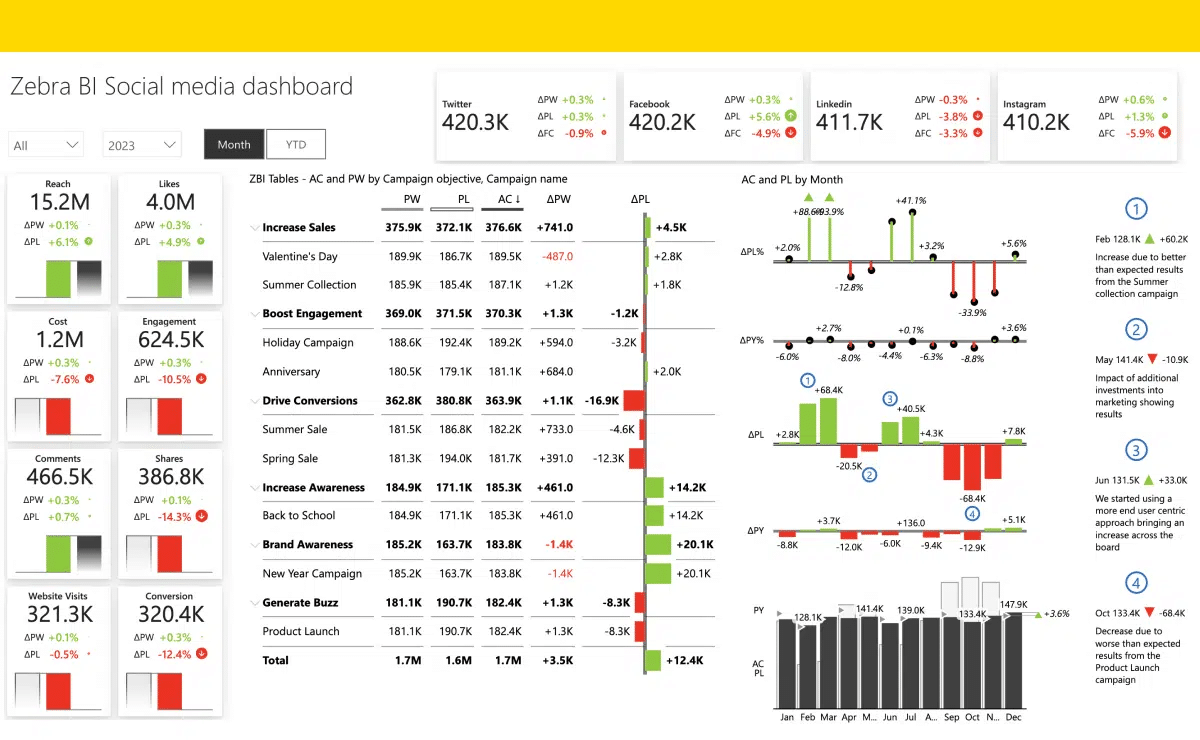
Customizable bussiness report templates
carefully designed to cover every detail of your report.
Get Started for Free


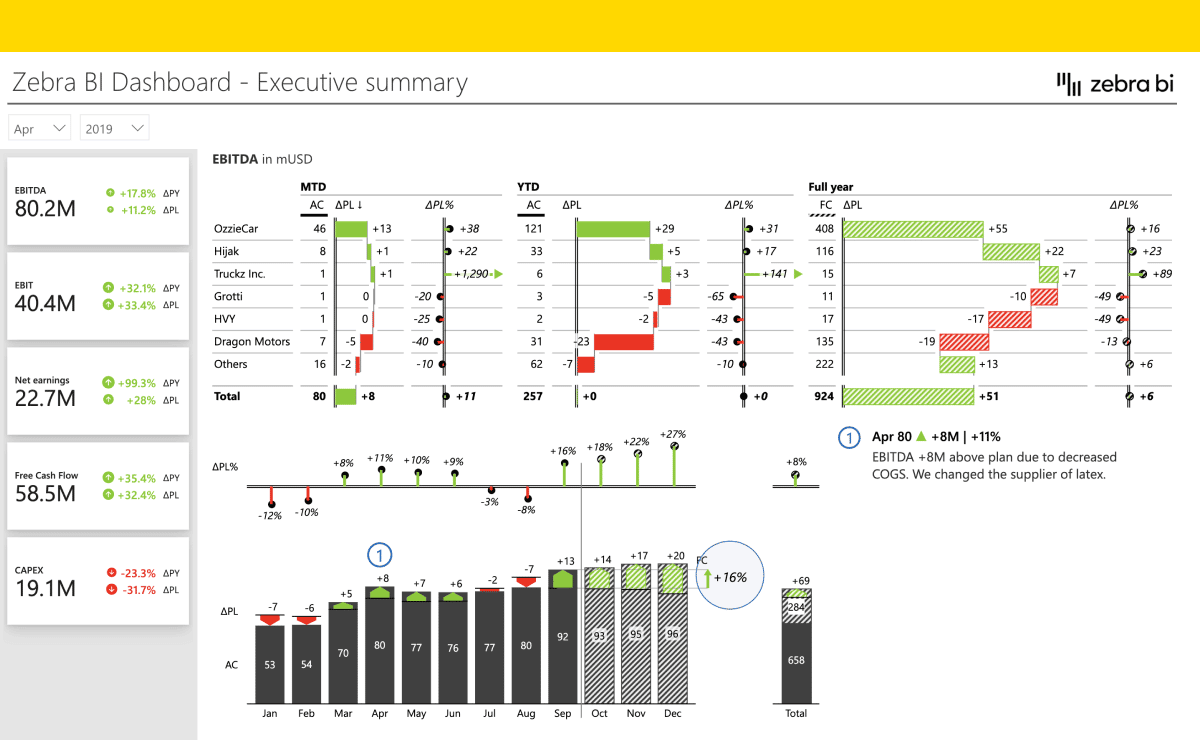


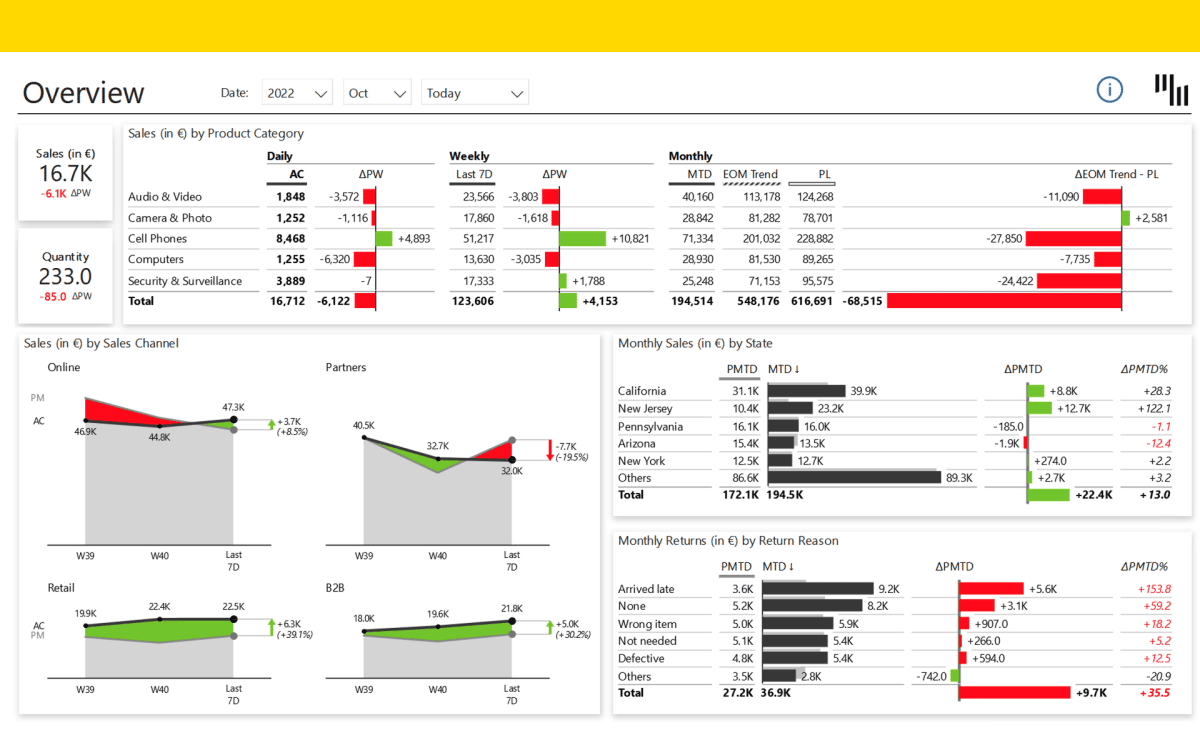
Report consistency
We don't store your data. All we do is use it to render visuals in your Excel. We're GDPR and CCPA-compliant.
Data security
quick comprehension of numbers by using the right charts and colors, following IBCS standards for consistent reports.
BI consolidation
With Zebra BI you get advanced Power BI feature, complementing your existing BI tools and leveraging the power of millions of Excel users.
Make your reports stand out
Insert Zebra BI into your Power BI and see the magic in your data happen!
Try Zebra BI for freeTry Zebra BI for Power BI for Free