Cost Benefit Analysis Template in Power BI

Zebra BI for Power BI
Multi-year costs, benefits, and scenarios, already modeled with automatic variances and waterfall bridges. No formulas to build, free, and ready the moment you open it.
Overview
The Power BI Cost-Benefit Analysis Template is a powerful resource for simplifying financial decisions. With automated visualizations and standardized reporting, it allows you to confidently compare costs and benefits to determine feasibility.
By downloading the Power BI Cost-Benefit Analysis Template, you can unlock several advantages:
- Data-driven decision-making with objective insights into financial viability.
- Optimized resource allocation by prioritizing projects with the best return.
- Improved risk management by identifying financial risks early.
- Enhanced transparency with clear justifications for decisions.
- Standardized financial comparisons for benchmarking investments with ease.
Take control of your decisions today by downloading this Power BI template and empowering your business with clear, actionable insights!
Play with the interactive demo below. If you click the ⤢ icon at the bottom-right of the report page you'll be able to enjoy the full-screen view.
Inside this template
Multi-year cost and benefit tracking (up to 5 years)
Automatically calculated variances (to Plan, Prior Year)
Waterfall / bridge charts (Plan to Actual, Year-over-Year)
Small multiples for trend tracking
Optimistic and pessimistic scenario planning
Annotation commenting with numbered markers
Difference highlights
Dynamic titles
Dynamic column headers
Tooltip comments
Hide/unhide columns
Drill-down (via hierarchies)
Action dots
Row calculations from the data model
Formula editor / Formula Manager
Find out if a project is worth it
Zebra BI’s ready-to-use Cost Benefit Analysis template helps you understand not only what a project costs and returns, but how that balance shifts year over year. It combines multi-year tracking, automatic variance analysis, and scenario planning into one clear, interactive report.
Instead of rebuilding a cost-benefit model in a spreadsheet every time a new project comes up, this Power BI template brings costs, benefits, and best & worst-case scenarios into a reusable report you can adapt for your own investment decisions.
Questions this template helps you answer:
The Cost Benefit Analysis template connects the full picture, from upfront costs and recurring expenses to benefits, revenue, and cost avoidance, and shows how that balance shifts year over year.
By combining multi-year tracking, automatic variances, and scenario planning, you can quickly answer questions like:
- Is this project paying off, or just costing less than expected?
- Which costs are one-time, and which will keep recurring?
- Where do benefits start to outweigh costs, and when?
- Are we tracking closer to our optimistic case or our pessimistic one?
- What's driving the gap between plan and actual this year?
- Are the gains holding up over multiple years, or fading after the first?
The dataset supports year-over-year tracking, plan-to-actual variance, and optimistic/pessimistic scenario comparison, so you can tell a temporary dip from a project that's genuinely underperforming.
Who is this Cost Benefit Analysis template for?
This Power BI cost-benefit template is designed to support both the initial investment decision and the ongoing tracking that follows it, so it’s a good fit for:
- CFOs & finance leaders
- Get a high-level view of which projects are paying off, using variance to plan, and a clear read on optimistic vs. pessimistic outcomes. Additionally, the built-in commentary explains why a number moved and what to do about it.
- FP&A analysts & controllers
- Build the multi-year cost-benefit case for a new project, with variances and scenario comparisons calculated automatically instead of being built by hand.
- Project & program managers
- Track whether a project is delivering on its promises year over year, and catch early signs if it's drifting toward the pessimistic case.
Cost-benefit insights the Power BI template provides:
Using this Power BI cost-benefit dashboard, you can:
- Compare costs and benefits year over year, from Year 1 through Year 5
- See exactly where a project sits against plan, prior year, or a pessimistic case.
- Track recurring and non-recurring costs separately, so one-time spend doesn't distort the trend.
- Spot the point where benefits start outweighing costs.
- Test optimistic and pessimistic scenarios before committing to a plan.
- Trace a swing in net benefit back to the specific cost or benefit driving it.
Every page in the Cost Benefit Analysis report
- Multi-year cost & benefit tracking
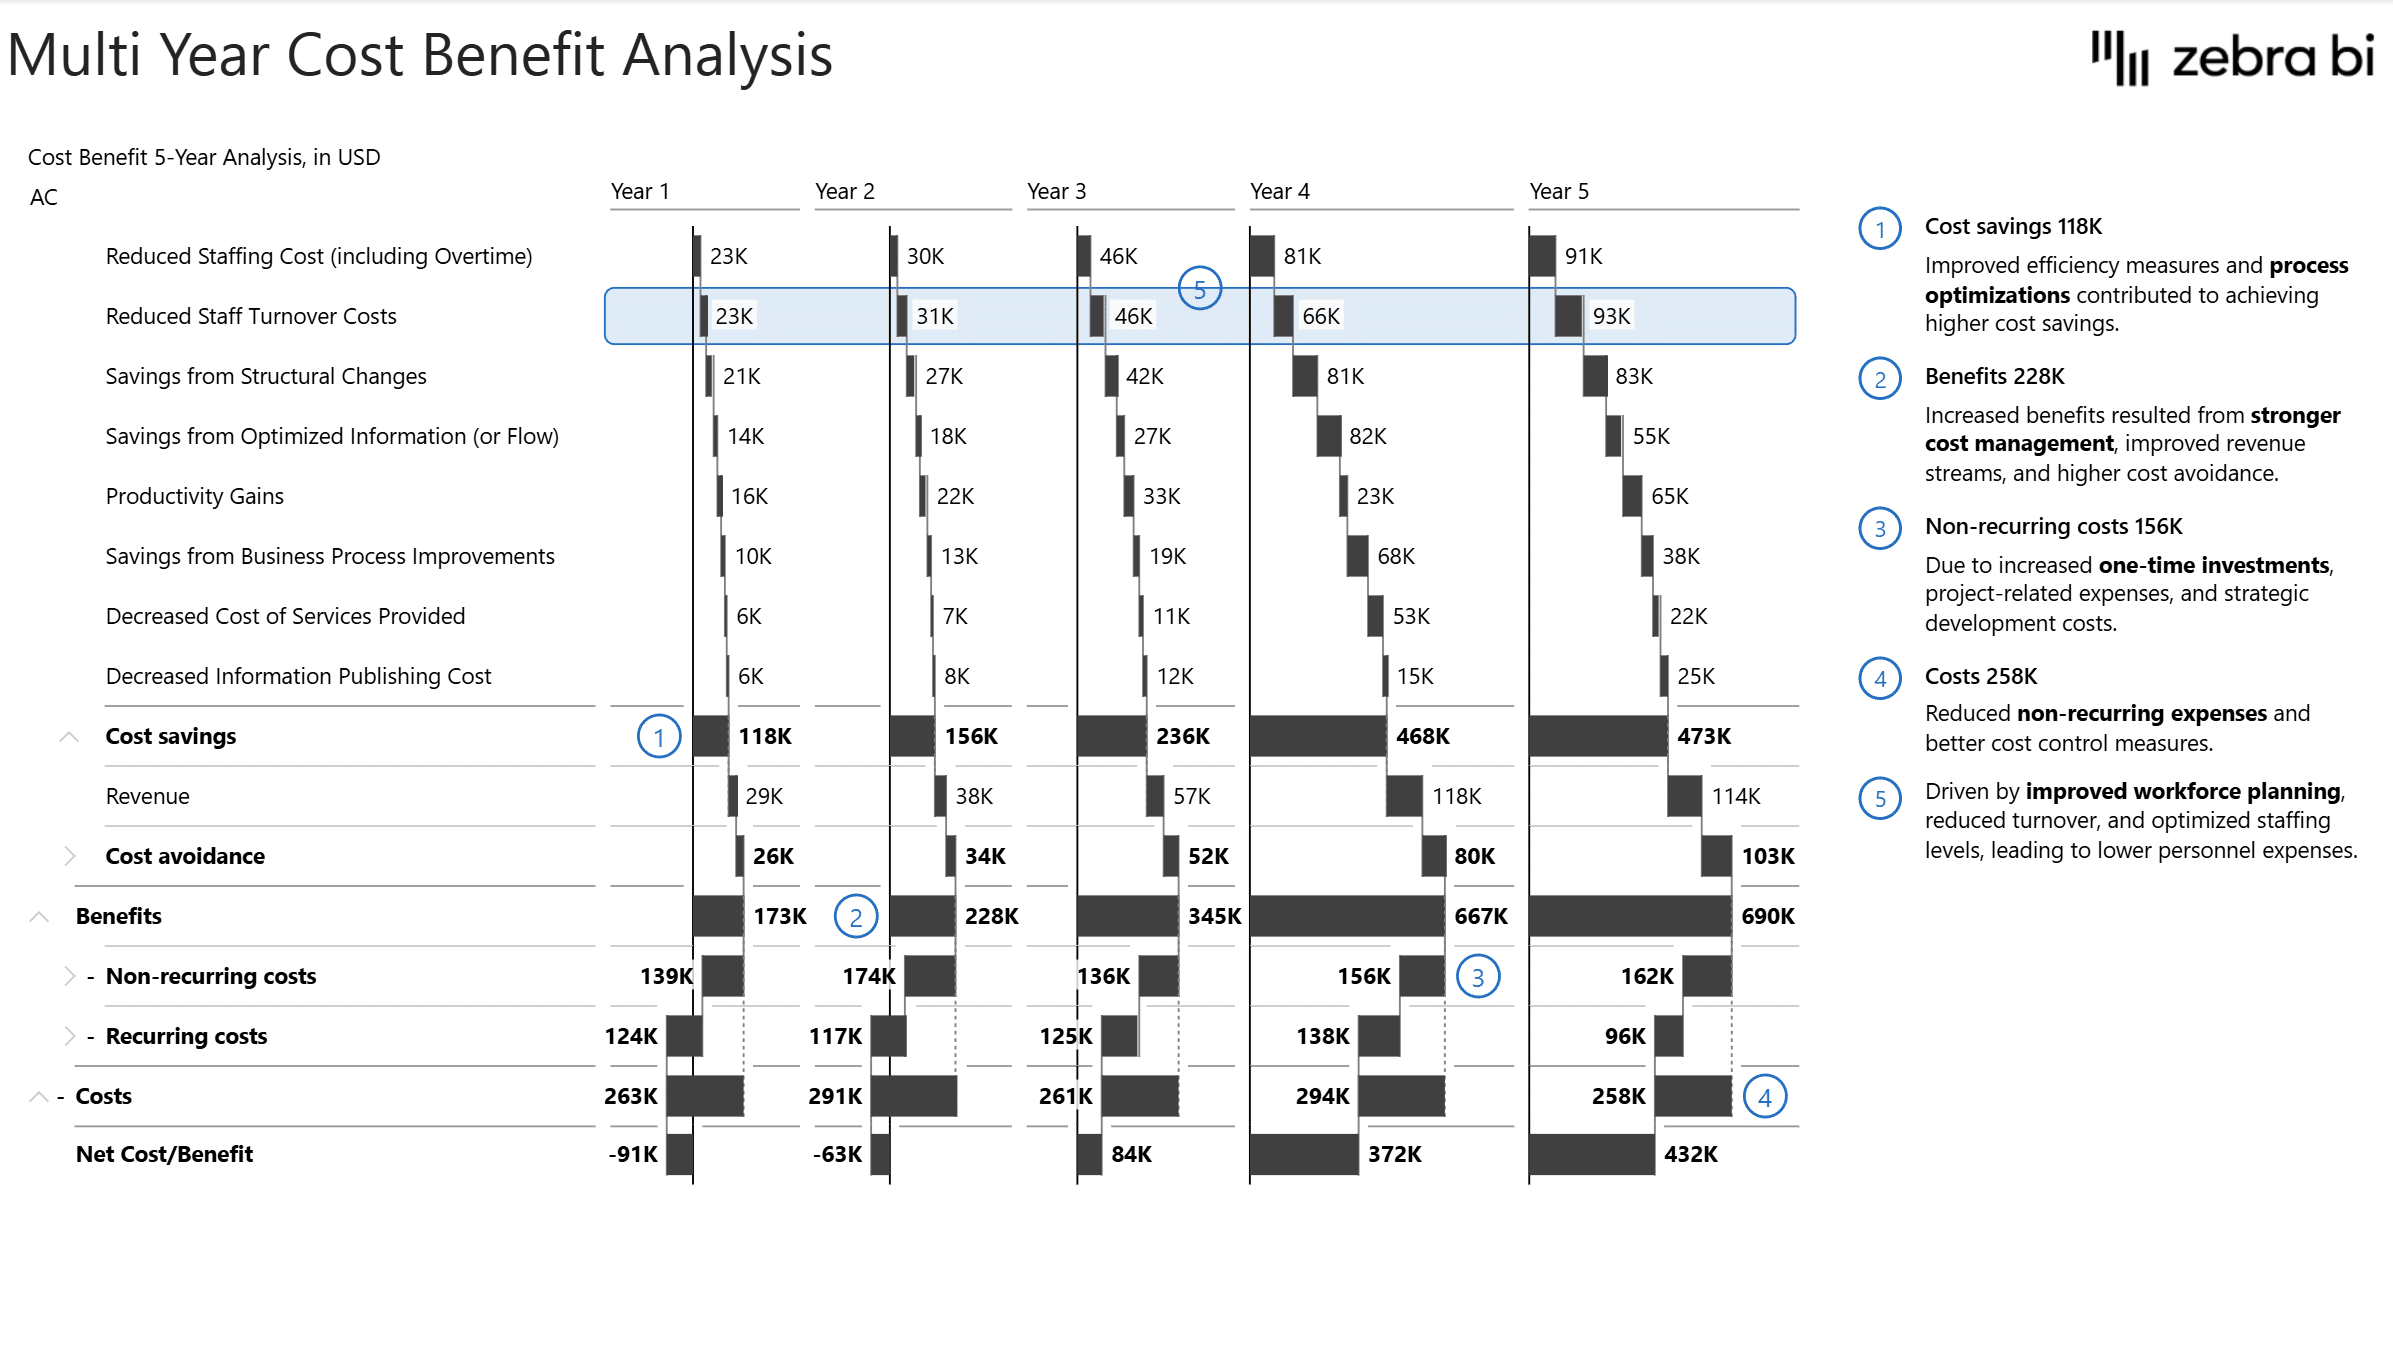
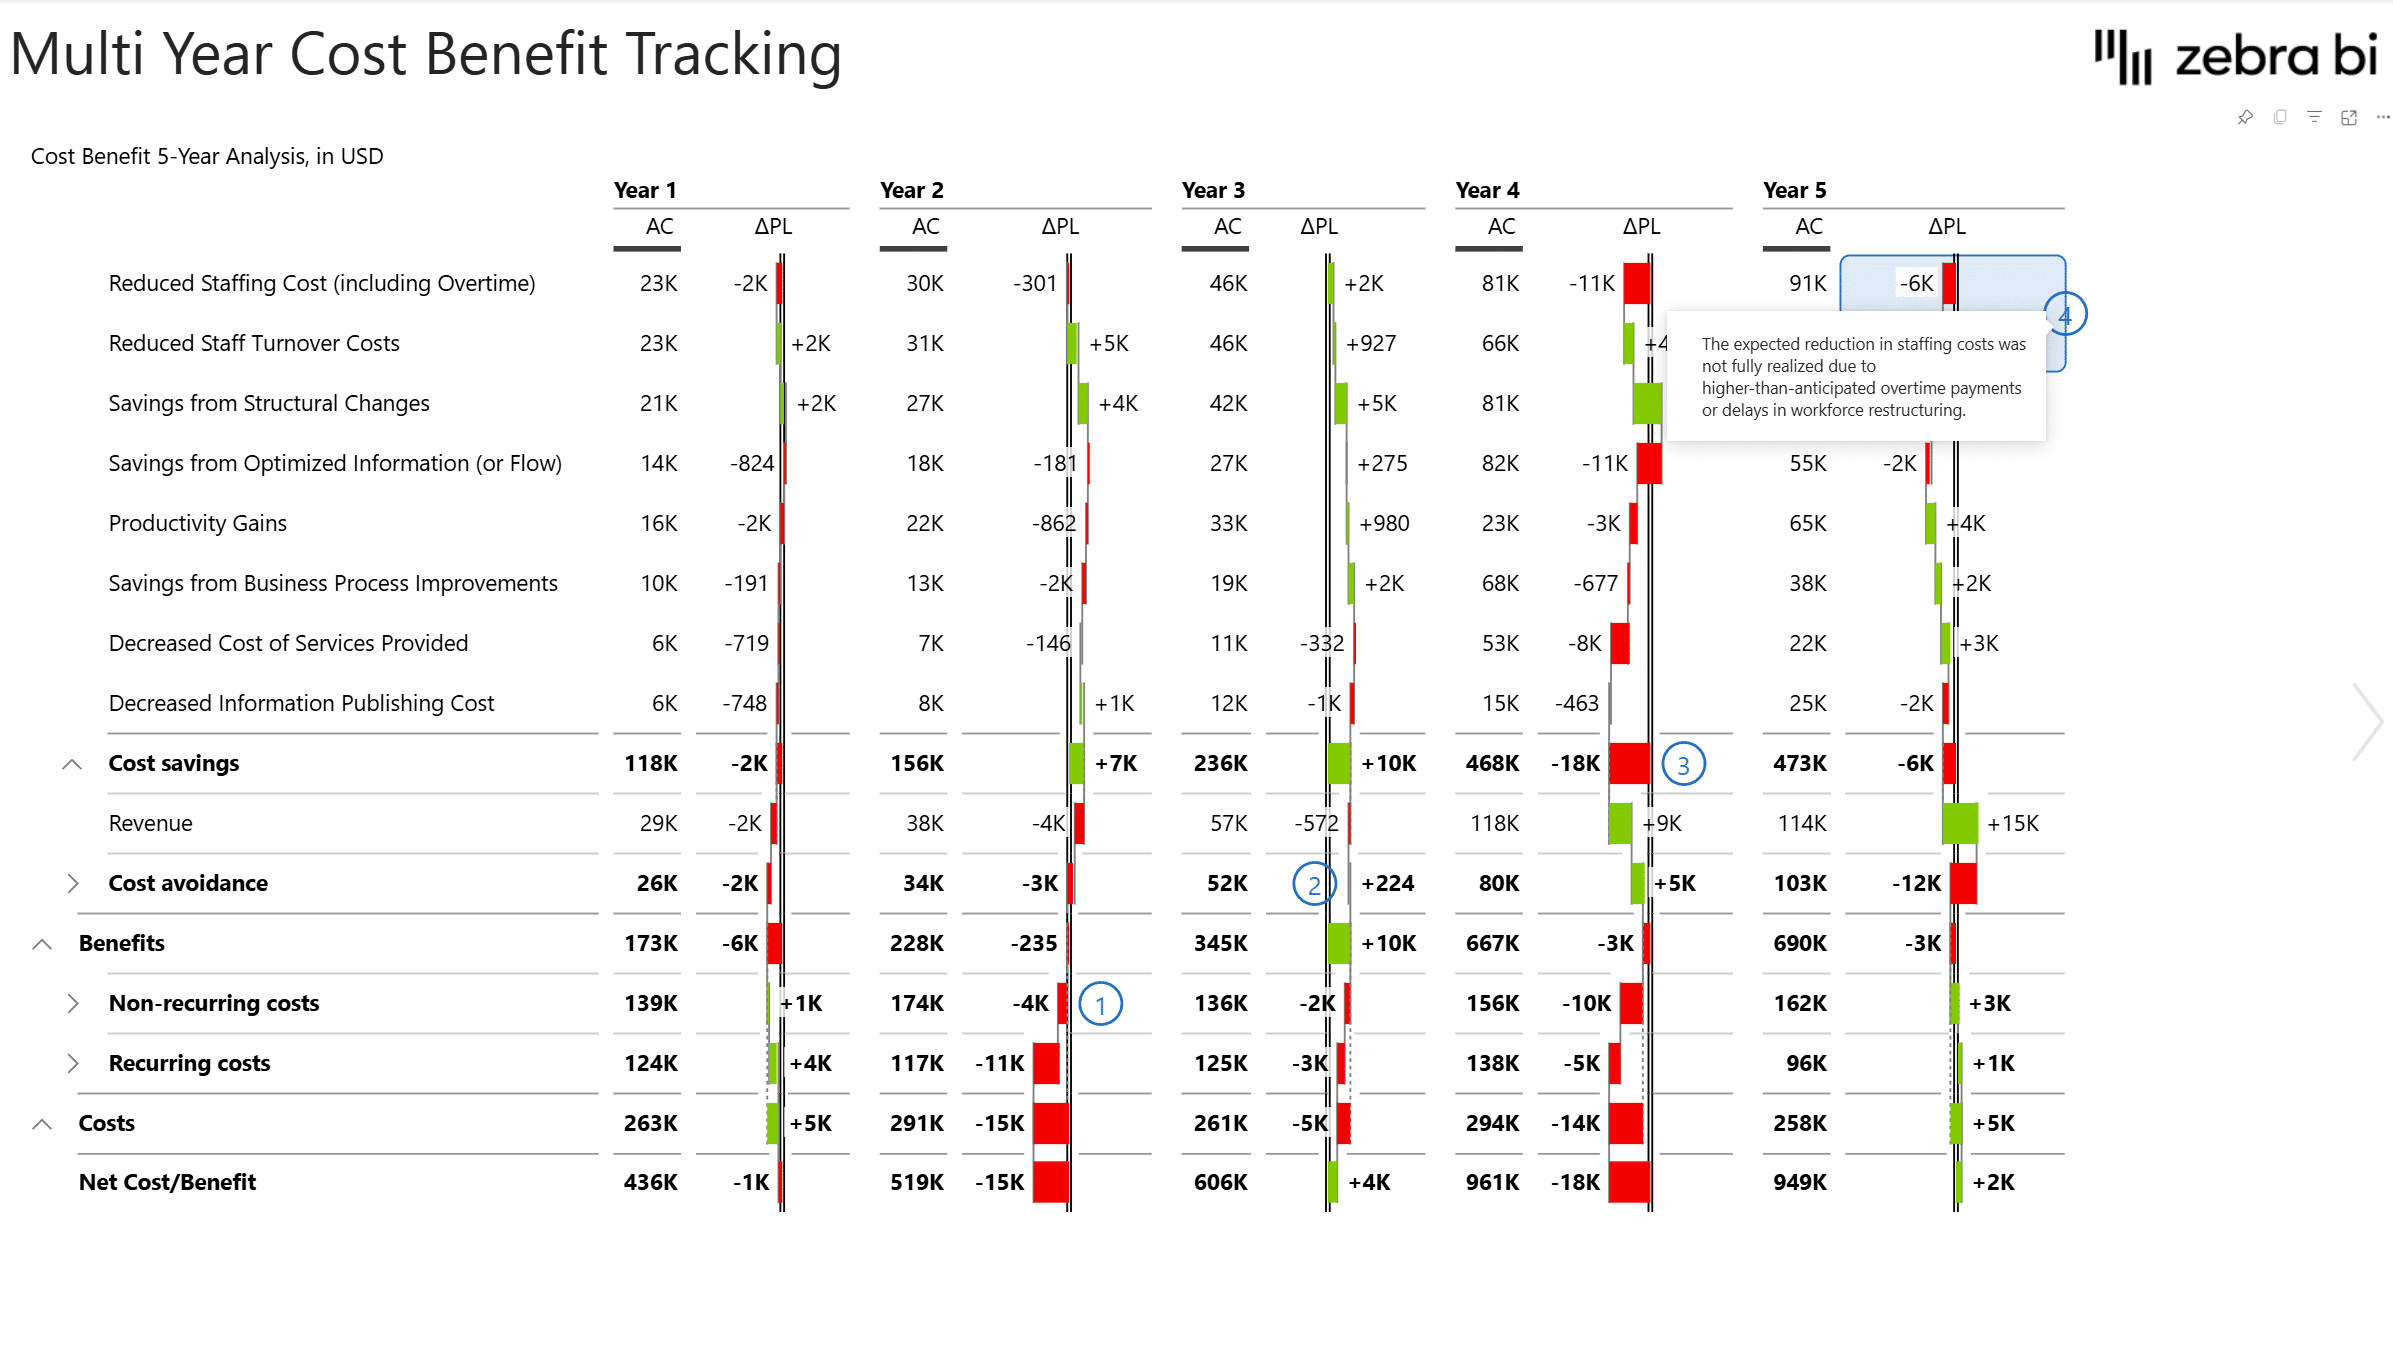
See the full picture for one project across up to 5 years, benefits and costs broken down into their components (cost savings, revenue, cost avoidance, recurring and non-recurring costs), each with its own variance to plan. - CBA trends
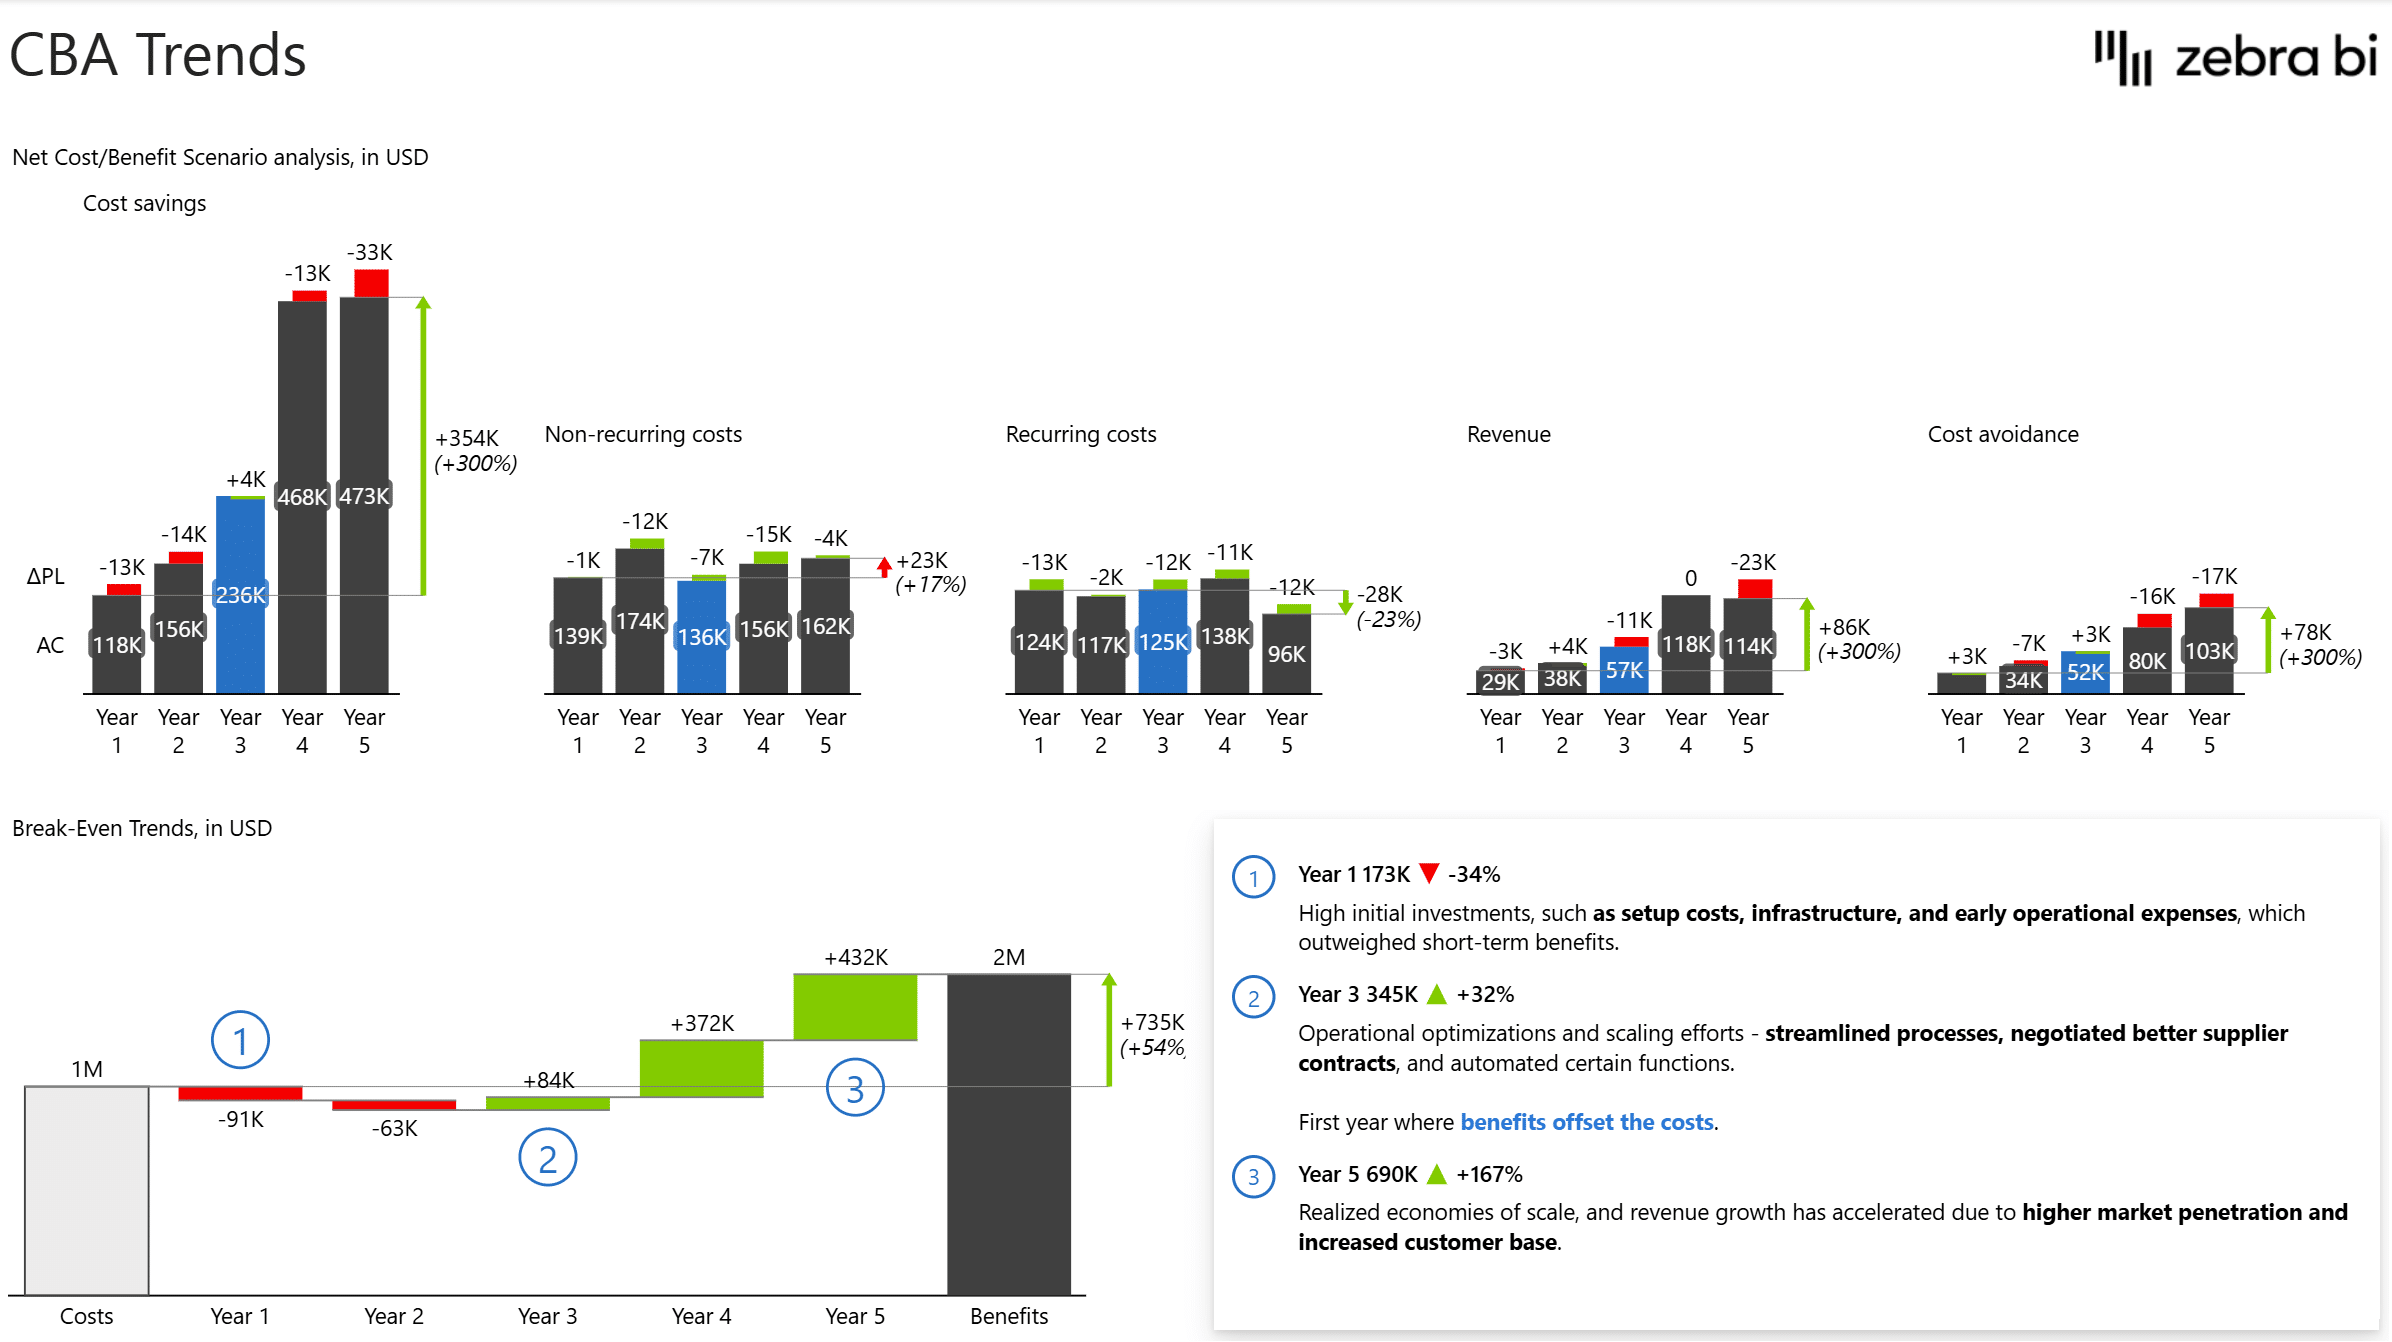
Watch each driver move independently rather than guessing what's behind the total. Cost savings, non-recurring costs, recurring costs, revenue, and cost avoidance each have their own small-multiple trend across years, plus a waterfall bridge showing how Plan became Actual. - Multi-year cost benefit analysis
Read the same multi-year breakdown with written commentary attached, so every jump or dip in the numbers comes with the reason behind it, not just the variance. - Project development, year to year
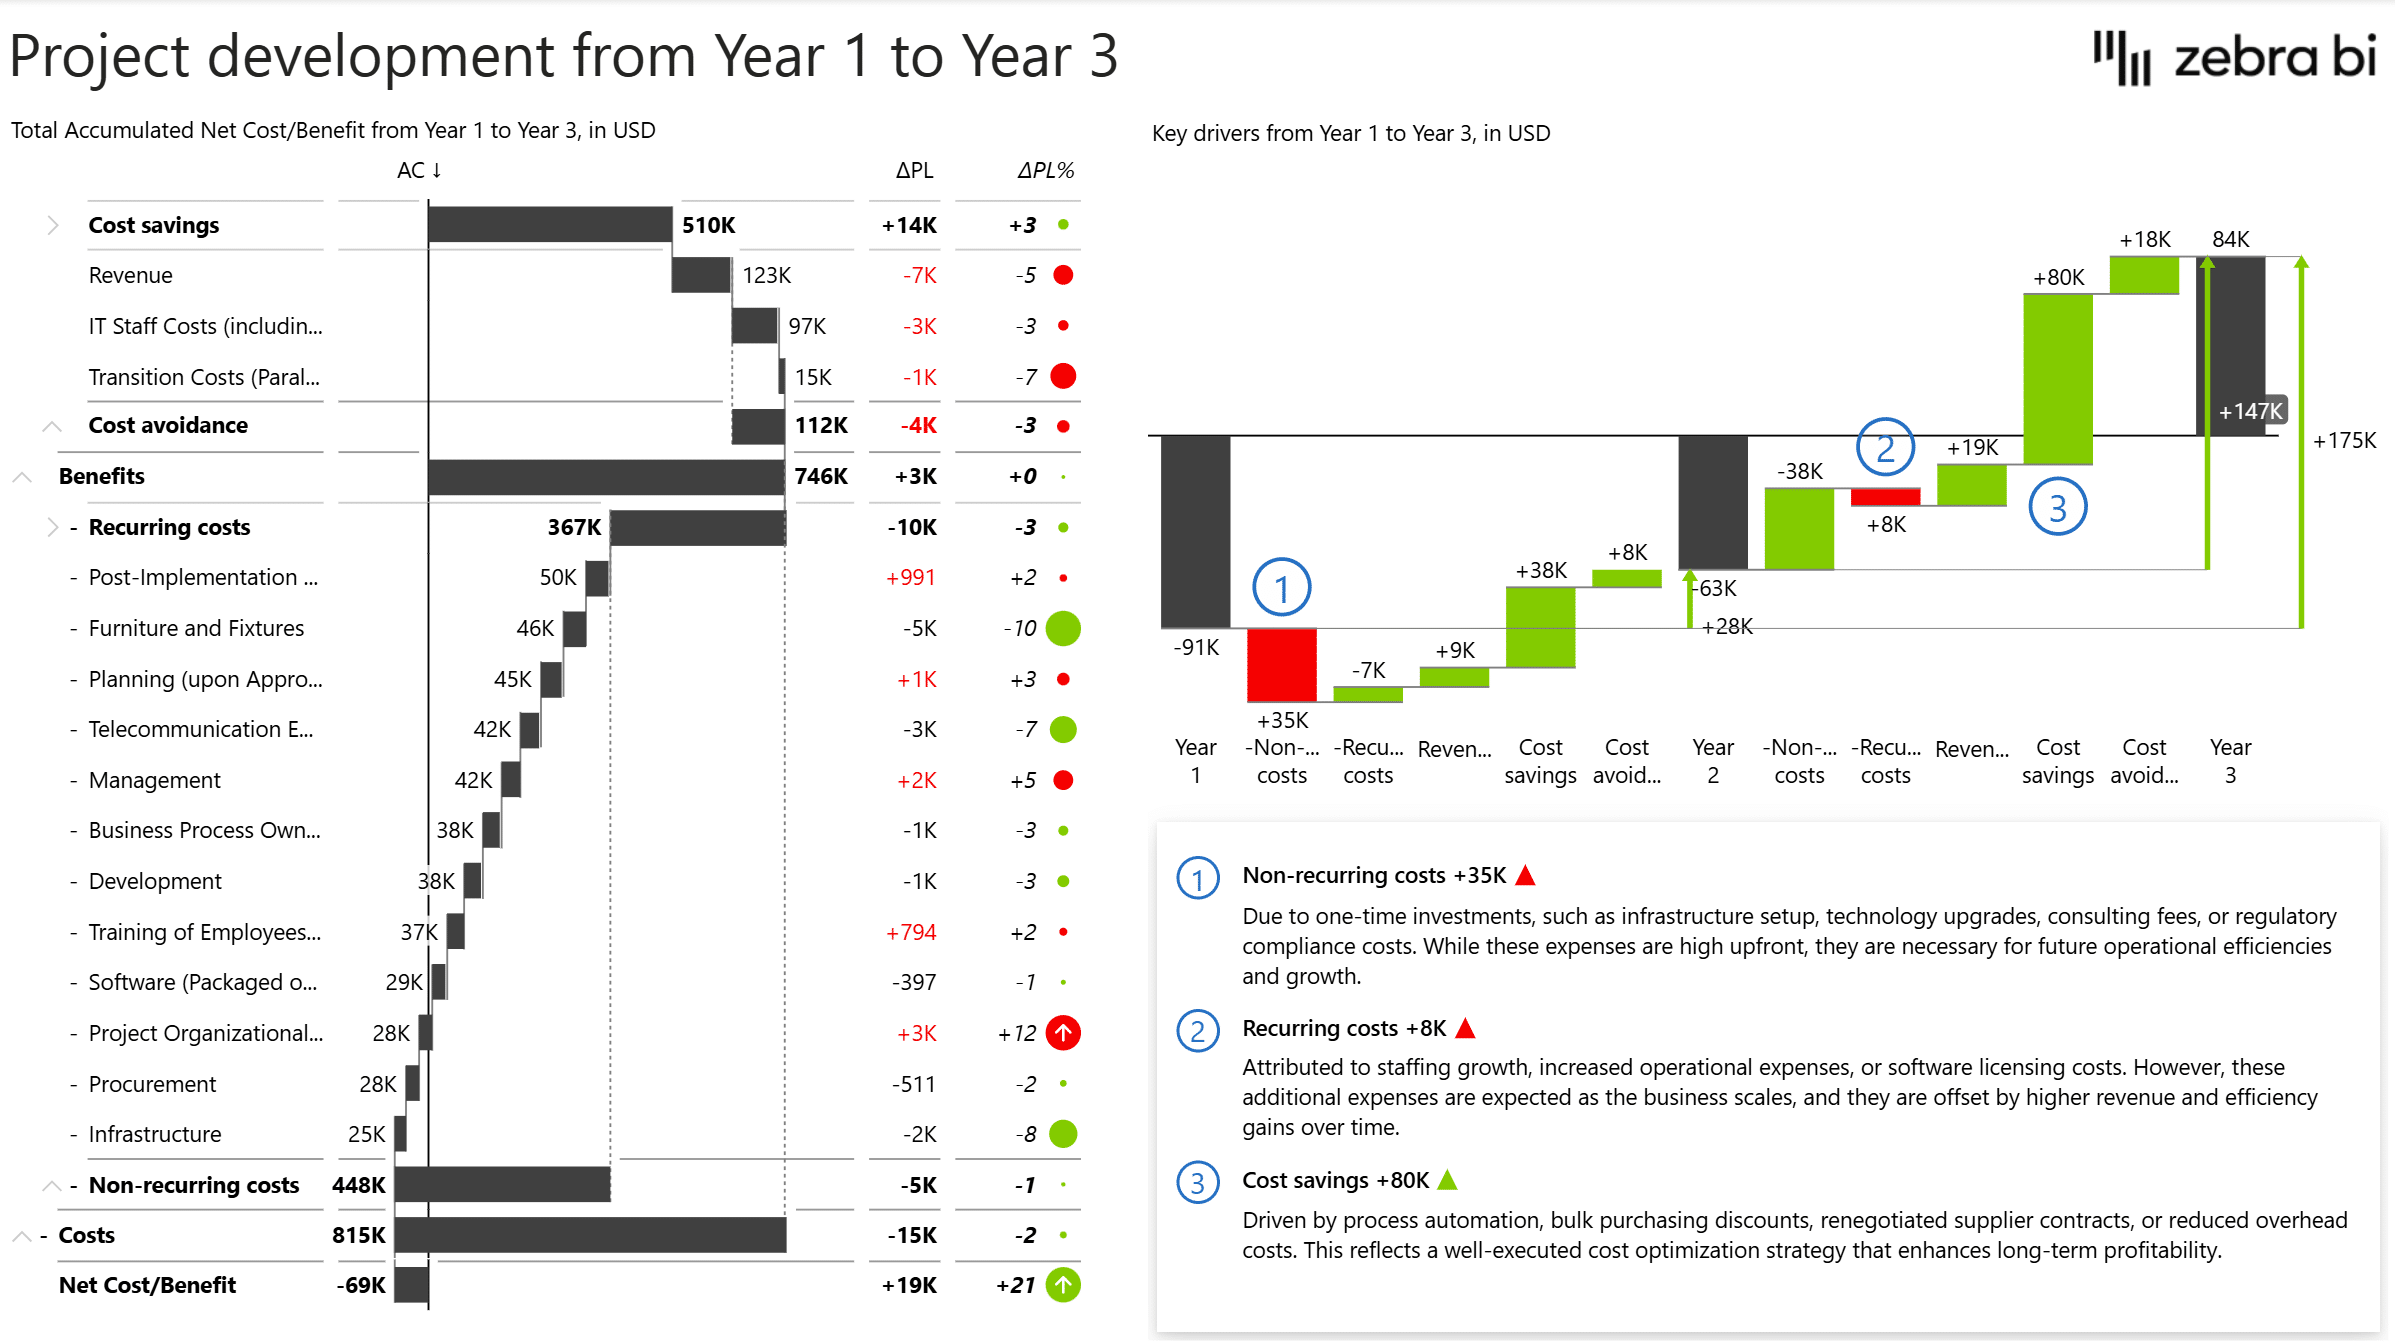
Follow one project's value from Year 1 to Year 3 as a running bridge, so you can see exactly which cost or benefit line added or subtracted the most along the way. - Assessment of potential outcomes
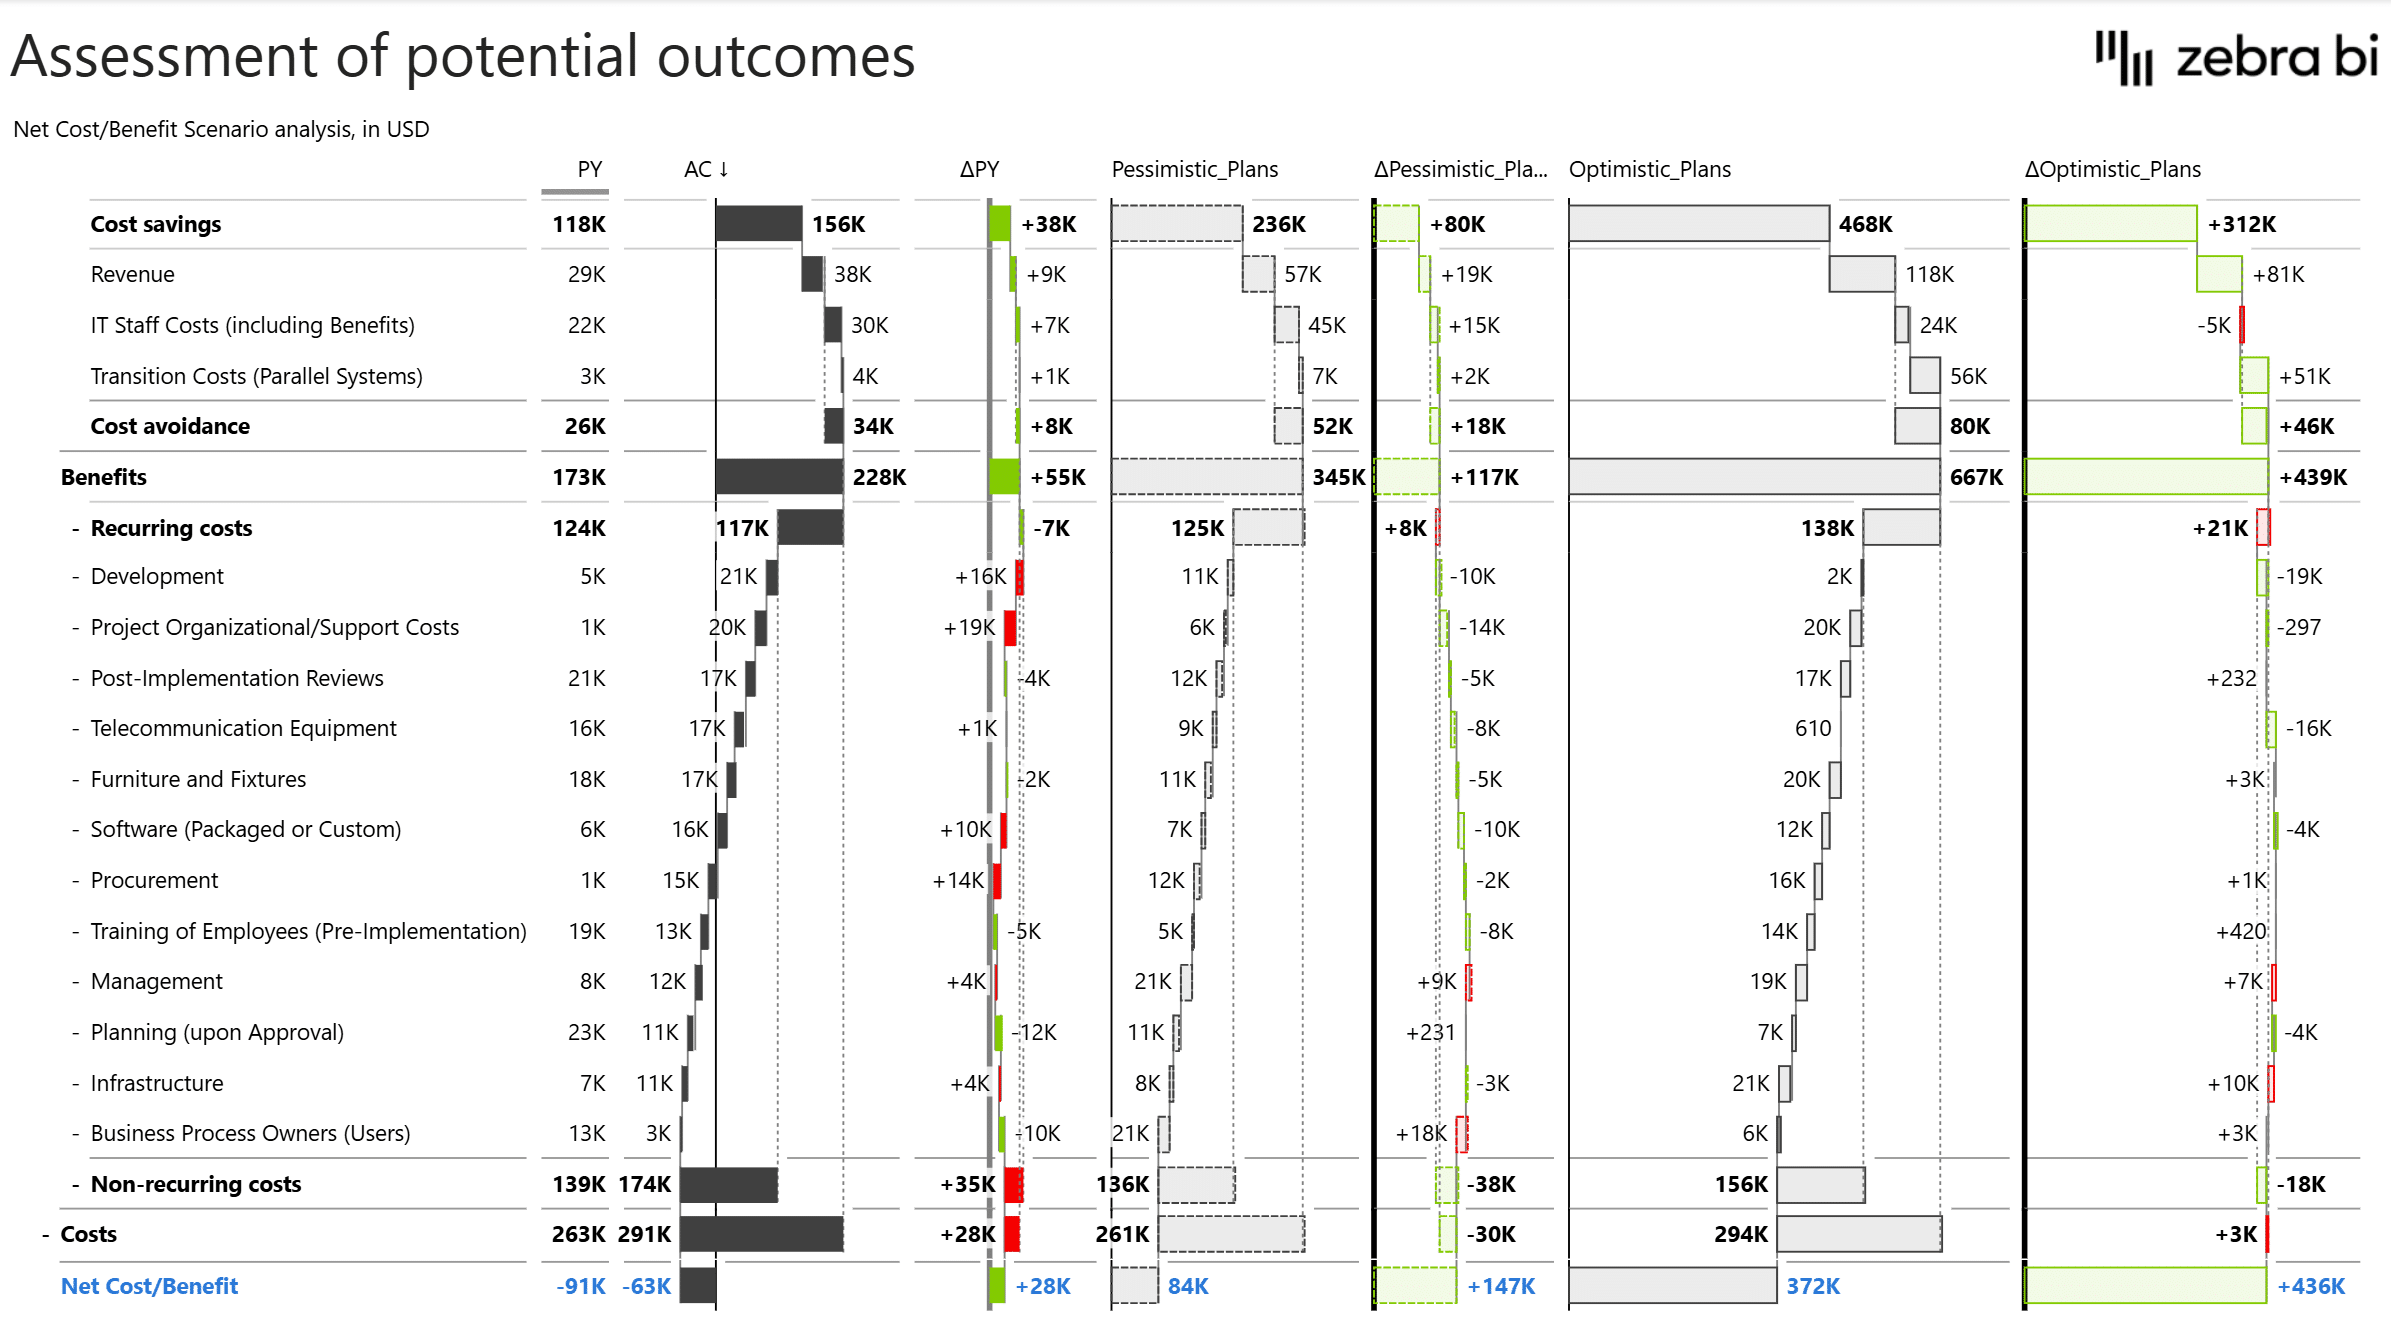
Before committing to a plan, see it next to an optimistic and a pessimistic case side by side, line by line, so you know the range of outcomes you're actually signing up for.
Built with Zebra BI visuals for Power BI
This Power BI Cost Benefit Analysis template is built using Zebra BI Tables and Charts, so you can:
- Get automatic variance analysis (plan, prior year, optimistic/pessimistic case) with no custom DAX.
- See clear cost-benefit waterfalls and bridges from Plan to Actual, and year to year.
- Track multi-year trends across costs, benefits, and cost avoidance in one view
- Trust transparent calculations for every driver, not a black-box total.
- Add annotations and commentary to explain why a number moved.
- See trends clearly across every KPI, consistently scaled, so you can quickly tell how much each one contributes.
With Zebra BI’s template, you focus on whether the project is worth the investment or not, instead of wasting time on manual calculations.
Download the Cost Benefit Analysis template
If you're looking for a practical Power BI template that tracks multi-year costs, benefits, and scenario planning in one place, this dashboard gives you a ready-to-use foundation you can build on.
Download the Cost Benefit Analysis template in Power BI and find out whether your next project is the right move or if you should go back to the drawing board.
Get started in 3 steps
1
Download & Open
Download the .pbix file and open it in Power BI Desktop
2
Connect Your Data
Replace sample data with your CRM, ERP, or database source
3
Customize & Publish
Adjust KPIs, colors, and branding, then publish to Power BI Service
Fill out the form and get the Power BI template

20,000+ users have downloaded this template