Consolidated Financials in Power BI
Zebra BI for Power BI


Overview
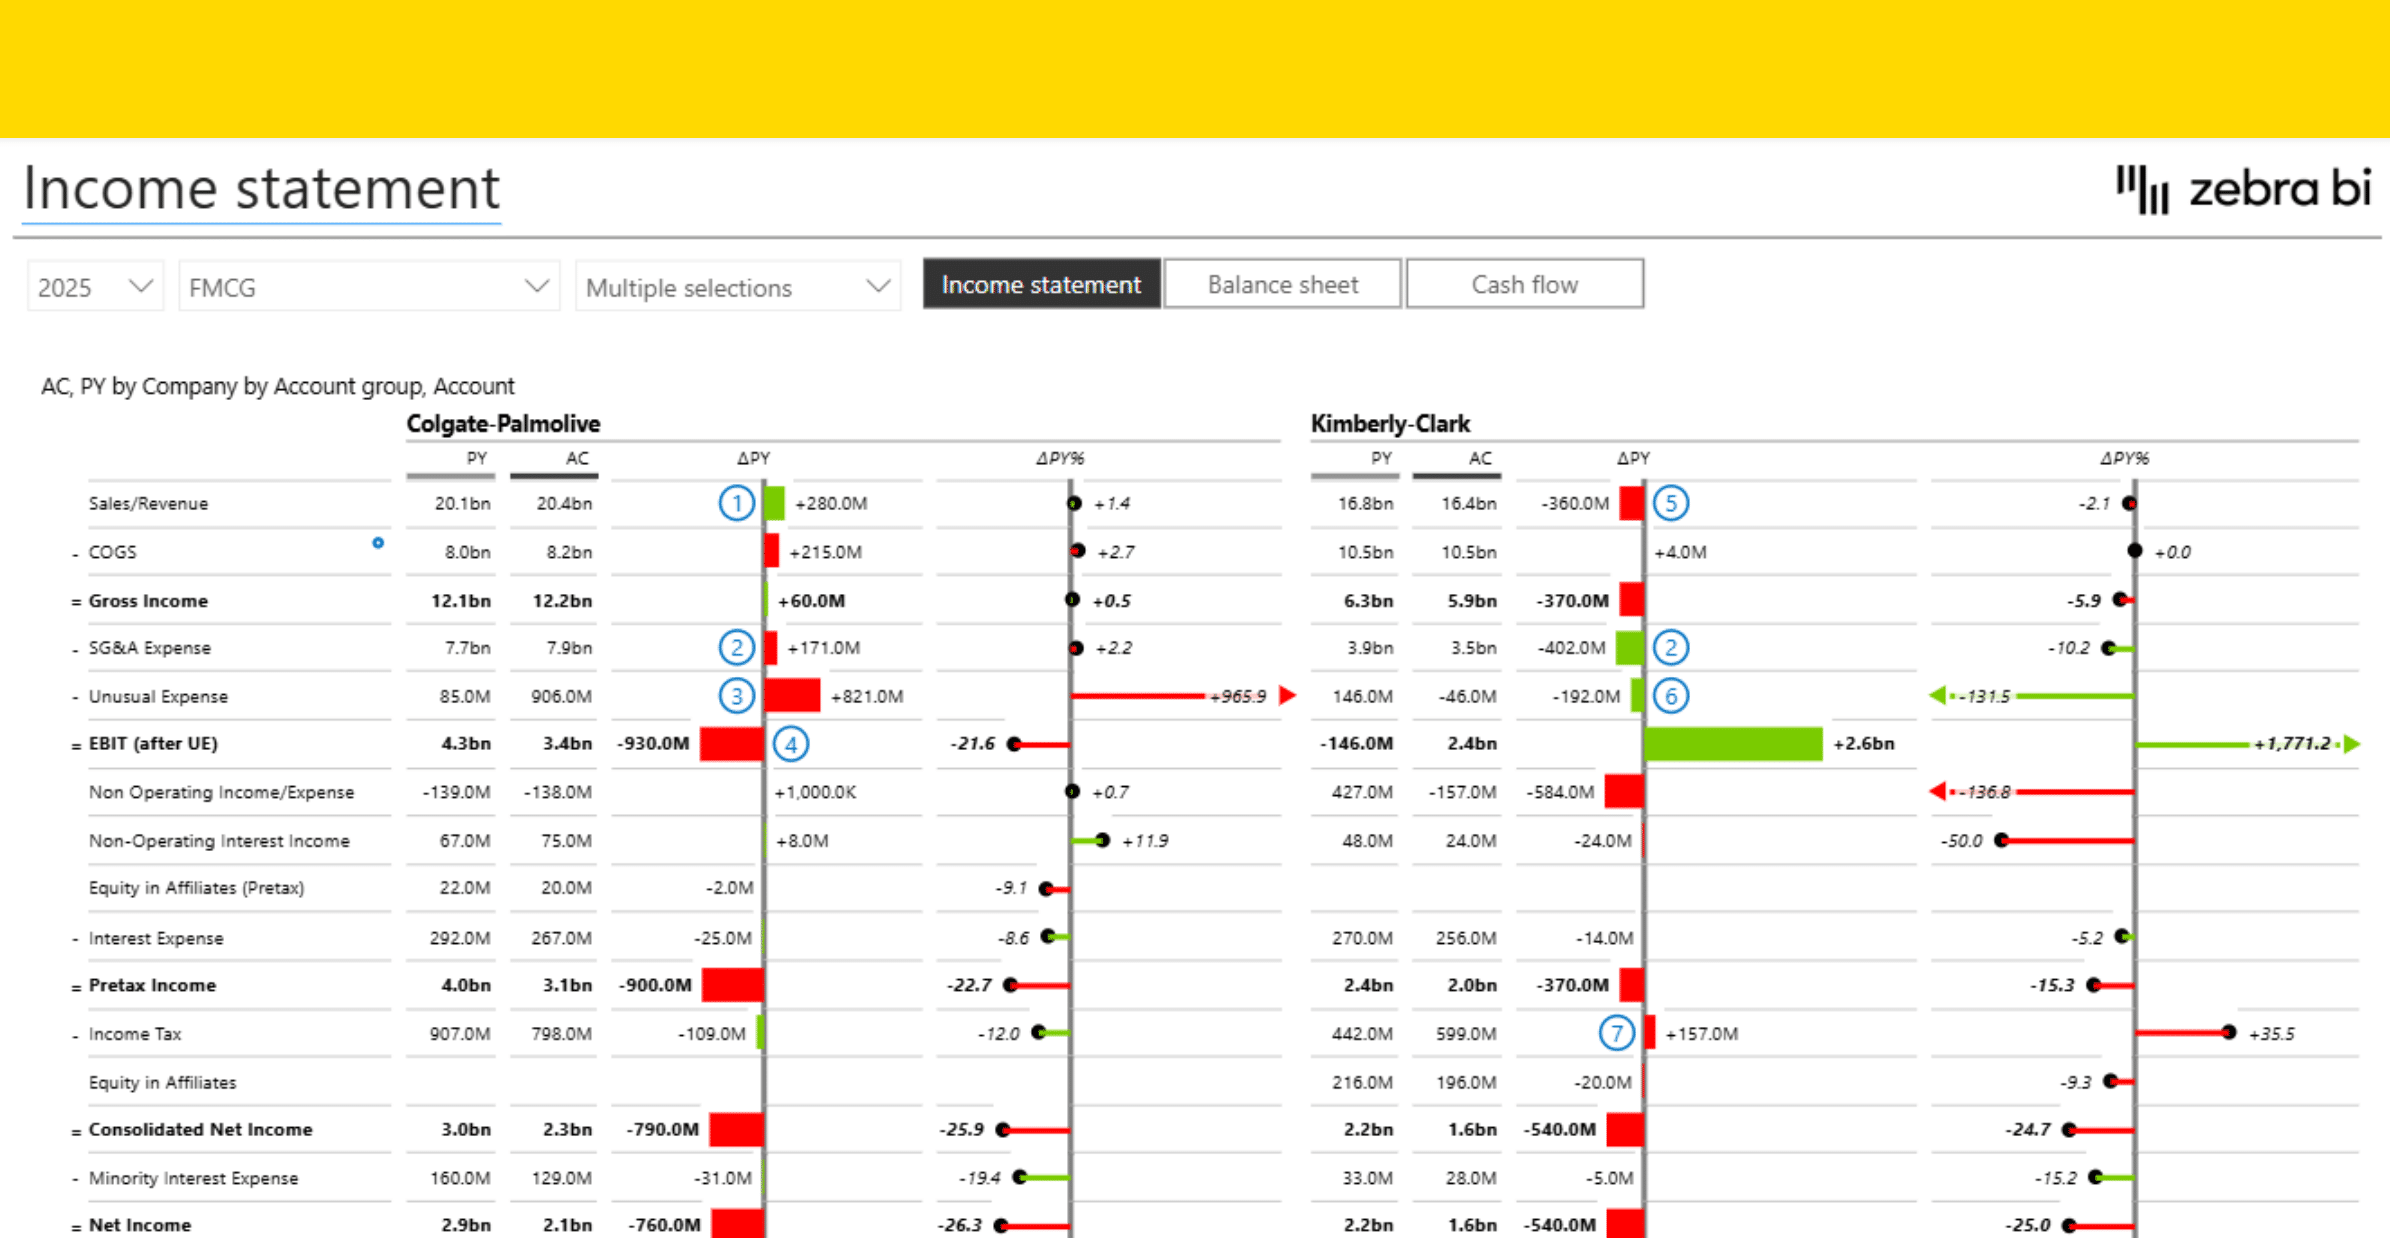
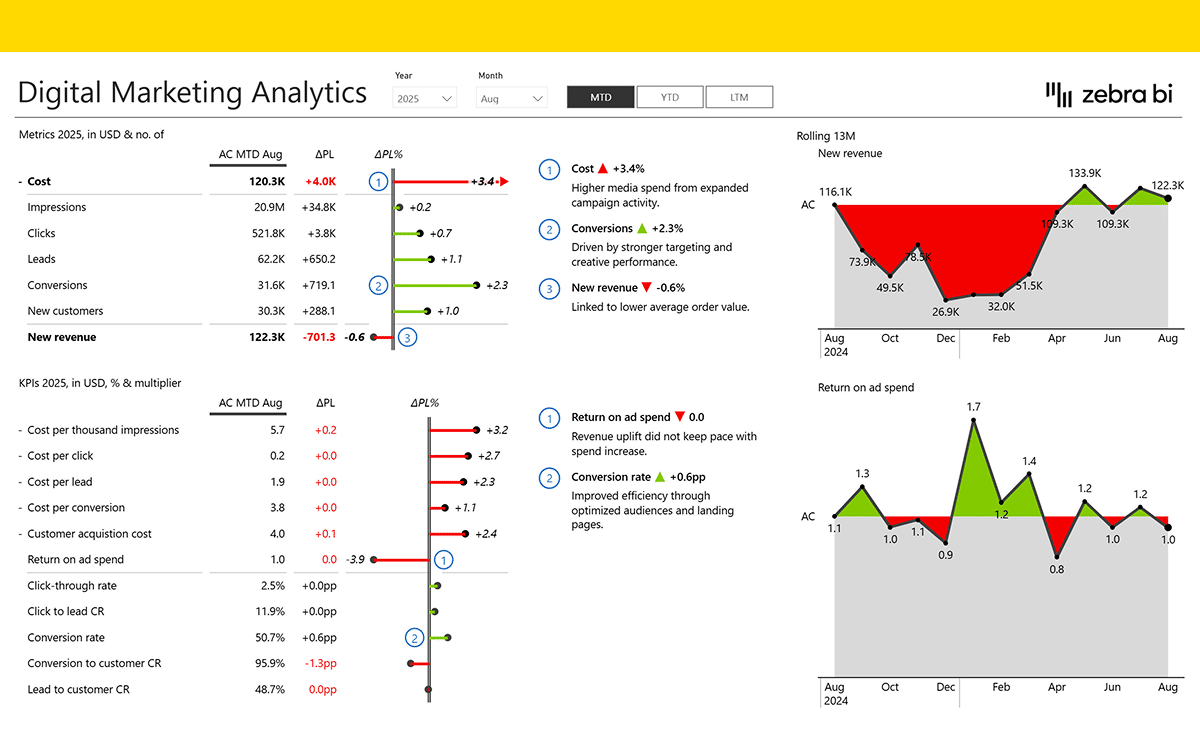
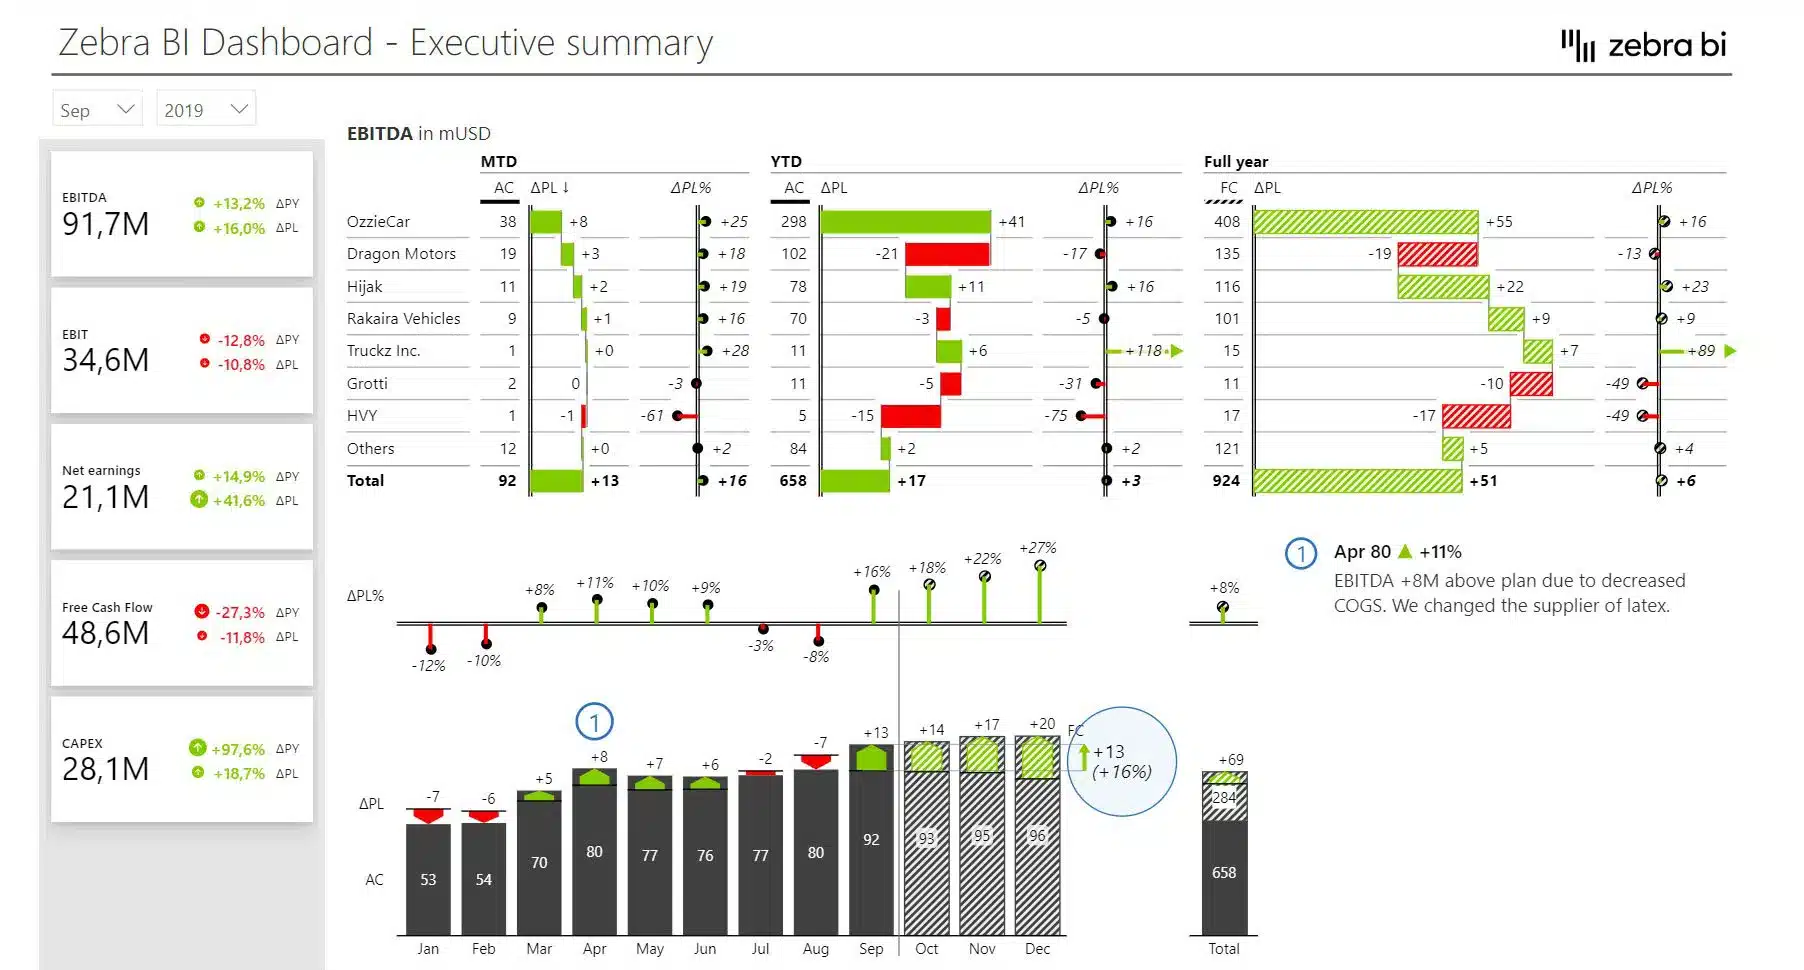
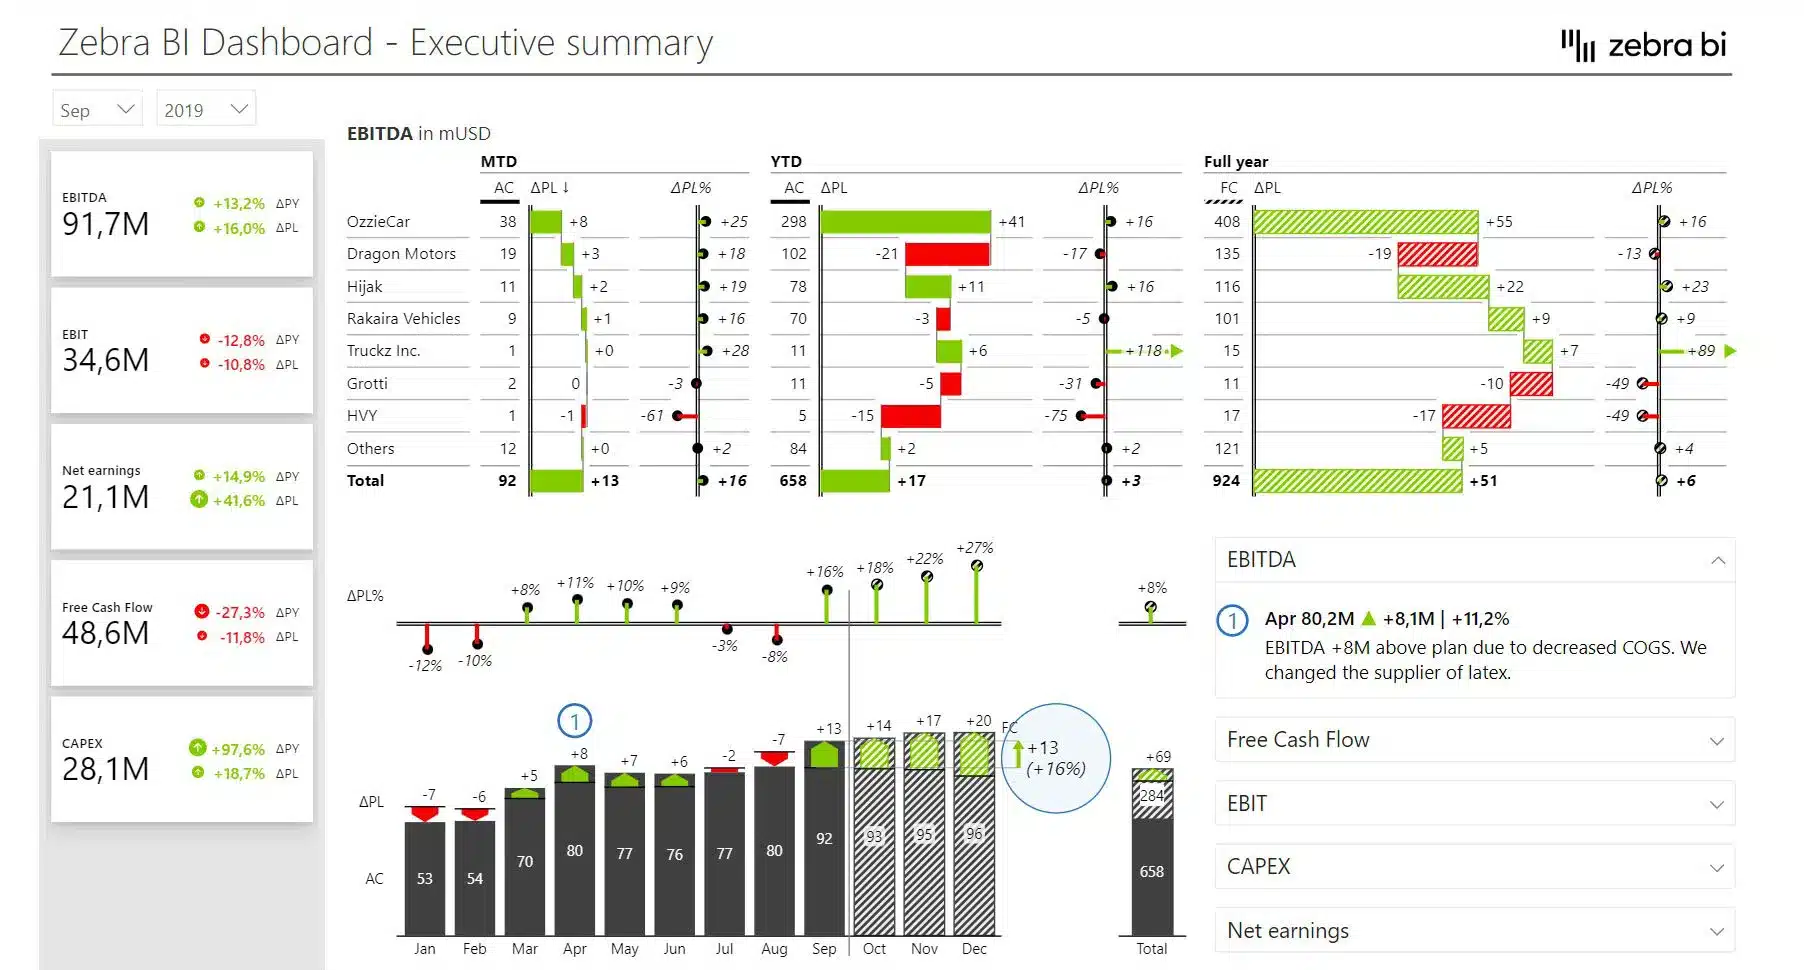
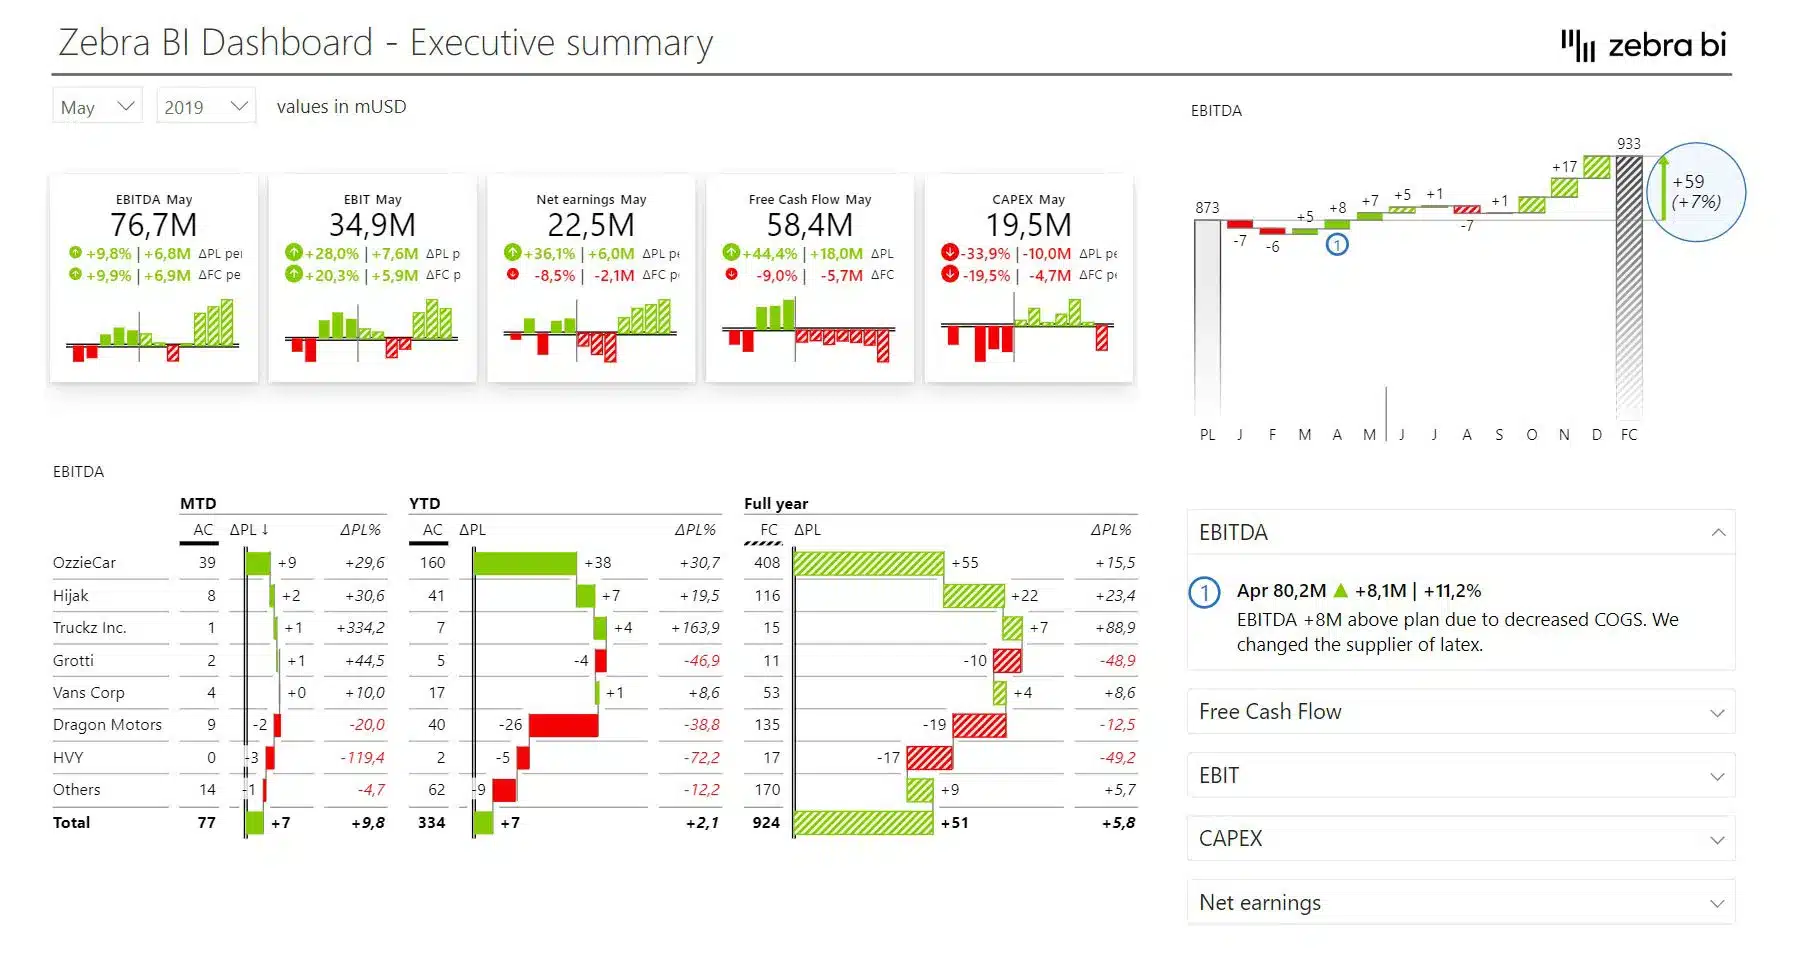
This Power BI template is designed to help you make an actionable overview of financials for the management. Spoiler alert: it includes lots of waterfall charts.
Play with the interactive demo below. If you click the ⤢ icon at the bottom-right of the report page you'll be able to enjoy the full-screen view.
Get started in 3 steps
1
Download & Open
Download the .pbix file and open it in Power BI Desktop
2
Connect Your Data
Replace sample data with your CRM, ERP, or database source
3
Customize & Publish
Adjust KPIs, colors, and branding, then publish to Power BI Service
Fill out the form and get the Power BI template
20,000+ users have downloaded this template