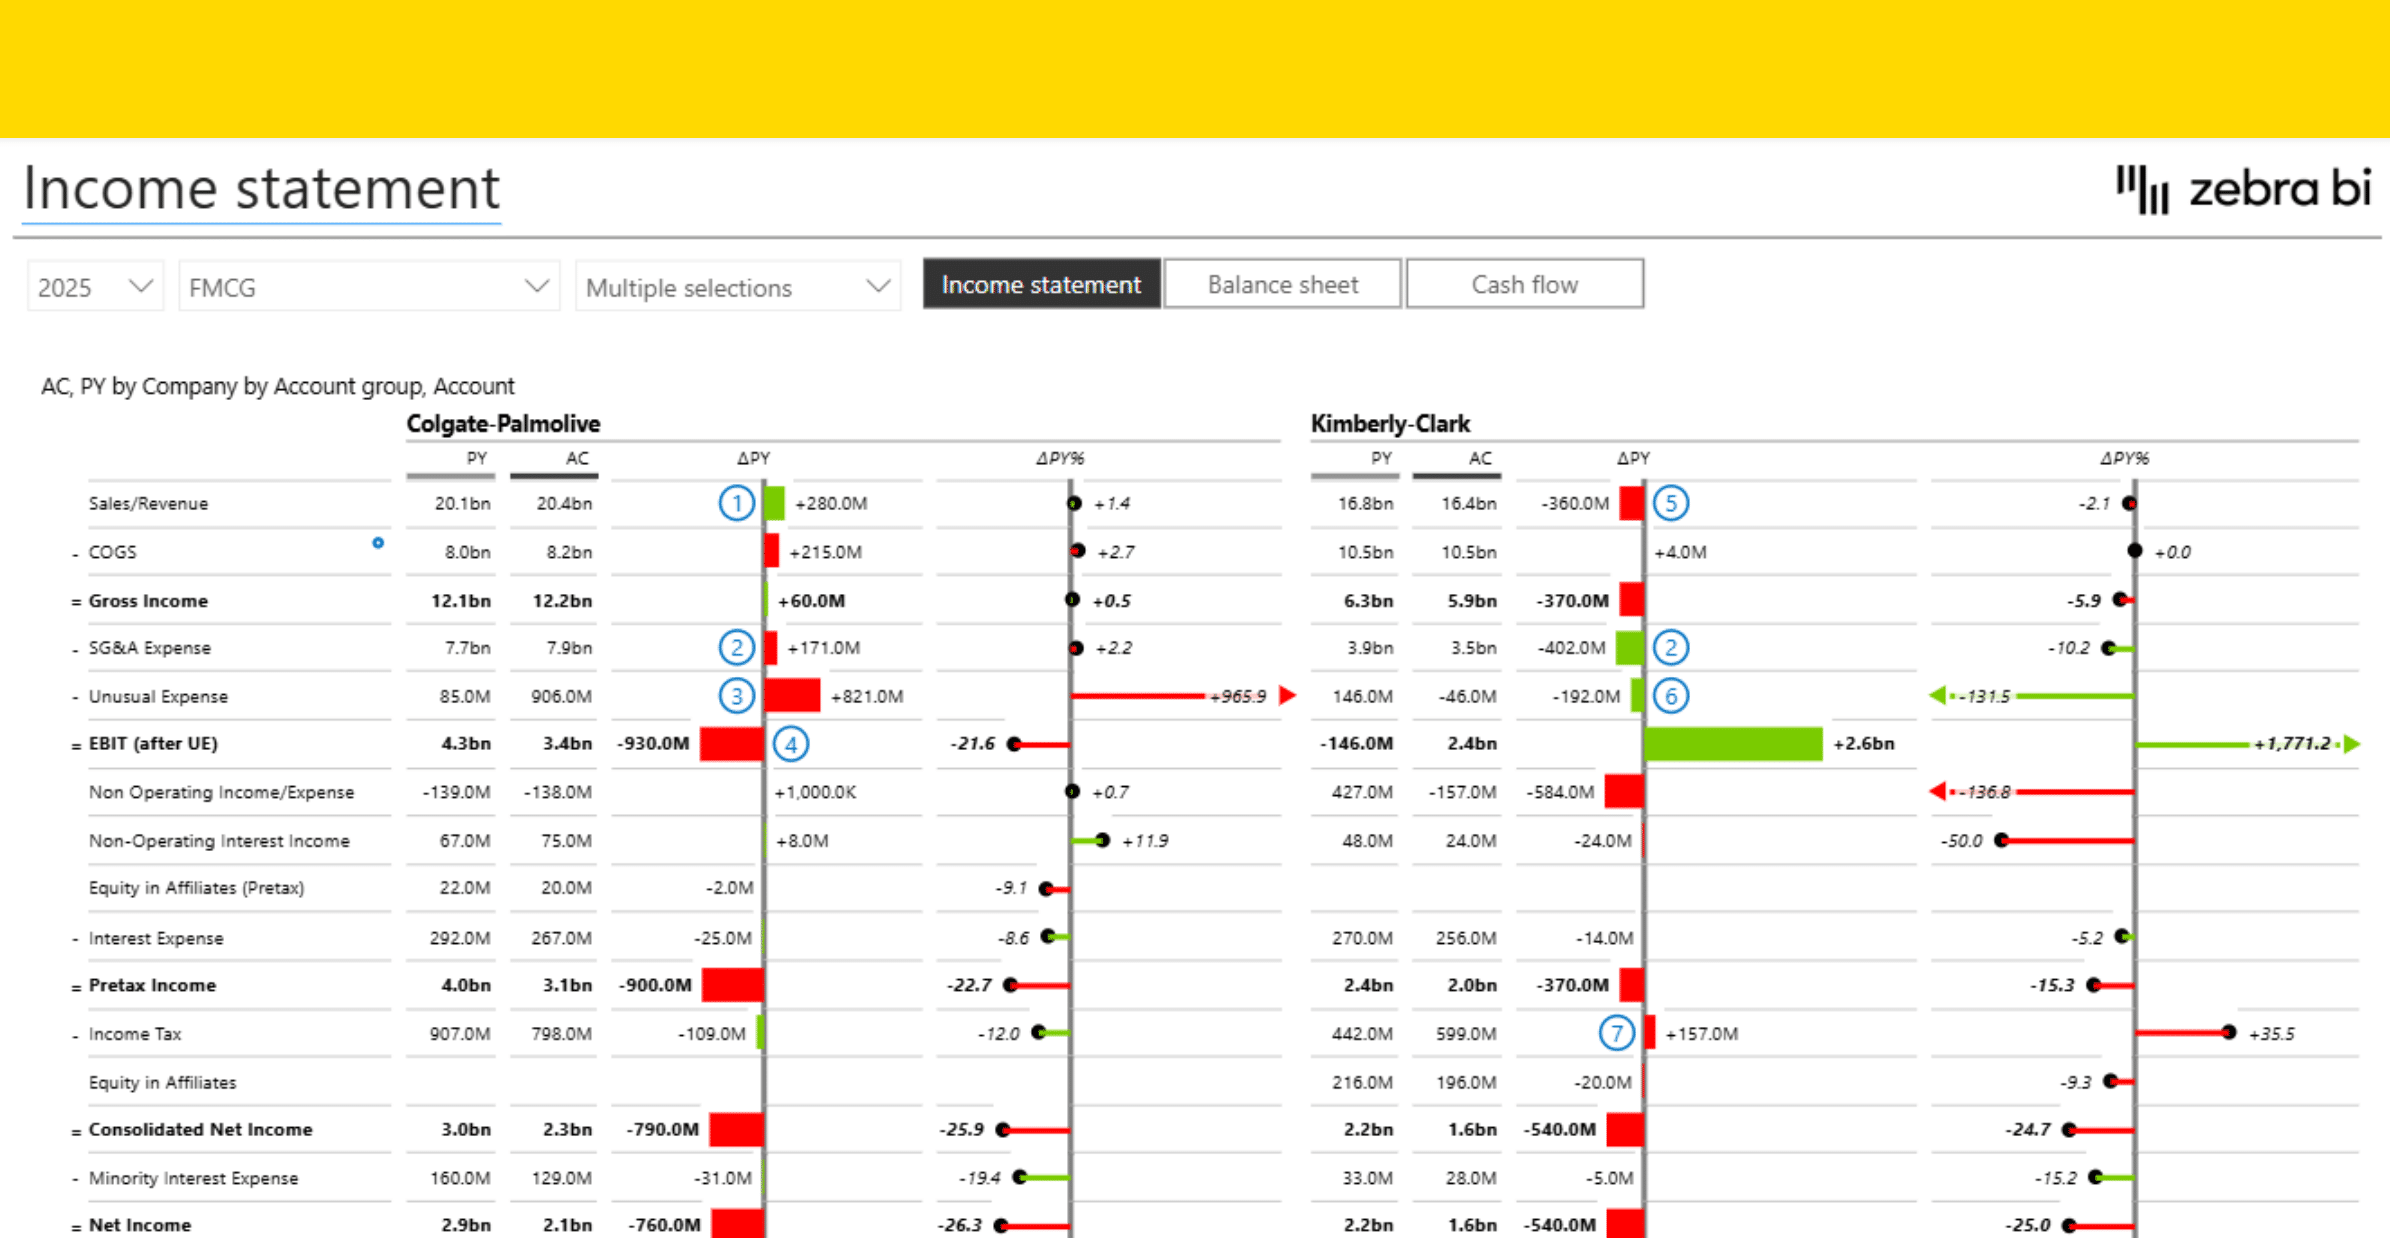
Cost management Power BI template for OPEX & forecasts (free)

Zebra BI for Power BI
An efficient Power BI template for ongoing cost management, tracking cost centers, vendors, and OPEX against plan, prior year, and forecast.




Overview
The Cost management template gives controllers, FP&A professionals, and CFOs one place to track costs, month after month, instead of putting together numbers from separate reports.
It covers cost centers, vendors, and OPEX, each with automatic variances to plan, prior year, and forecast. Additionally, the template includes waterfall charts that show exactly what drove a number up or down.
You can use this Power BI template to spot problems early, run OPEX forecast scenarios, and see where your business resources are going before month-end, not after. It's also where controllers check the numbers are right before close, and where finance teams see how the full year is shaping up.
Play with the interactive demo below. If you click the ⤢ icon at the bottom-right of the report page you'll be able to enjoy the full-screen view.
Inside this template
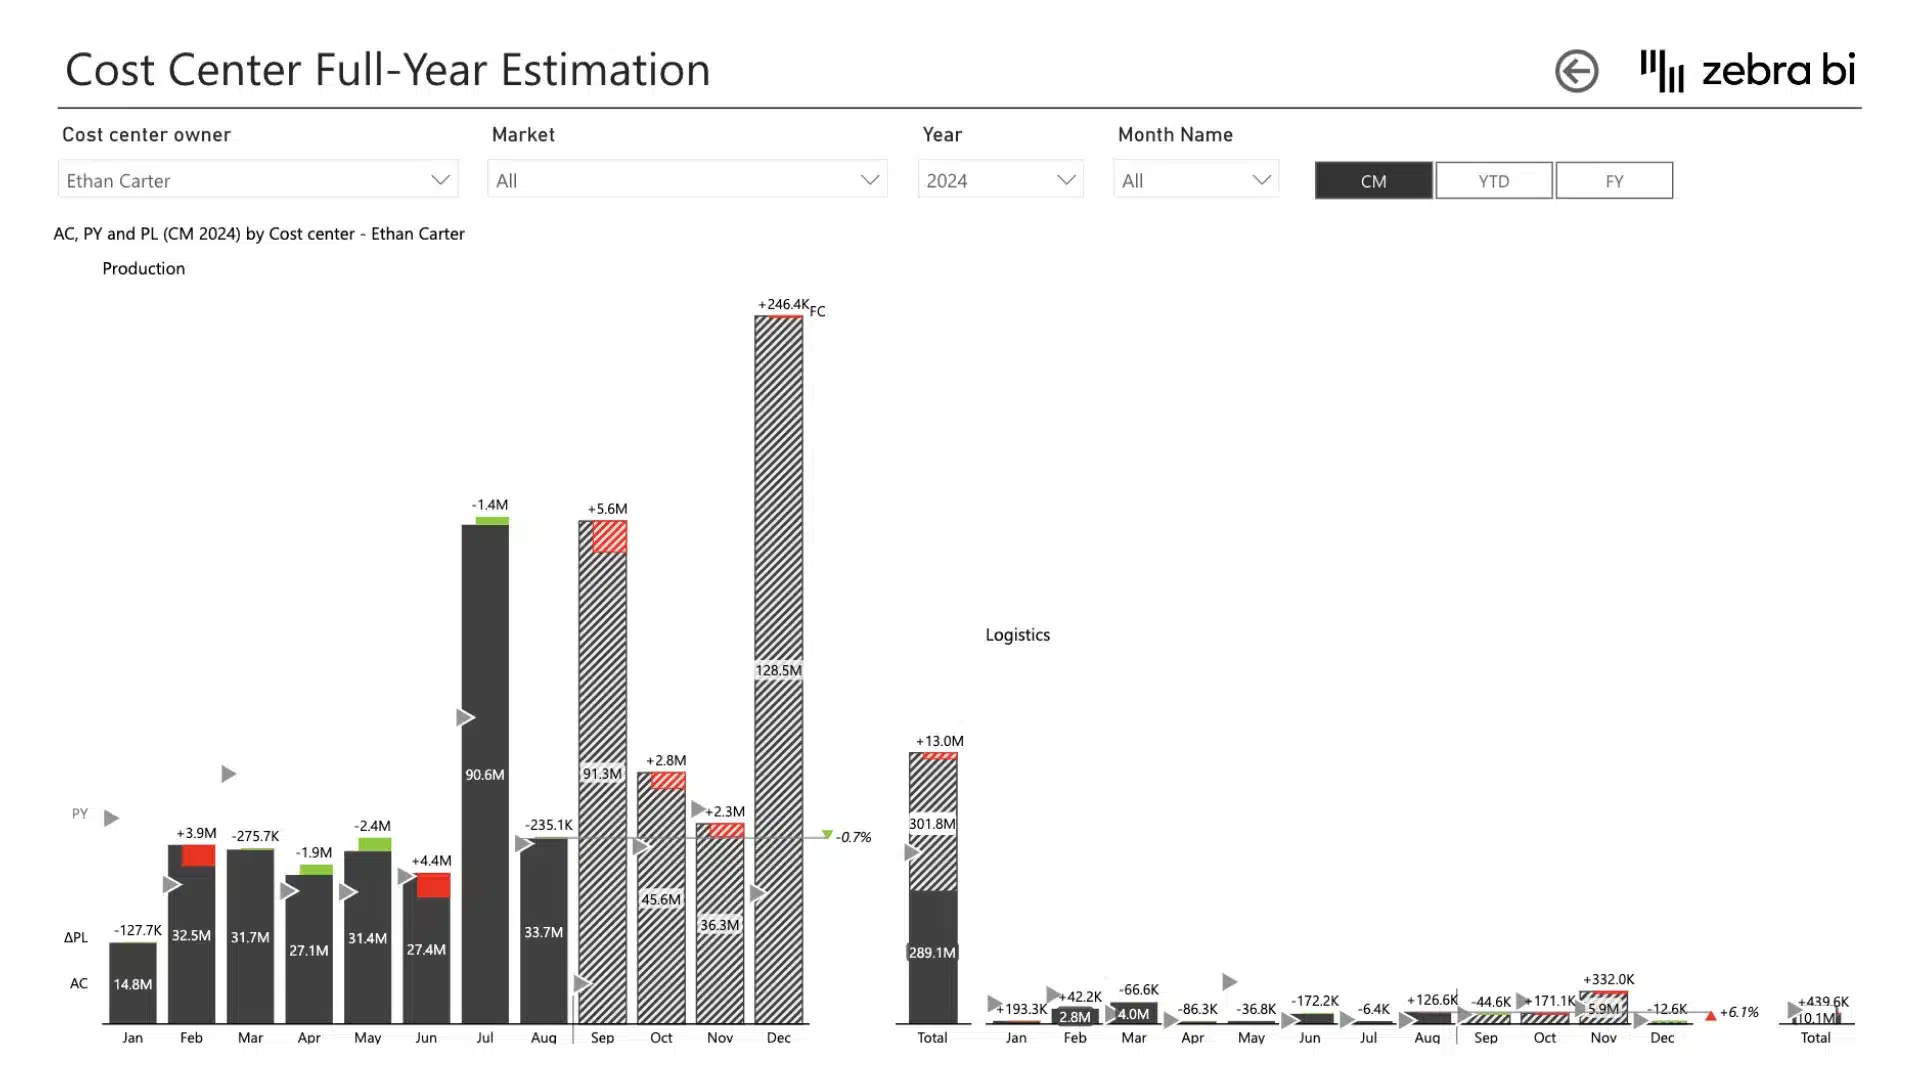
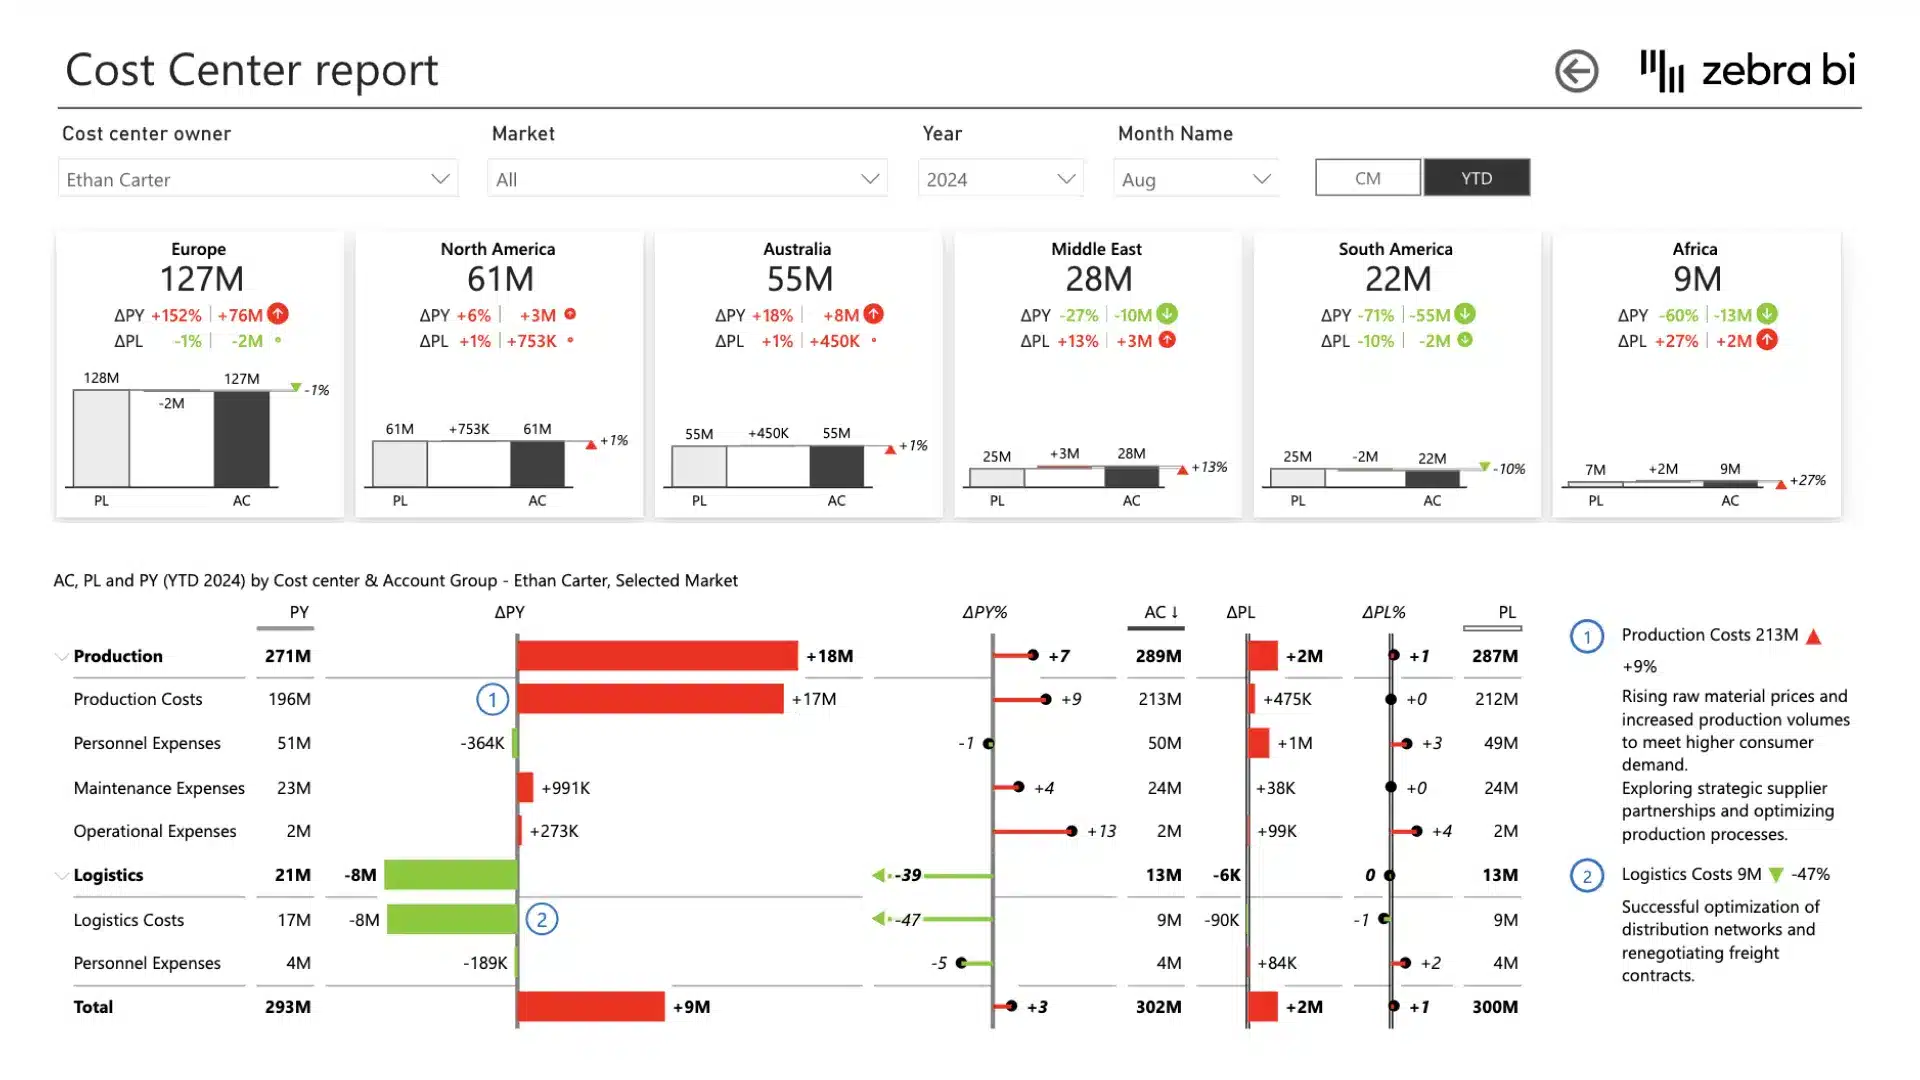
Cost center reporting
OPEX reporting, with waterfall charts
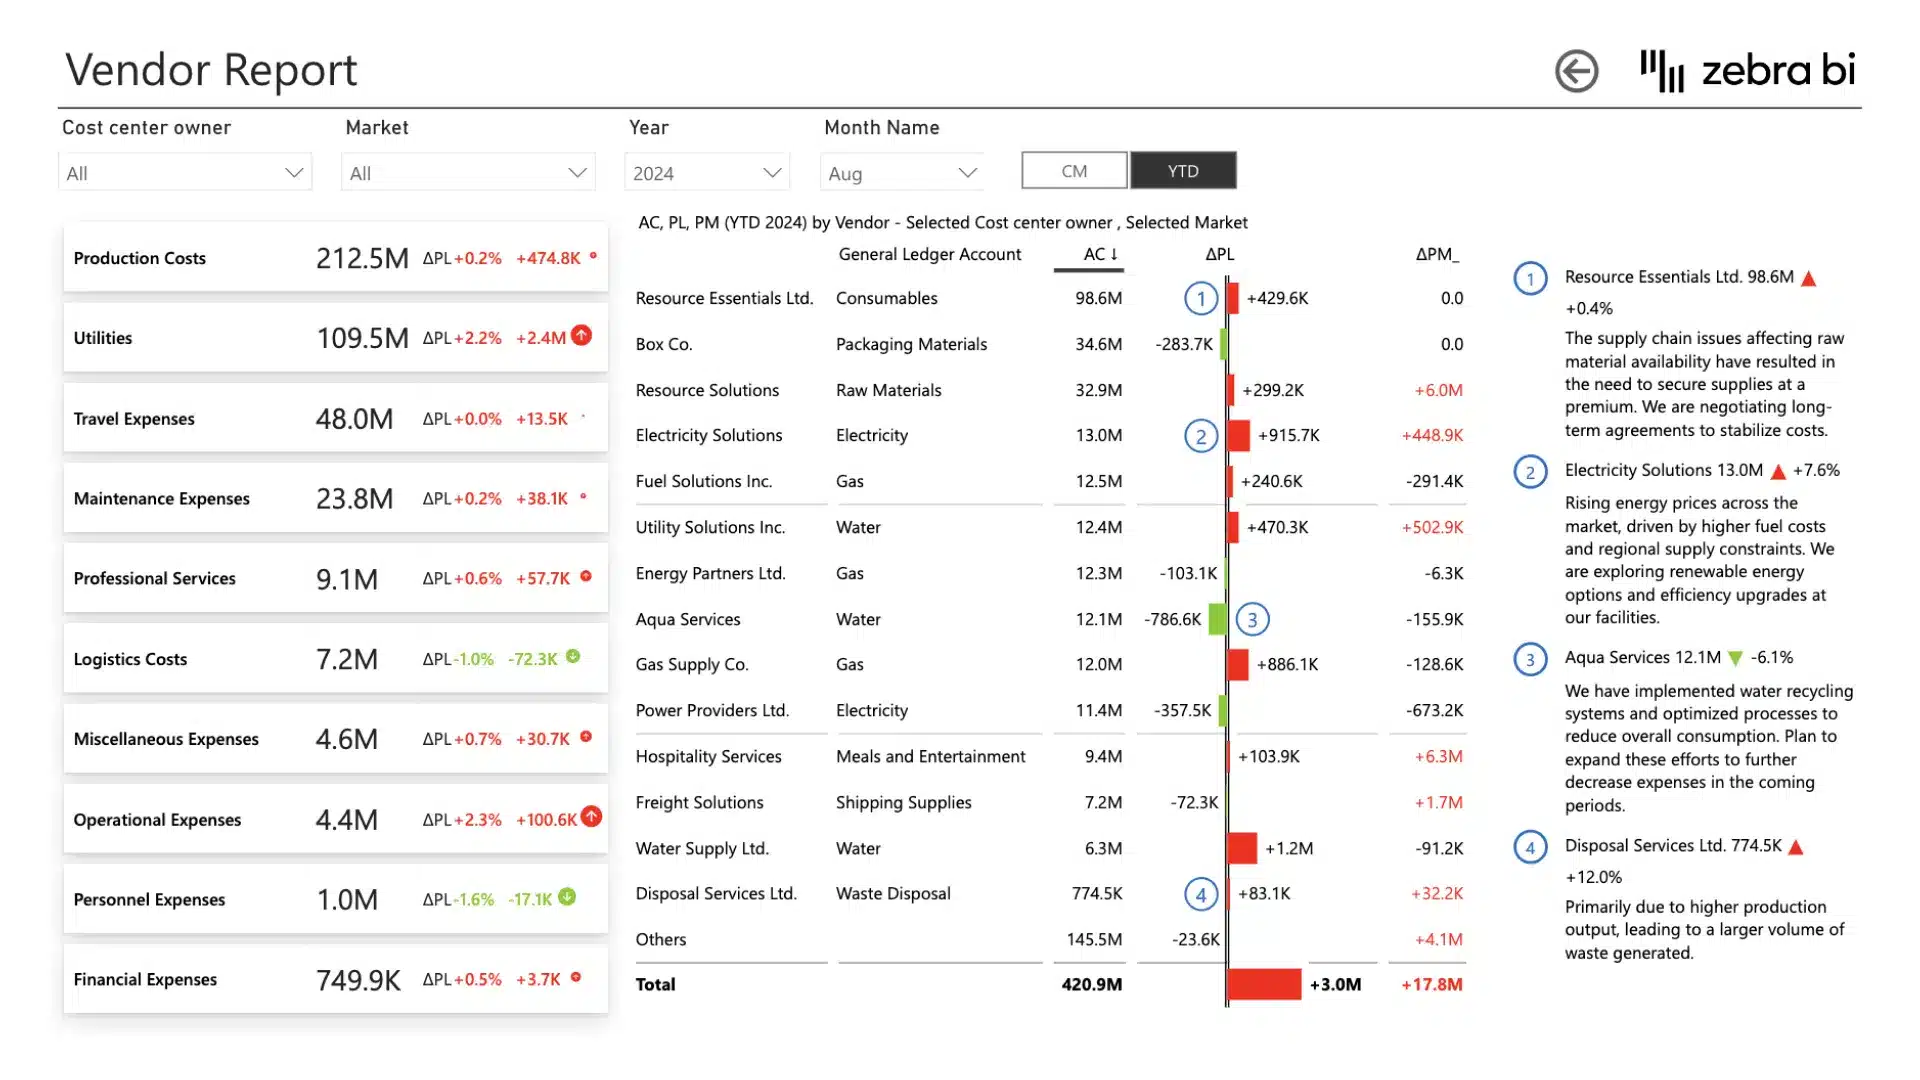
Vendor-level reporting
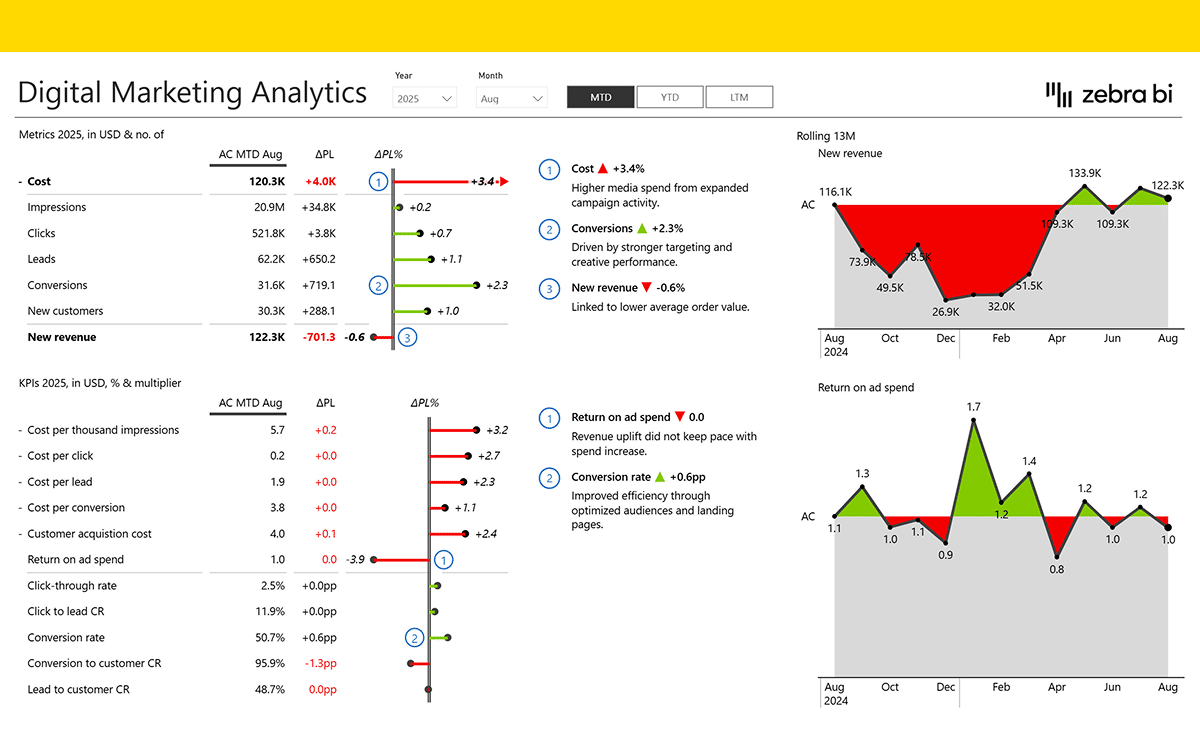
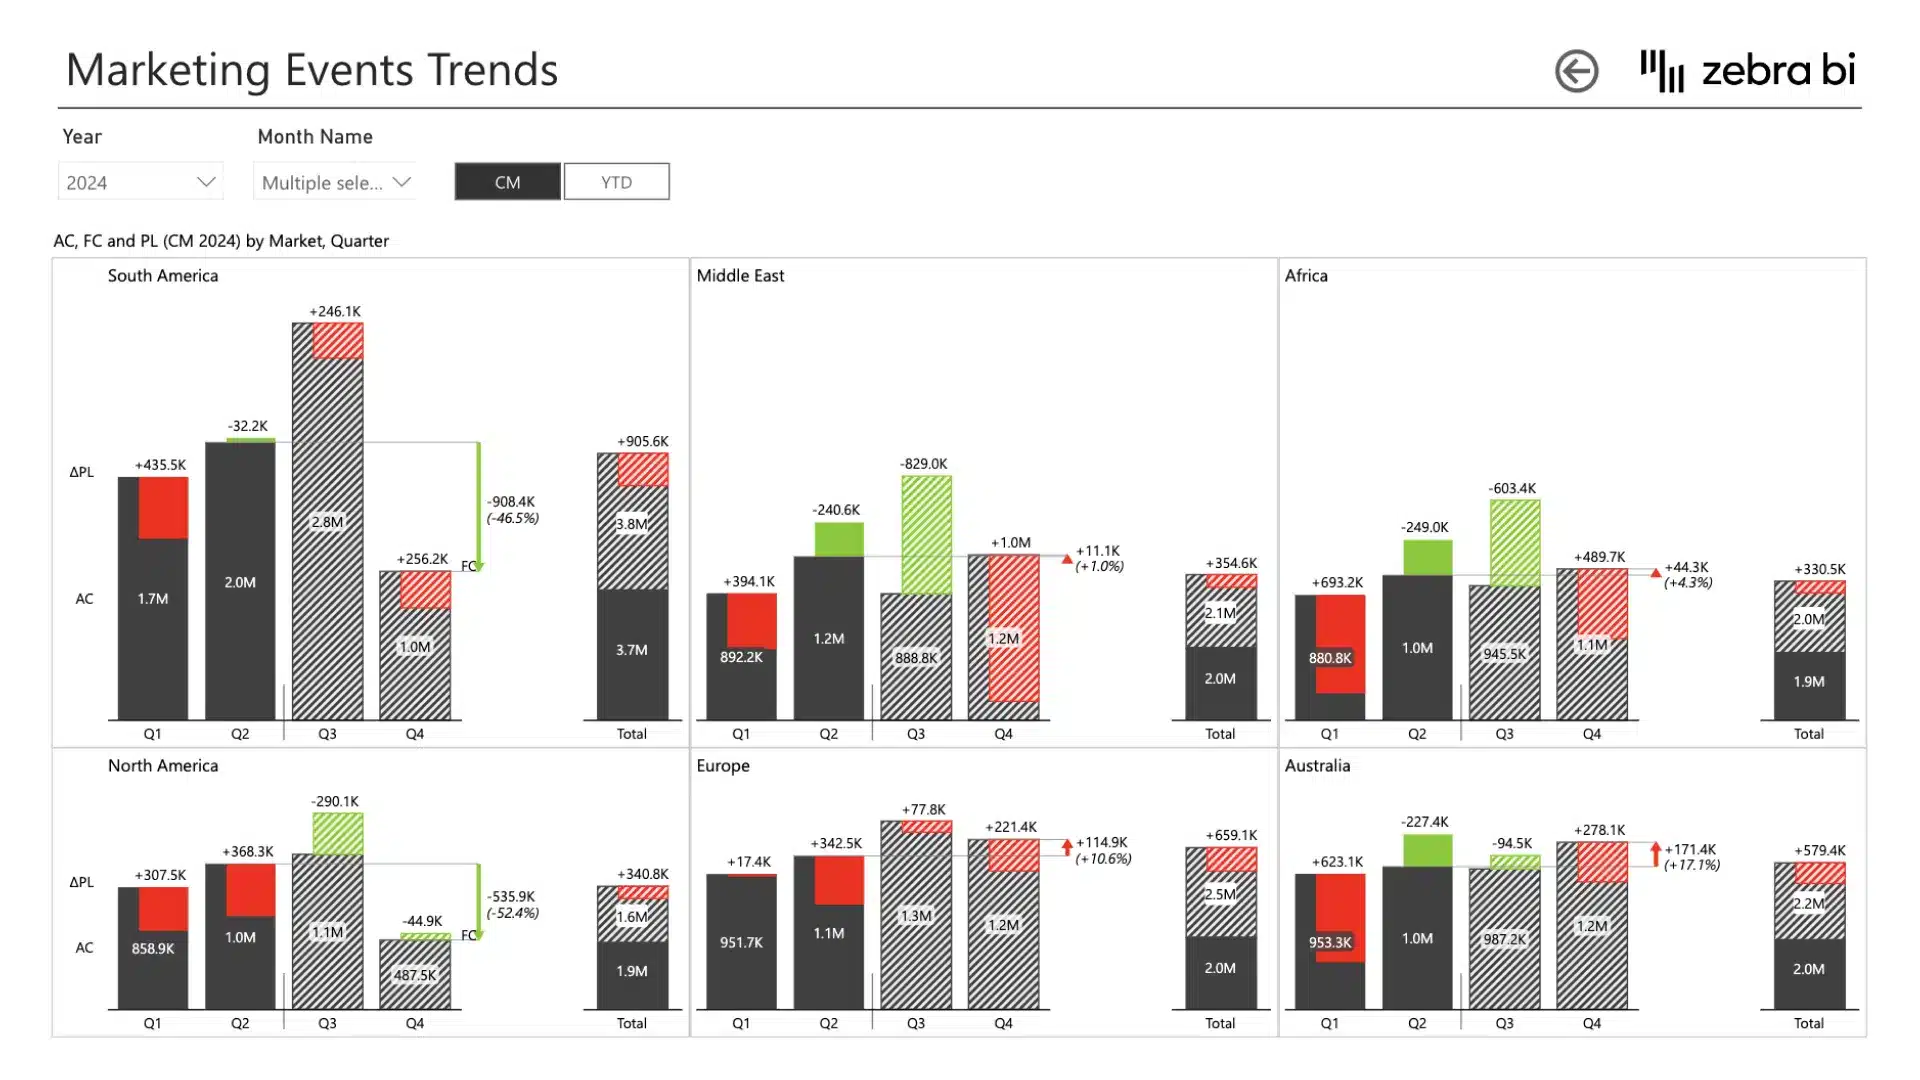
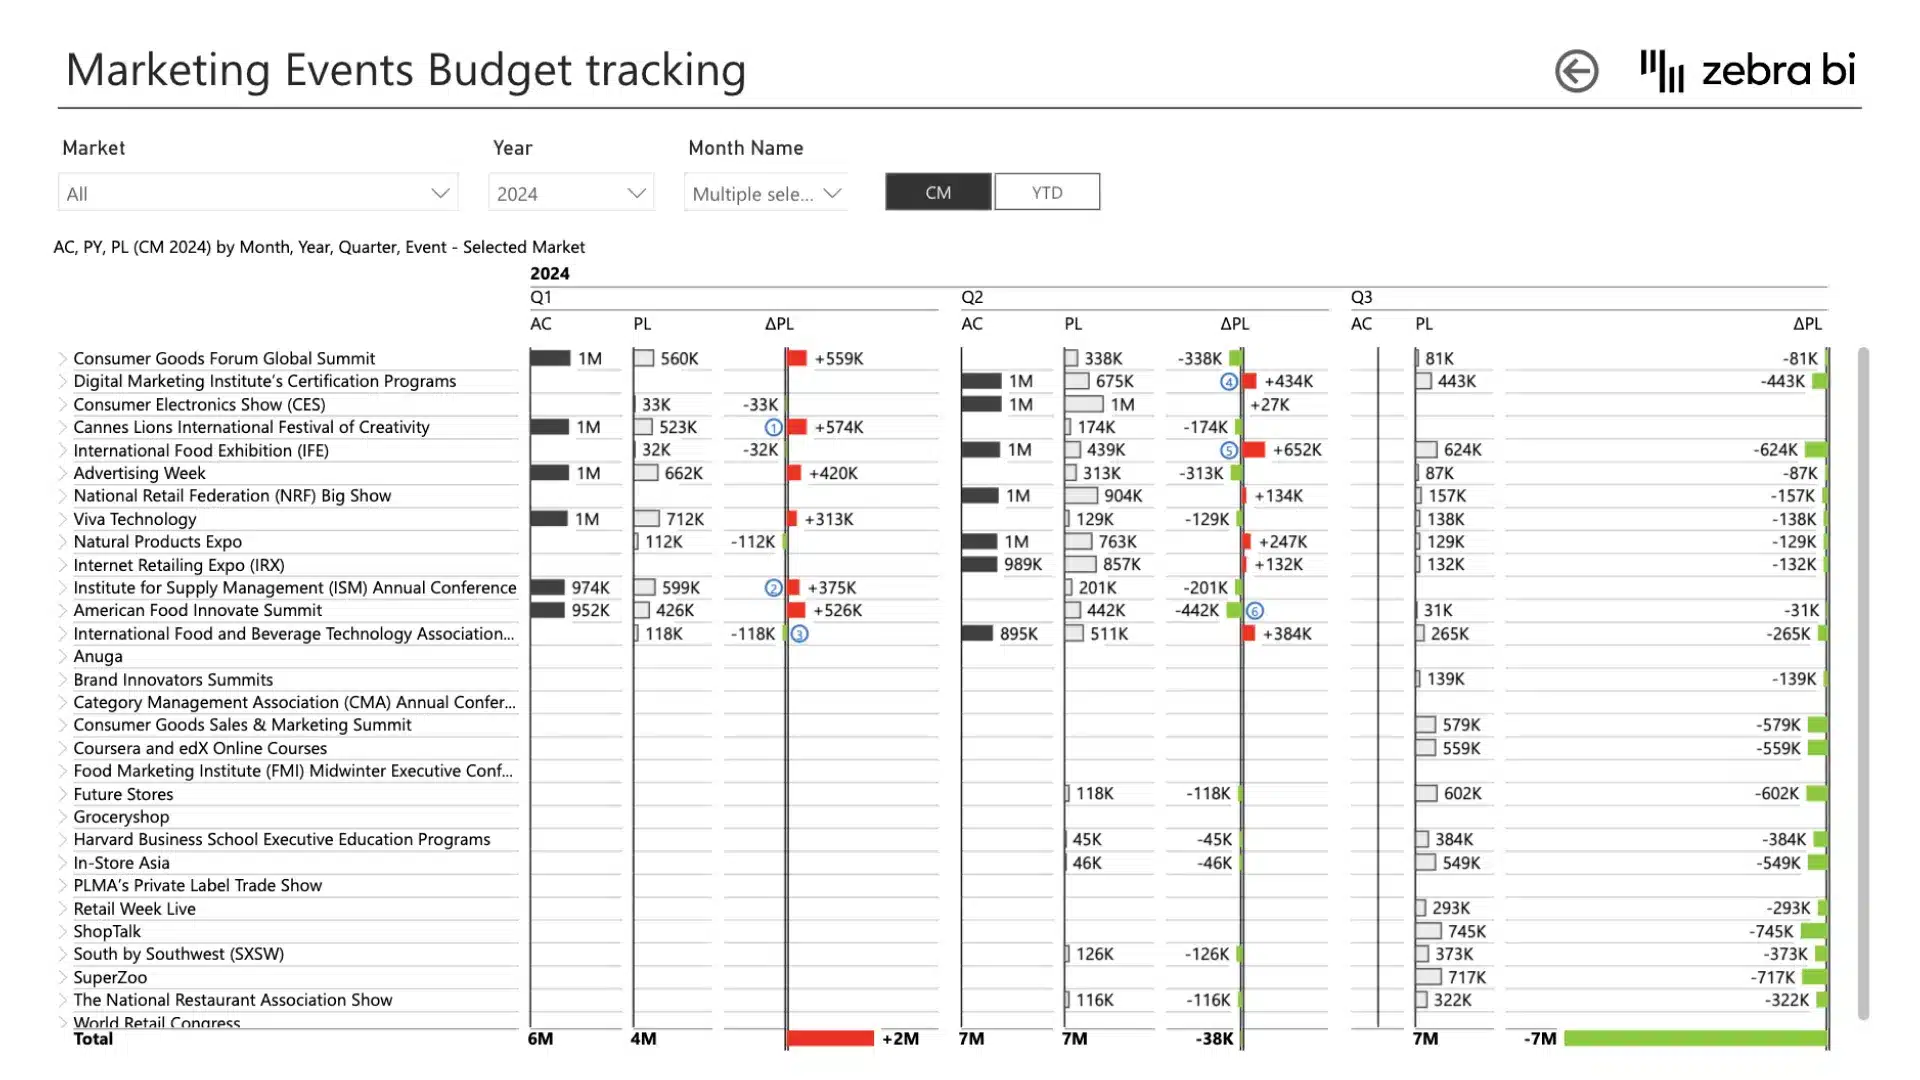
Marketing events, trends, and budget tracking
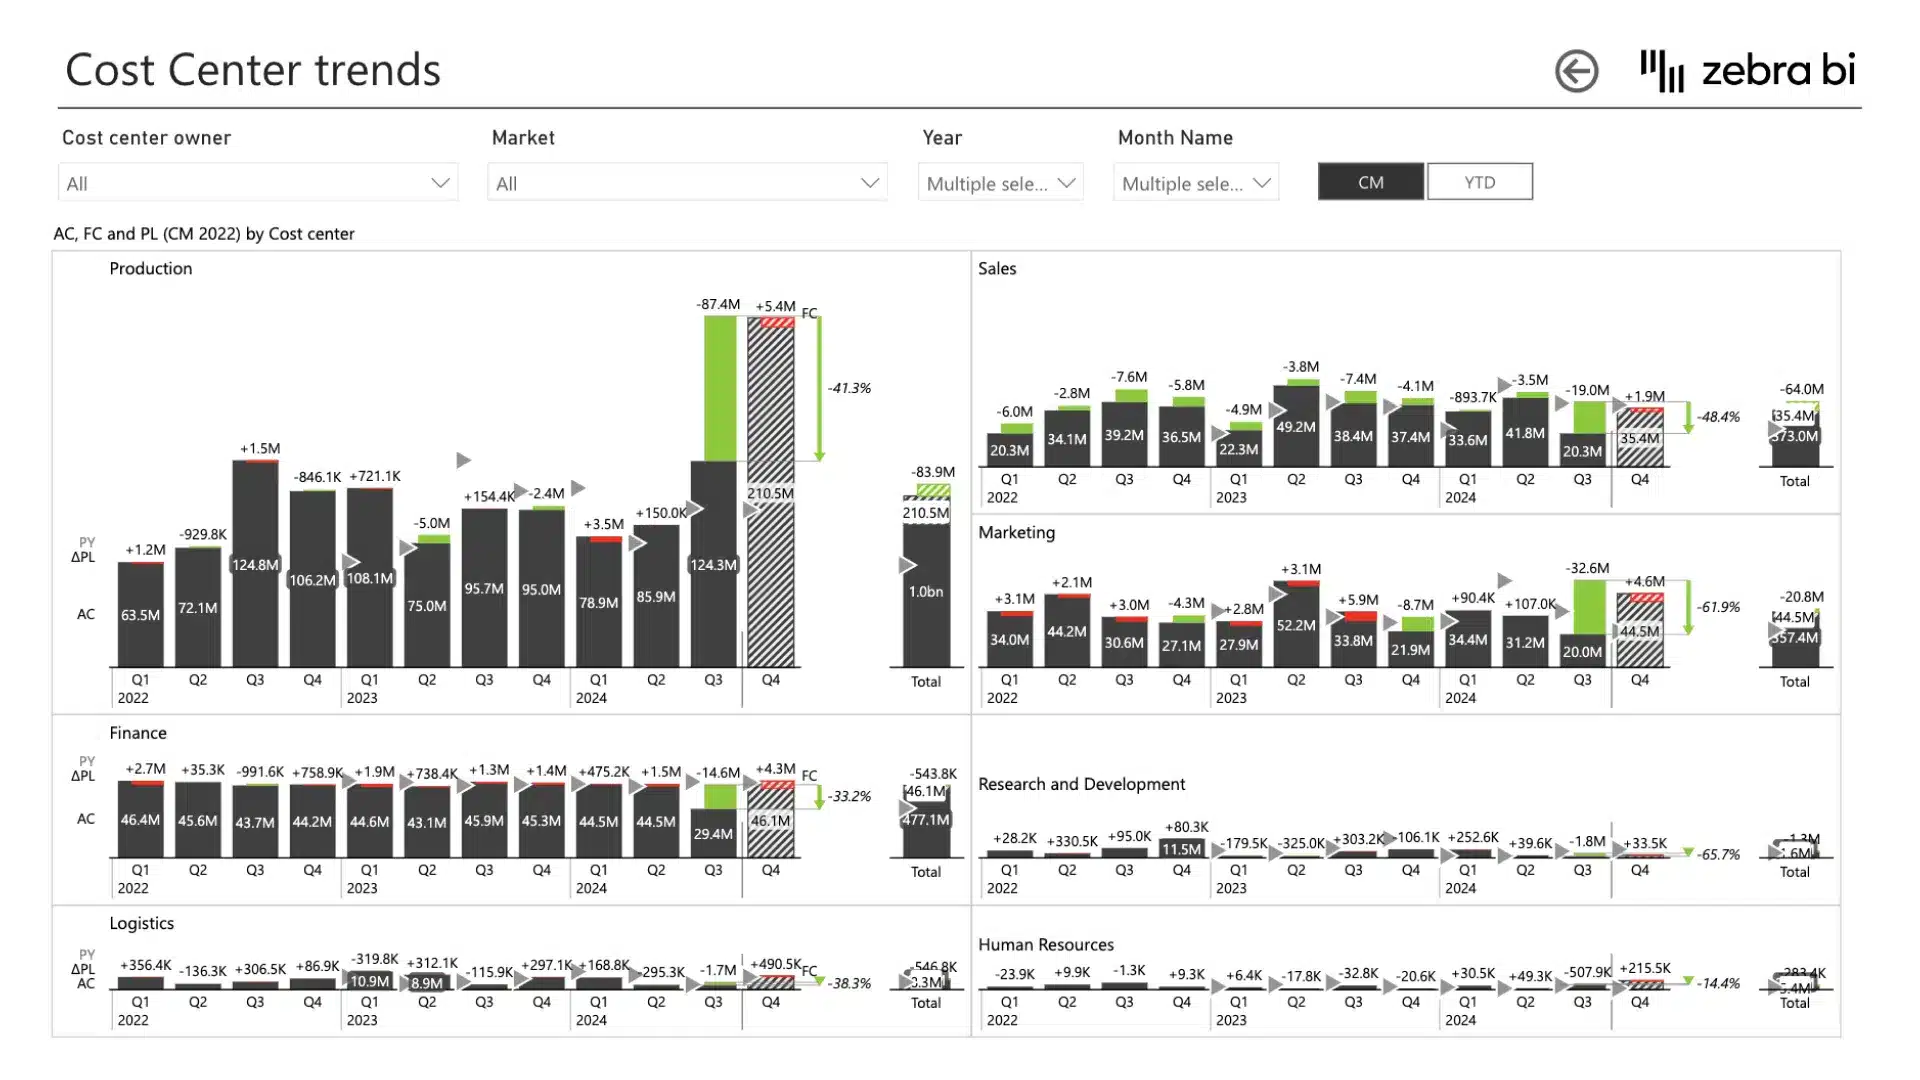
Cost center trends
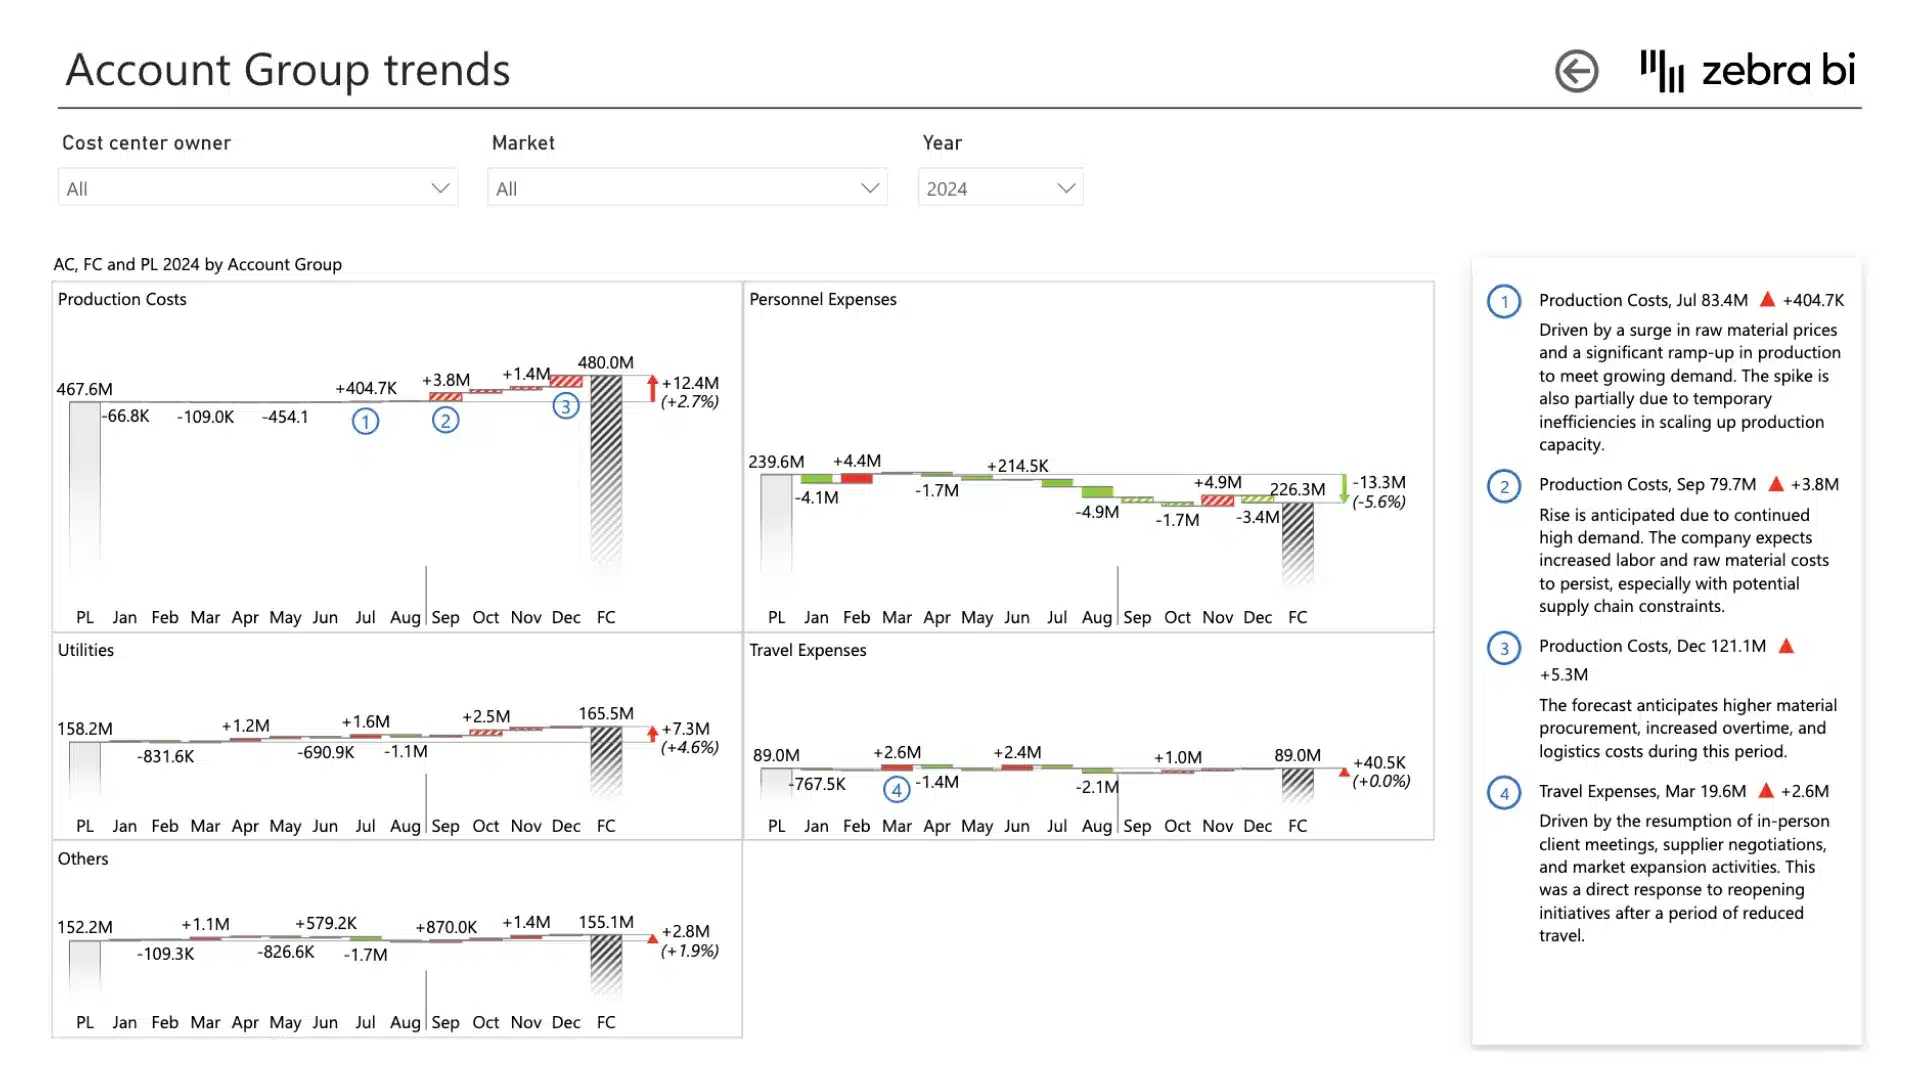
Account group trends
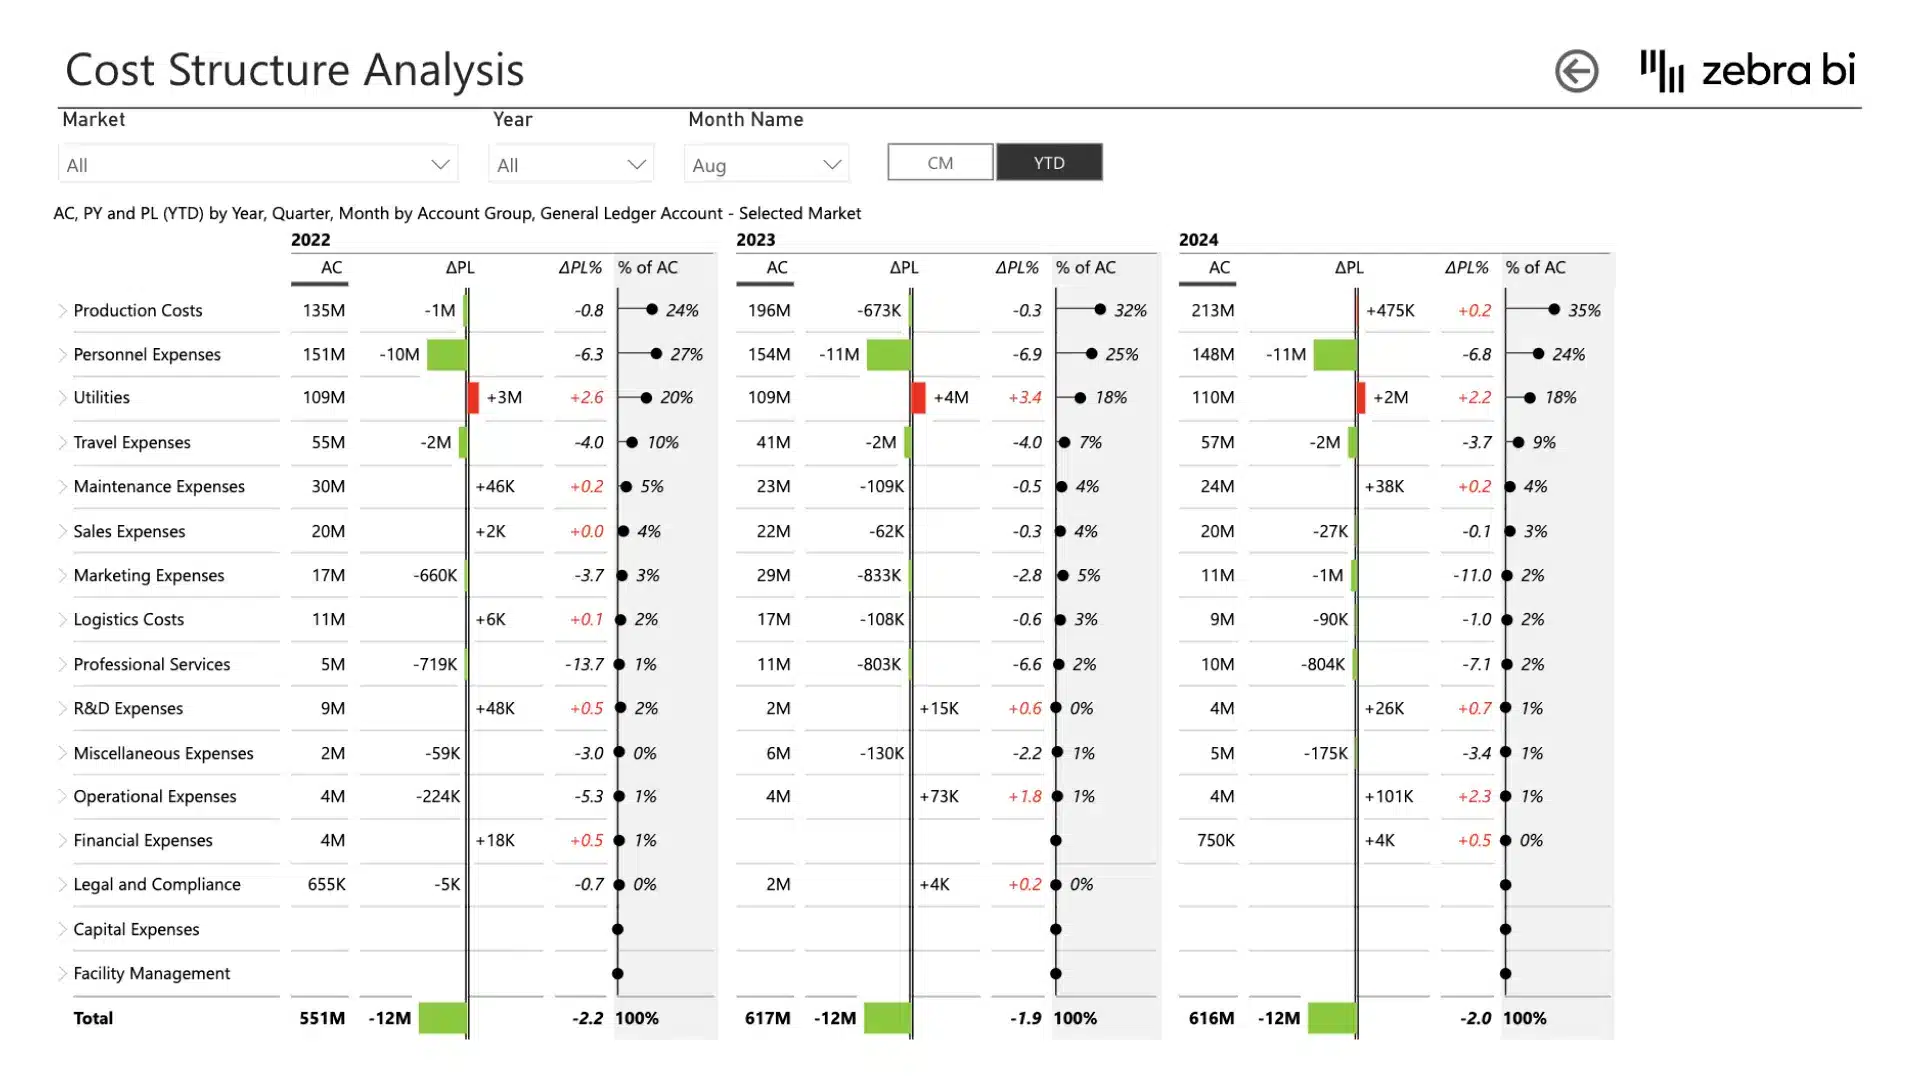
Cost structure analysis
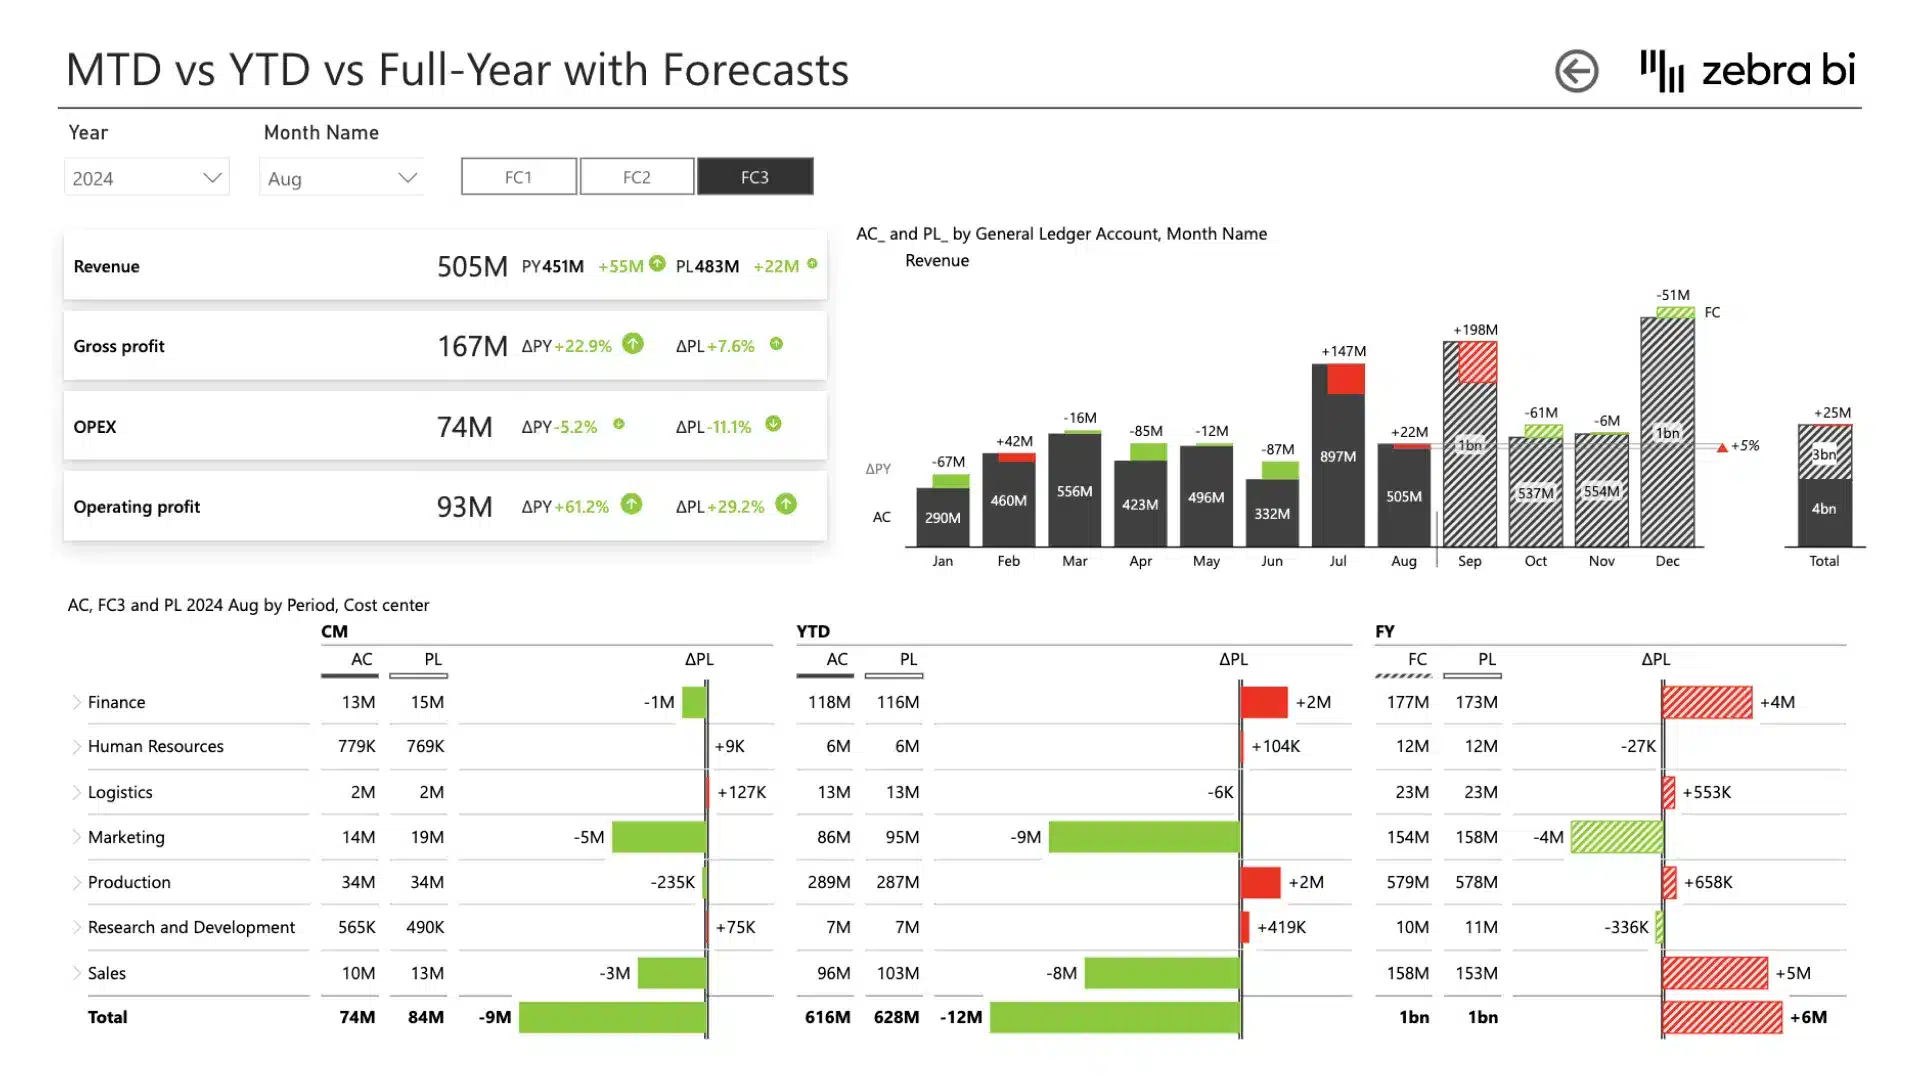
MTD vs. YTD vs. full-year, with forecasts
Operating margin trends
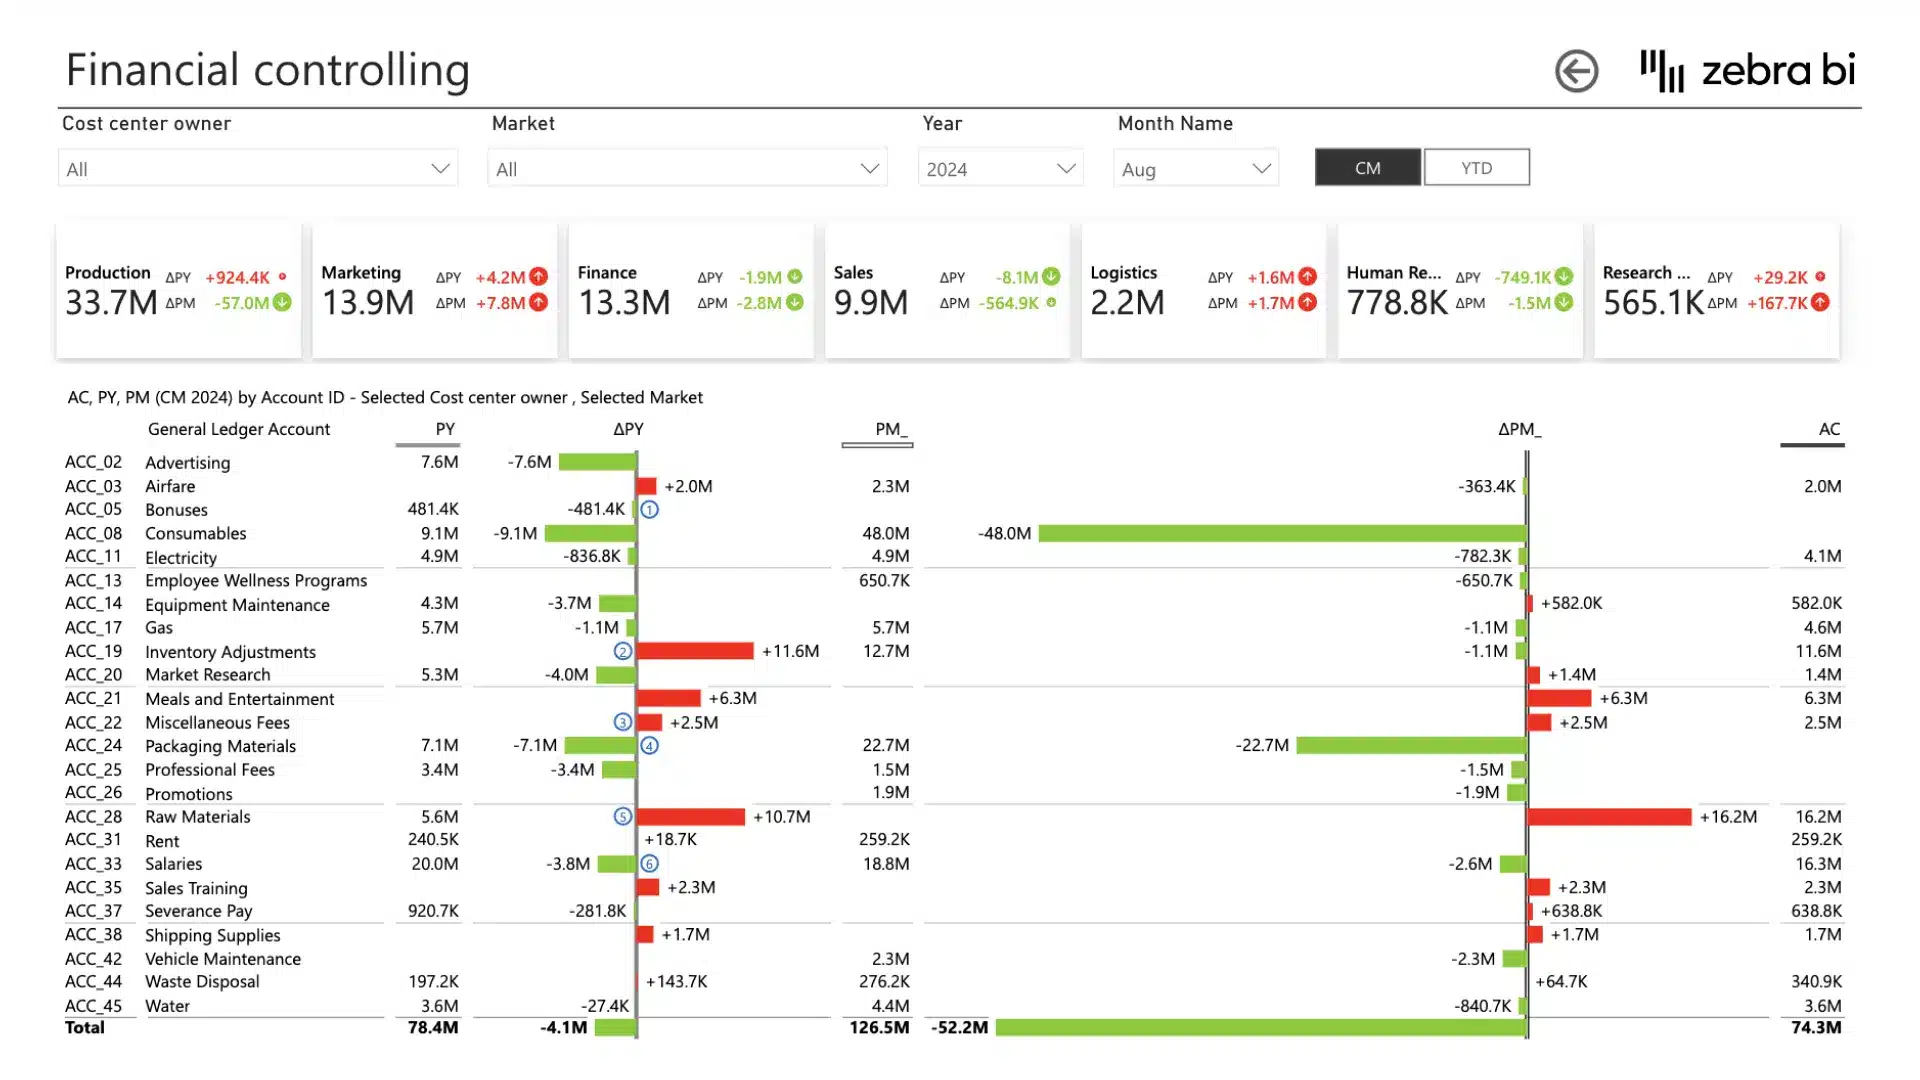
Financial controlling report
Automatically calculated variances
Dynamic titles
Dynamic column headers
Tooltip comments
Hide/unhide columns
Row calculations from the data model
Formula editor
Small multiples
Plus-minus chart type
Pin chart type
Combo chart
Dynamic comments with markers
Slicers
Multiple forecasting scenarios
See what’s impacting your costs
The Cost Management Power BI template helps you understand what your business is spending and why. It combines cost centers, vendor reporting, and OPEX forecasts into a single report your team relies on.
There’s no need to switch between separate reports, spreadsheets, and forecast files as this template puts together all of your key cost management data.
Spot cost overruns
This Zebra BI template puts together the entire story and shows you how spending is tracking against plan and forecast.
It helps you prepare for your next meeting with answers to:
- Which cost centers are running over plan, and how much?
- Which vendors are driving the biggest spend?
- Is OPEX tracking according to the forecast, or is it slipping out of range?
- Where is the operating margin gap coming from?
- Is this month’s variance a one-off or the start of a trend?
- Did anything post to the wrong cost center or account this month?
- If spending keeps trending like this, where does the full year land?
Close the month without chasing errors
Month-end close is where a few wrong postings turn into wrong numbers. The Cost Management template gives controllers one place to check that every cost landed where it should: the right cost center, the right account group, the right period, before the statements go out.
Use it as a month-end cheat sheet to:
- Catch postings that landed in the wrong cost center or GL account.
- Spot charges booked to obsolete or inactive accounts.
- Confirm special charges and allocations were split correctly.
- Flag the numbers that need explaining before they reach the CFO.
Because the template runs on Zebra BI's commenting, you can note a correction or explain a variance right on the number, so the reasoning travels with the report instead of living in a separate email.
See where the full year is heading
Reporting the past isn't enough when the budget conversation is about what happens next. The template compares your month-to-date and year-to-date numbers against a full-year forecast, so you can see whether you're on track to land on plan or drifting.
Model different OPEX assumptions and compare full-year estimates side by side:
- Best case, worst case, and most likely, so you're ready for each.
- See how a change in one cost driver moves the full-year outcome.
- Decide where to hold, cut, or reallocate budget before year-end, not after.
This turns forecasting from a once-a-year exercise into an ongoing check that keeps spending aligned with the plan.
Who is the cost management template built for?
- CFOs and finance leaders
Get an accurate view of where costs are running hot, with variance to plan and forecast built in. - Controllers & FP&A professionals
Track cost centers and vendors month over month, spot discrepancies early, and fold OPEX forecasts into the close process. - Business managers & department heads
Find out where your team’s budget is going without waiting for finance to pull the numbers for you.
Cost management insights this template provides:
Using this Power BI cost management dashboard, you can:
- Track cost centers and vendors against plan, prior year, and forecast.
- Check which vendors are driving the most spend.
- Compare MTD, YTD, and full-year numbers.
- See operating margin trends and where the gap is coming from.
- Break down OPEX by account group to find out where costs are shifting.
- Catch a discrepancy before it impacts next quarter’s forecast.
Cost management report: a page-by-page breakdown
This template ships as a multi-page Power BI report, each designed to answer a cost management question:
- Cost center report
Know where your budget is holding or slipping by monitoring spend against plan, cost center by cost center. - Cost center trends
Follow how each center is performing over time, so you don’t mistake a bad month for a bad quarter or the other way around. - Vendor report
Make sure the total invoice looks right by checking how each vendor is driving your spend. - Account group trends
Track spend by account group over time, so you know which categories are actually shifting and which are holding steady. -
Cost structure analysis
Break down what your total cost is actually made of, so "costs are up" turns into a specific answer. - OPEX report, with waterfall chart
Determine what drove OPEX up or down through a specific period, one contributing factor at a time. - OPEX overview
Get the full OPEX picture in one view, so you know where to look before diving into any single driver. - MTD vs YTD vs full year, with forecasts
Catch a drift early instead of at year-end, by comparing where you are month-to-date and year-to-date against where the full year is forecast to land.
- Operating margin trends
Watch operating margin move over time, so you catch it slipping before it shows up as a surprise in the numbers.
- Financial controlling report
Get the controller’s view before everyone else sees it: variance, discrepancies, and the numbers that need explaining before they reach the CFO. - Marketing events trends & budget tracking
Monitor spend and performance for marketing events so costs don’t get lost inside the OPEX total.
Built with Zebra BI visuals for Power BI
The Power BI Cost Management template is built using Zebra BI Tables, Charts, and Cards, so it helps you:
- Get automatic variance analysis (plan, prior year, forecast) with no custom DAX.
- See clear OPEX waterfalls showing what drove the numbers up and down.
- Track cost centers, vendors, and account groups in a single, consistent view.
- Compare MTD, YTD, and full-year numbers against the forecast without rebuilding the report.
- Trust transparent calculations for every driver.
- Add commentary and annotations to explain a variance before it turns into a problem.
Download the cost management template
The Cost management template tracks cost centers, vendors, and OPEX against plan and forecast in one place. This gives you a ready-to-use foundation you can adapt to your reporting without starting from a blank report every month.
Download the Cost management template, connect your data, and see where your budget is holding and where it’s slipping.
Get started in 3 steps
1
Download & Open
Download the .pbix file and open it in Power BI Desktop
2
Connect Your Data
Replace sample data with your CRM, ERP, or database source
3
Customize & Publish
Adjust KPIs, colors, and branding, then publish to Power BI Service
Fill out the form and get the Power BI template

20,000+ users have downloaded this template