Turn data into Actionable Insights with Zebra BI
Advanced visualization tool for Controllers and Analysts in the Food and Beverage Industry. Create standardized and consistent reports focused on delivering business insights according to reporting best practices.
Get your FREE guidePlay with the interactive demo below. If you click the ⤢ icon at the bottom-right of the report page you'll be able to enjoy the full-screen view.
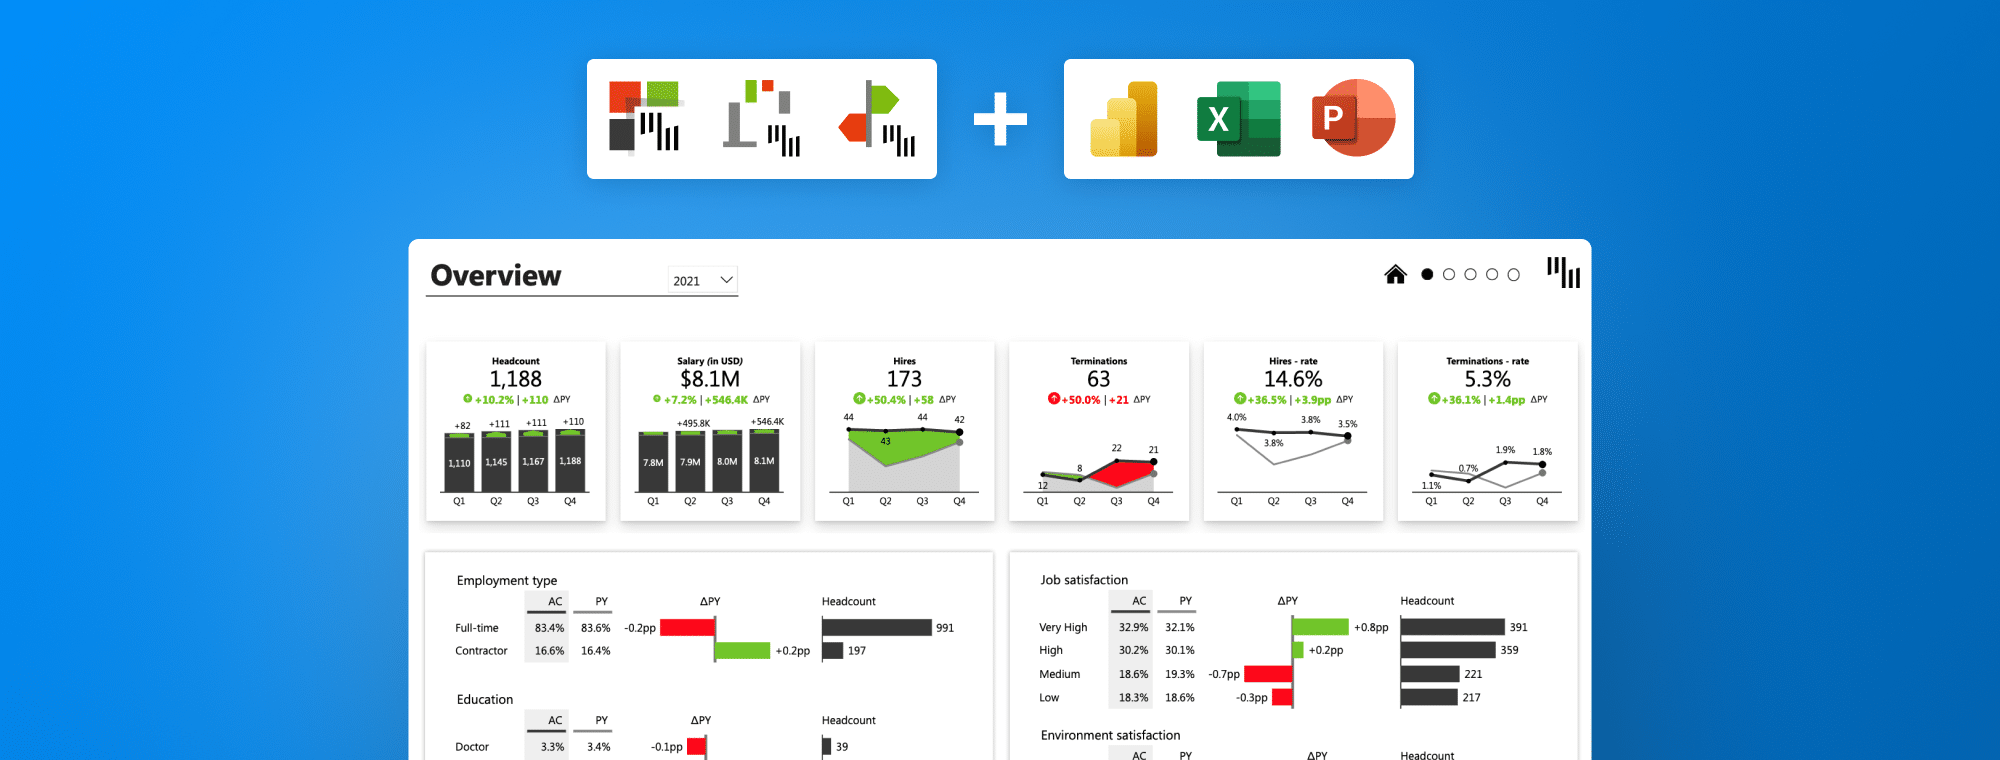
Advanced visuals in just a few clicks
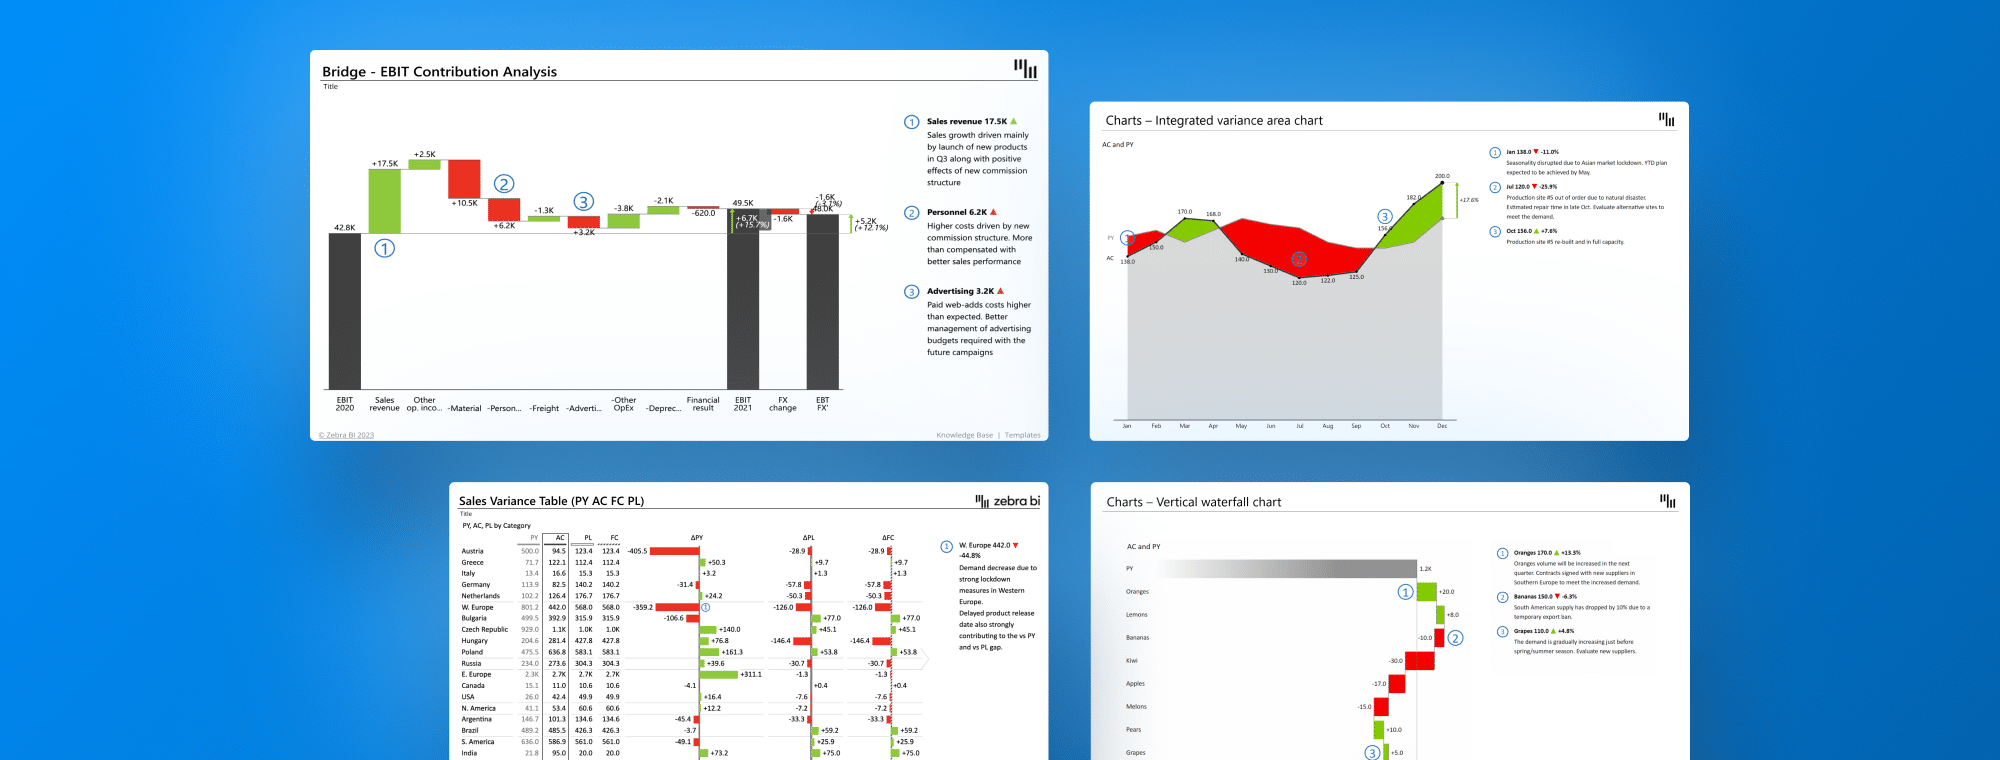
Reports with context and actionable insights
drive actions
ENGAGE YOUR TEAM
Spoken by report creators and understood by report viewers
Zebra BI with its advanced visuals and dynamic commentary brings a common language into your analytical practice. Spend less time in meetings clarifying data and more time leveraging these insights for real value.
Start FREE TrialResources for success
Templates designed for the food and beverage industry.
From sales dashboards to financial analysis, Zebra BI provides the tools you need to get started quickly and effectively.

Financial Analysis & Benchmarking Power BI Report Template (Food & Beverage Industry)
Get Your Free Template


SIMPLIFY YOUR REPORTING
Minimum DAX
Maximum business insights
From writing long complicated and time consuming DAX formulas into an analytical process with advanced visuals made in seconds.
Start FREE TrialJOIN INDUSTRY LEADERS
Trusted by the biggest players in the Industry
Join our community of food and beverage industry leaders who are scaling their business with the help of Zebra BI advanced features.


IMPROVE OPERATIONAL EFFICIENCY
Optimize your operations
Analyze production efficiency, inventory management, and supply chain performance with ease. Zebra BI provides the insights you need to streamline operations and reduce waste.

Make financial analysis and reporting faster and more efficient
and get a better overview of your finances and investments.

Optimize your operational efficiency
your company's main delivery and production processes.

Identify opportunities
by benchmarking your business against industry peers and tracking your performance.
GET INSTANT INSIGHTS
Calculate comparisons out-of-the-box
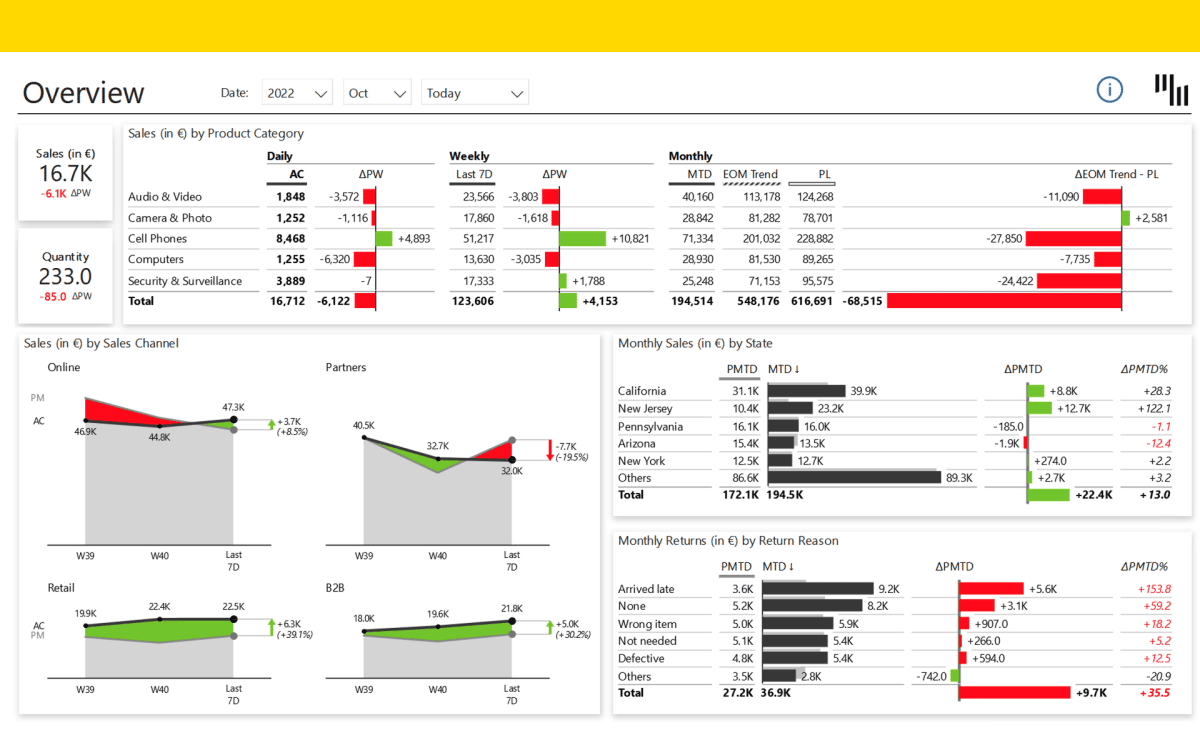
Zebra BI's automatic visuals calculating absolute and relative variances save you time spent on complicated DAX and immediately turn data into insights.
IMPRESS YOUR DECISION-MAKERS
Explain the WHY and propose ACTIONS on the fly
Empower decision-makers to quickly identify trends, understand outliers, and make informed decisions.
advanced visuals made simple
Effortless reporting with Key visuals
Easily create impactful, comprehensive reports that cover every aspect of your business analytics. No advanced BI knowledge or time commitment is required.
So amazing, even Microsoft uses it for internal reporting
Read Case Study

Verified customer
“This tool is unique. Most tools only show us WHAT happened. Zebra BI answers WHY it happened.”

Gabriel Medina
Analyst at GxSoft Argentina
Verified customer
“Our controllers now spend less time preparing comprehensive reports and more time analyzing data and crystallizing the message.”

Alejandro Meyer
Planning & Controlling Director at SanLucar Fruit
Verified customer
“This a highly professional product. Our company’s leadership (finance and operations) is already asking we roll this out to all our PBI financial reports.”

Joe Pawlowski
Innovation Manager - Business Intelligence, DHL
Widely accepted quality standards
IBCS Certified
With IBCS standards you make sure reports across your organization stay consistent and follow the same logic for easier understanding.
Power BI Certified

Zebra BI visuals for Power BI have been officially tested and certified by Microsoft ensuring they meet the highest data security standards.
Financial Times 100
Zebra BI ranked among Europe’s
Fastest Growing Companies
Fastest Growing Companies
4.9 user rating
Zebra BI has one of the best user ratings on Microsoft AppSource
Deloitte Fast 50
Zebra BI ranked on Deloitte Technology Fast 50 Central Europe
Start your 14-DAY FREE TRIAL
Test our tools on your data or contact us for custom packages and report assistance.