 September 8th
 February 22nd
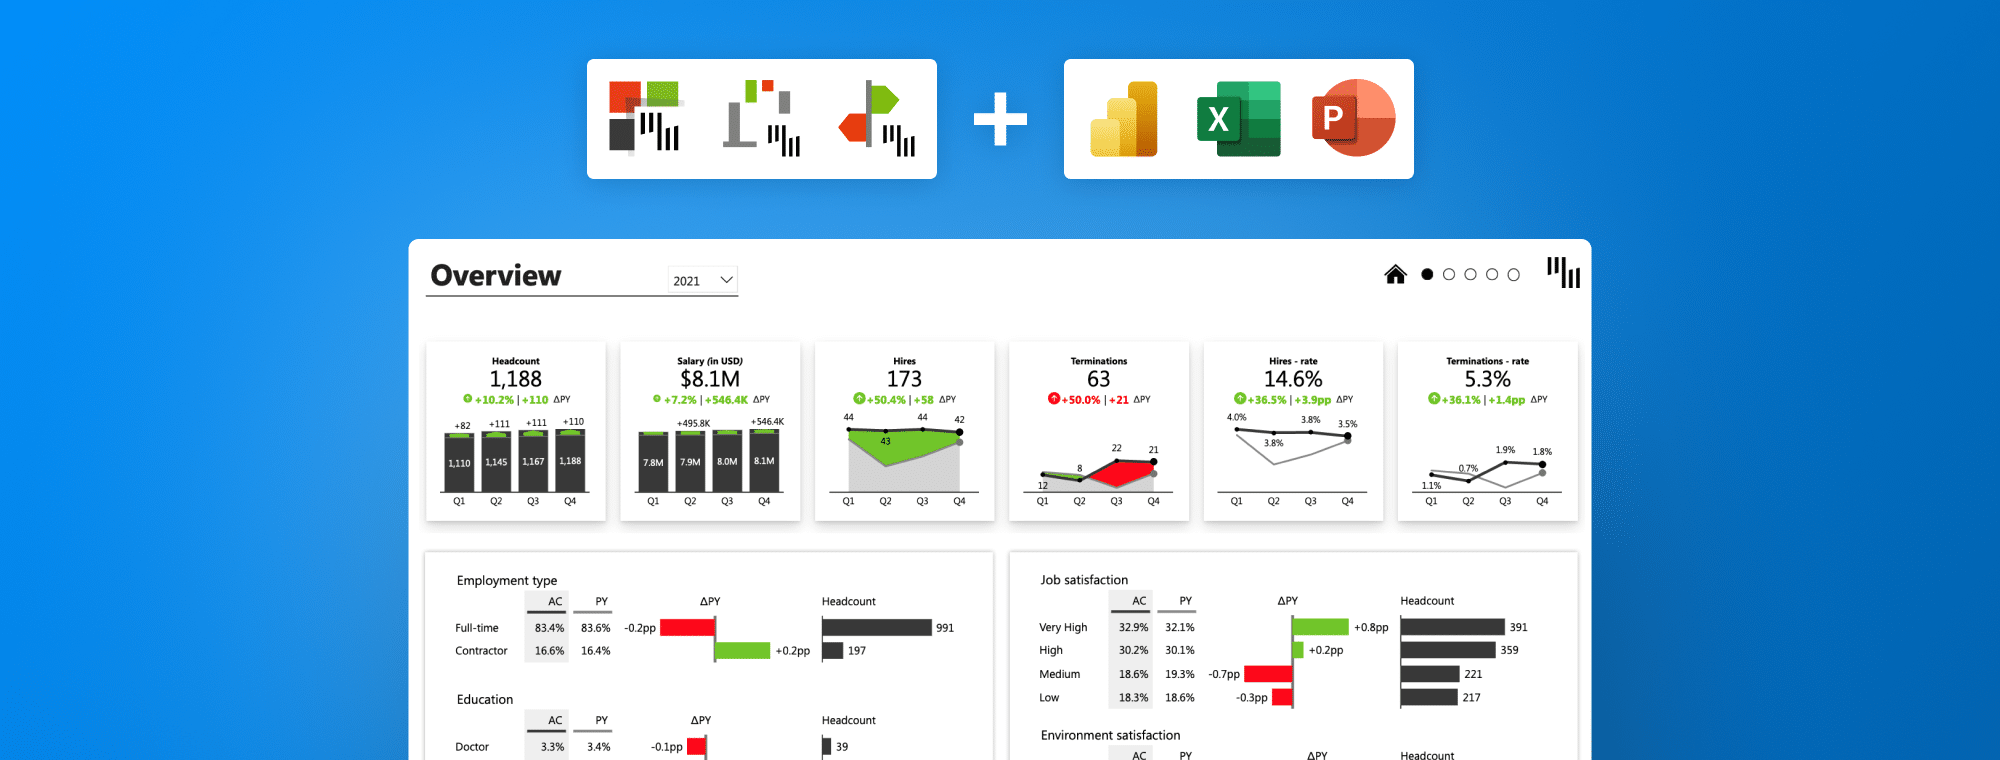
The Best BI Tools in 2025: Finding the Right Fit for Your Data Needs
PRO Trial
Understanding the 'why' behind your data's story is crucial to making better decisions and optimizing processes. The bridge between raw data and actionable insights lies in actionable reporting. This approach expands beyond traditional reporting methods by emphasizing data collection, analysis, interpretation, and–most importantly-action. The International Business Communication Standards (IBCS) further enrich this process by offering a comprehensive value proposition that includes a single source of truth, automation, standardization, flexibility, interaction, and engagement. Complex data must be transformed into clear, understandable insights that drive informed decisions.
Selecting the right business intelligence (BI) tool from a diverse set can be like choosing a screwdriver from your toolbox; each is designed for a specific task and caters to users of varying skill levels.
The most effective BI tools for actionable reporting align with your business needs. This enables you to extract, visualize, and act on your data efficiently. These tools serve distinct purposes, from improving performance analysis to simplifying financial reporting. No matter how small, every piece of data plays a vital role in business success. Understanding the capabilities and applications of these tools is the first step toward unlocking your data's full potential.
Power BI
Power BI stands at the forefront of BI tools, transforming data analysis and reporting. Here's how Power BI boosts your data:
Data Governance Matters
With all the data companies deal with every day, accuracy, security, and compliance are crucial. Power BI improves data governance through features like detailed data lineage tracking, comprehensive access controls, and precise data classification. These features ensure that data across the organization remains reliable and secure, laying a solid foundation for making critical business decisions.
A rethinking approach to data modeling
Data modeling is the backbone of practical data analysis and visualization. Power BI simplifies relationships between diverse data sources with an intuitive interface. In this way, complex data models can be crafted for deep analysis. With powerful DAX functions for complex calculations, Power BI is a a great choice for data modeling. Its roots in PowerPivot for Excel underscore its evolution into a tool with an unmatched data modeling environment.
Optimizing periodic and frequent reporting
Timely insights are the lifeblood of dynamic business environments. Power BI streamlines the creation of periodic and frequent reports through automation features that effortlessly refresh data from multiple sources. By creating dynamic dashboards and scheduling report distributions, stakeholders can receive accurate insights quickly.
Creating Interactive Dashboards for Real-Time Analysis
Monitoring key performance indicators in real time is a game-changer for businesses. Power BI offers extensive visualization tools and interactive features integrated with live data streams to provide immediate insights into critical metrics and trends. Advanced functionalities like drill-through, bookmarks, and tooltips empower users to build structured dashboards. These begin with overview pages and delve into detailed analyses, facilitating a deeper understanding of the data.
Fostering collaboration and sharing
Collaboration and secure insight sharing are essential in an interconnected work environment. Power BI excels in this domain by enabling report publication through the Power BI service. Here, team members can interact with shared data, collaborate on report development, and distribute insights securely throughout the organization. Additional features include sharing links, embedding reports into applications, and integrating with Microsoft Teams, enhancing seamless collaboration.
Excel
Excel's versatility and accessibility make it an essential BI tool for data analysis and business intelligence. Here's a closer look at how Excel serves as a pivotal tool for BI analysts and data enthusiasts:
Empowering Quick Calculations
Excel's effectiveness at facilitating rapid calculations is unparalleled, thanks to its vast array of built-in formulas, functions, and an intuitive interface. Users can perform mathematical operations, analyze data, and uncover insights efficiently. Features such as auto-fill and formula suggestions further amplify the speed and precision of these calculations. Pivot tables and filters are commonly leveraged for exploring data, making Excel a go-to for quick, insightful analyses.
Mastering Data Manipulation
Excel's robust set of functions, pivot tables, and sorting/filtering features make it a standout for data manipulation. This functionality allows users to efficiently organize, transform, and scrutinize large datasets within a familiar spreadsheet environment. Power Query, in particular, offers advanced data transformation capabilities for handling intricate data manipulation tasks, making Excel a powerhouse for data restructuring and analysis.
Enabling Ad-hoc Analytics
Excel shines in scenarios requiring ad-hoc analytics, offering remarkable flexibility for tasks such as planning, project management, feasibility studies, customer segmentation, and more. Its adaptability makes it ideal for analyses and projects where data needs rapid modification or recalculation with various inputs, such as scenario analysis and planning. Excel's capacity to manually adjust numbers on the fly addresses specific use cases, particularly in planning and scenario analysis, underscoring its utility in dynamic analytical contexts.
Optimized for Small Teams/Individual Use
With its affordability, accessibility, and widespread familiarity, Excel perfectly suits small teams and individual practitioners. It provides a comprehensive suite of data analysis, visualization, and reporting tools without specialized training or complex infrastructure. The software's inherent flexibility allows tailored solutions to meet unique project requirements, making it preferable for smaller-scale endeavors over more enterprise-oriented tools like Power BI.
Unmatched Flexibility
Excel's customizable features allow users to personalize worksheets, formulas, and visualizations to align with specific needs, accommodating evolving data scenarios. Due to its compatibility with various data sources and seamless integration with other Microsoft Office applications, it facilitates a variety of analytical and reporting workflows. Excel's reputation as the "king of hacks" for its capacity to handle last-minute adjustments, planning, forecasting alignments, and manual data updates further cements its status as a universal tool in the BI toolkit.
PowerPoint
In the BI and presentation toolkit, PowerPoint enhances communication through visual storytelling. Here's how PowerPoint can amplify your message:
Visual Presentations: Amplifying Verbal Narratives
Using PowerPoint's user-friendly interface, you can create visual presentations that complement verbal communication or serve as detailed handouts. Integrating text, images, charts, and multimedia elements enriches presentations, making complex ideas more accessible. Its capability to export slides as handouts or share presentations electronically extends the reach of your communication, ensuring your message persists beyond the live presentation.
Narrative Storytelling: Crafting Engaging Stories
A slide deck created using PowerPoint allows for the seamless integration of visual elements vital to presenting complex ideas or concepts in a structured, compelling manner. Slide transitions and animations enhance the storytelling experience, keeping the audience engaged and facilitating a deeper understanding of the presented narrative.
Pitch Decks: Capturing Attention and Interest
PowerPoint is particularly suited to creating pitch decks thanks to its straightforward interface, customizable slide layouts, and multimedia support. This makes it an invaluable resource for entrepreneurs and business professionals looking to present their ideas, products, or services compellingly to potential investors or clients. While exporting to PDF format offers compatibility and professionalism, it's worth noting that this may reduce interactivity and, potentially, audience engagement.
Executive Summaries: Conveying Critical Insights
PowerPoint offers tools for crafting executive summaries. Concise slide layouts, clear visuals, and the ability to emphasize key points allow presenters to impact executives and decision-makers significantly. Integration with other Microsoft Office applications enhances this capability, including pertinent data from spreadsheets or documents to bolster the summary.
High-level Overviews and Strategic Presentations
PowerPoint aids in delivering high-level overviews and strategic presentations, providing customizable templates and clear visualizations that structure information logically. This structure is crucial for sparking productive discussions and guiding strategic decision-making among stakeholders. Features such as presenter notes and slide transitions are invaluable, helping to maintain focus and engagement throughout strategic discussions. Presenting only the key messages through PowerPoint slides often facilitates a more digestible format for audiences than complex dashboards. This might be overwhelming for some meetings.
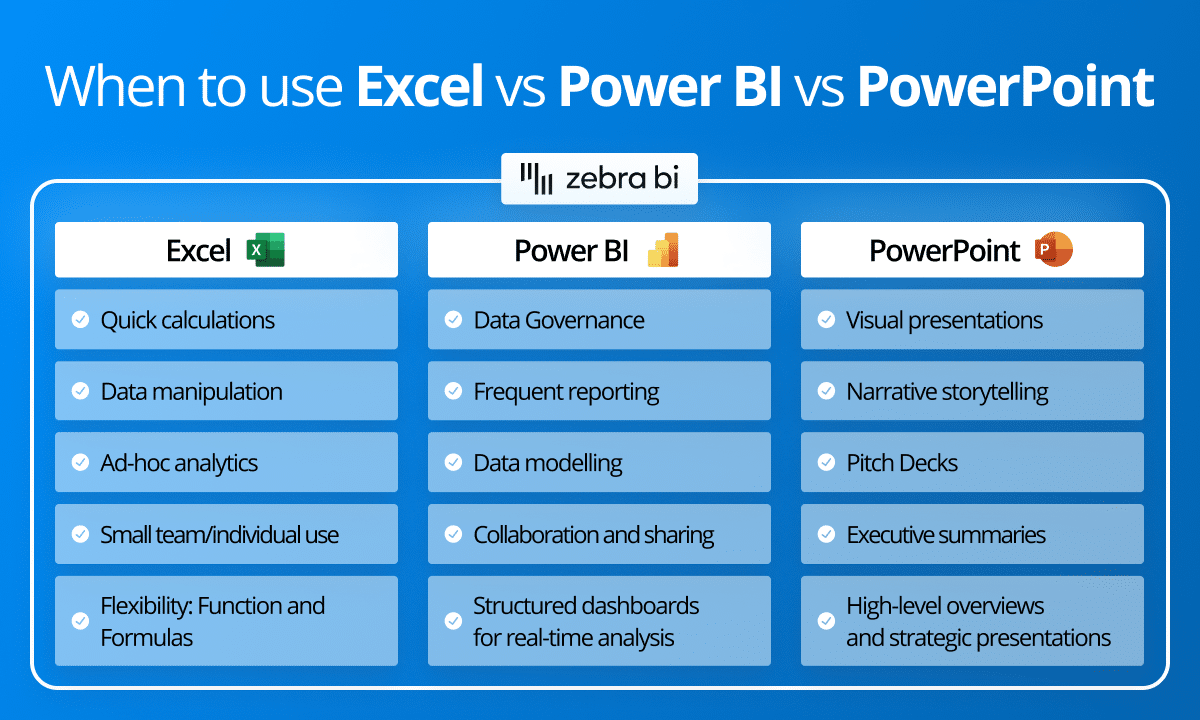
Which BI Tool To Choose?
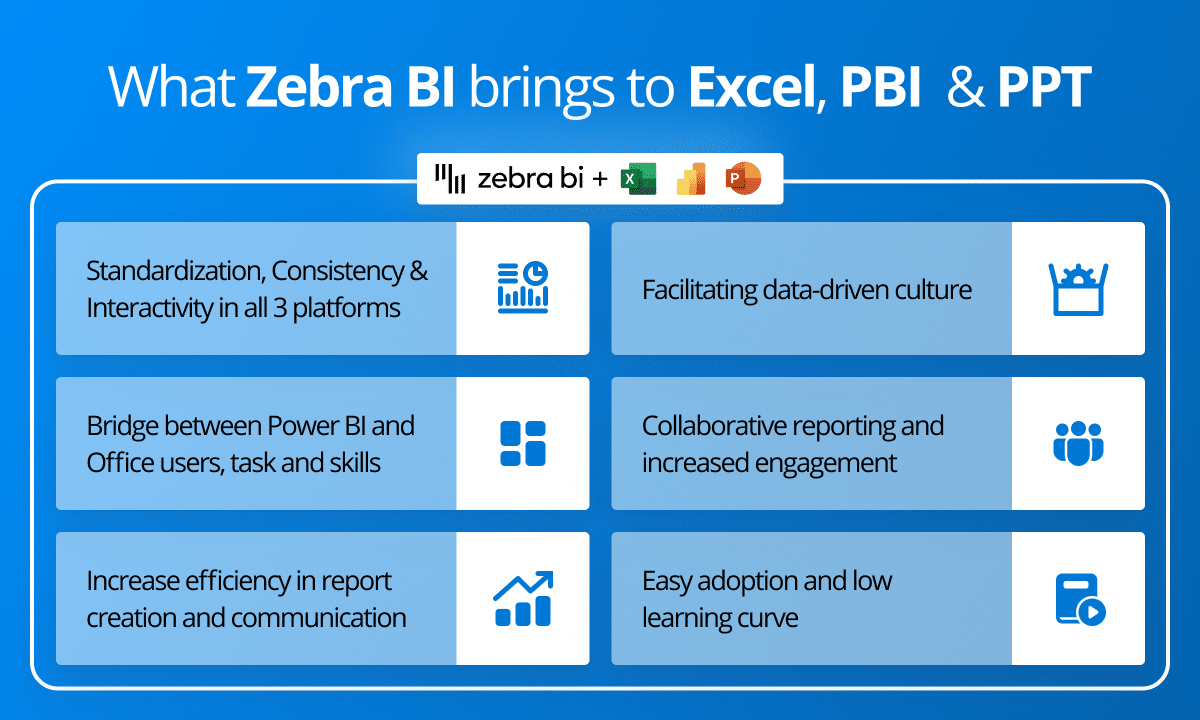
Why should you complement PBI with Excel and PowerPoint and not replace one with another? It shouldn't be one or another. Using a combination of the three allows:
1+1=3: Synergy Between Tools
Using Power BI, Excel, and PowerPoint together offers superior value than the sum of their parts. It is not just a theory; it's a practical approach to modern business analytics.
Each platform shines in its unique capacity, catering to diverse skill sets and use cases within an organization. Although Power BI offers a user-friendly interface for data governance, modeling, and sharing, pivotal for actionable reporting, business analytics often require Excel's flexibility.
Although reporting might eventually migrate entirely to Power BI, organizational needs suggest otherwise. There are always scenarios and user requirements that demand specific features from Excel and PowerPoint. This doesn't imply a setback in adopting Power BI; instead, it encourages complementary usage of these tools, enhancing reporting and analysis capabilities across the organization.
By embracing each tool's strengths, companies can facilitate a more holistic adoption of actionable reporting, maximizing everyone's benefits.
Easy Adoption and a Short Learning Curve
The journey to modern reporting doesn't have to be daunting. The transition becomes much smoother when individuals use updated reporting methods within familiar tools. Power BI report creators, for instance, might start their design process in Excel, creating mock-ups of reports before diving into Power BI's more complex functionalities. This approach leverages Excel familiarity to ease users into Power BI's advanced reporting capabilities.
Employing Zebra BI as a bridge between Power BI and Office applications further harmonizes this transition, thanks to its consistent look and feel. This strategy eases adoption and shortens the learning curve, making the shift towards more sophisticated reporting tools seamless for users of varying skill levels.
Promoting a Data-Driven Culture
Adopting a data-driven culture within an organization means more than just collecting data; it's about turning data into insights and actions. By carefully considering an organization's needs and equipping teams with the appropriate tools, you pave the way for insights to be effectively visualized and communicated. Power BI, Excel, and PowerPoint each play a unique role in this ecosystem, catering to different aspects of the reporting and analysis process. This approach democratizes data access but also emphasizes data-driven decision-making.
When data is made accessible and understandable, it empowers every team member to contribute to a culture where decisions are made based on insights derived from solid data, thereby enhancing the organization's overall strategic direction and operational efficiency.
Single Source of Truth
Establishing a single source of truth within an organization is paramount to data accuracy and integrity. Power BI excels at creating a supportive environment for data governance and modeling. It is often recognized for its advanced capabilities over traditional Office products. However, large organizations face challenges with multiple "versions of truth" or scenarios where data is pulled directly from ERPs or data warehouses, leading to discrepancies and potential manipulation.
Integrating Power BI with Excel addresses these challenges head-on. Modern Excel capabilities allow users to connect directly to Power BI data sources, enabling analyses and presentations that are consistent and reliable while still leveraging Excel and PowerPoint for their flexibility and presentation strengths. This connection ensures that every study, regardless of the tool used, is based on accurate and up-to-date information, eliminating the "garbage in, garbage out" problem and fostering confidence across the organization's data.
Automatization, Standardization & Consistency for Increased Efficiency
Automatization and standardization are key to boosting organizational efficiency, allowing team members to focus more on their core responsibilities than repetitive data management tasks. Integrating Power BI, Excel, and PowerPoint plays a crucial role here. Modern Excel, for example, eliminates the need for multiple exports by enabling direct connections to Power BI data sources. It also embeds Power BI reports in PowerPoint presentations. This approach streamlines workflows and ensures everyone has access to the data they need in a format ready for analysis or presentation.
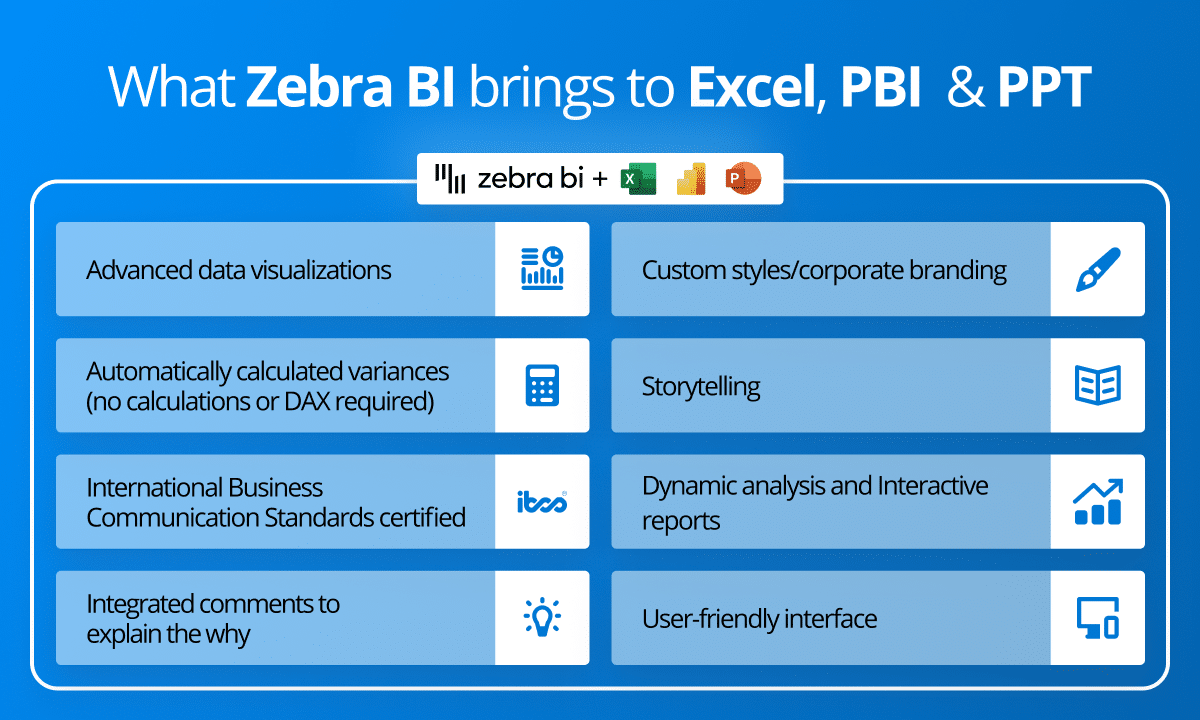
However, the challenge doesn't stop at automation. The varied design preferences across an organization can lead to inconsistencies in report presentation, diluting communication and data comprehension. By employing a unified set of BI tools and adhering to corporate branding and IBCS standards, organizations can ensure consistent reports that are immediately understandable. Zebra BI's presence on all three platforms further enhances this by automatically calculating variances and highlighting differences, ensuring that reports are standardized but also intuitive and insightful. This unified report creation and presentation approach significantly enhances organizational communication and decision-making efficiency and effectiveness.
Collaborative Reporting and Increased Engagement with Interactive Visuals
The transition from static reports to a more dynamic, interactive reporting framework addresses several challenges, including the inefficiency of manual adjustments and lack of collaboration. Static reports and the tedious process of copying and pasting data into PowerPoint often result in numerous report versions, complicating adjustments and updates. By leveraging a combination of Power BI, Excel, and PowerPoint, organizations enable a more collaborative approach to reporting, where individuals with different skill sets and requirements can work together seamlessly.
Cross-platform experience, characterized by a consistent look and feel across Power BI, Excel, and PowerPoint, simplifies report preparation and interpretation. This consistency, augmented by custom styles available across all platforms, ensures that each report element serves a purpose, contributing to the narrative and eliminating unnecessary "just because" elements. Through interactive and flexible features like comments, formulas, hierarchies, and cross-visual filtering, insight is delivered in a more engaging and actionable manner during analysis and communication. This not only aids in reporting but also enhances data exploration, ensuring insights are both comprehensive and accessible.
Through the intelligent use of BI tools, organizations foster a collaborative environment where reporting is not just about presenting data but engaging with it, thereby driving a more informed and interactive dialogue around business insights.
Use Case: Planning/Forecasting
The Old Way:
Traditionally, both planning and forecasting involve several bulky steps, starting with Power BI for initial data analysis. This is followed by exporting reference data to Excel for financial modeling. Once the Excel model is tweaked and the results are visualized, they are copied into PowerPoint for presentation purposes. Finalizing the plan might mean importing agreed-upon values into Power BI to track performance against forecasts. This process, while functional, is fraught with error potential at every manual step—from exporting and copying/pasting to the final import. Quality inputs may suffer, disrupting automation flow and preventing easy refreshes. Since forecasting is an iterative process with frequent updates, this method can become inefficient and unreliable.
A Modern Approach:
Contemporary approaches streamline this process significantly. It starts with Power BI, using verified organizational reports as a foundation for planning. This ensures financial models and assumptions are grounded in the latest, most accurate data. The heavy lifting, particularly detailed financial modeling, is then conducted in Excel, which remains a robust tool. By connecting Excel directly to the Power BI dataset, users can build their models and visualize outcomes within the same ecosystem, maintaining data integrity and facilitating immediate insight into the implications of various scenarios.
When it comes time to communicate these plans, PowerPoint is the platform for clear, concise presentations. Linking the results of your financial models directly to PowerPoint ensures that presentations are always current, with the ability to refresh and update with just a click. This flexibility is invaluable, especially when multiple iterations are likely. Embedding Power BI reports into PowerPoint presentations further enriches this process, providing stakeholders with a comprehensive view of the starting points and updates.
Zebra BI's custom visuals for Power BI and add-ins for Excel and PowerPoint ensure tables and charts maintain a consistent appearance, reinforcing standardization and consistency. This coherence is crucial for effective communication and understanding, especially when explaining the planning process or adjusting inputs. Comments and annotations add another layer of clarity, making it easier for planners and decision-makers to visualize and understand the effects of various planning scenarios.
This modern workflow saves time, reduces error risk, and enhances collaboration and strategic alignment within the organization. It ensures that planning and forecasting are integrated and agile processes that adapt to changing business needs.