Financial Analysis & Benchmarking Power BI Report Template (Food & Beverage Industry)

Zebra BI for Power BI

Overview
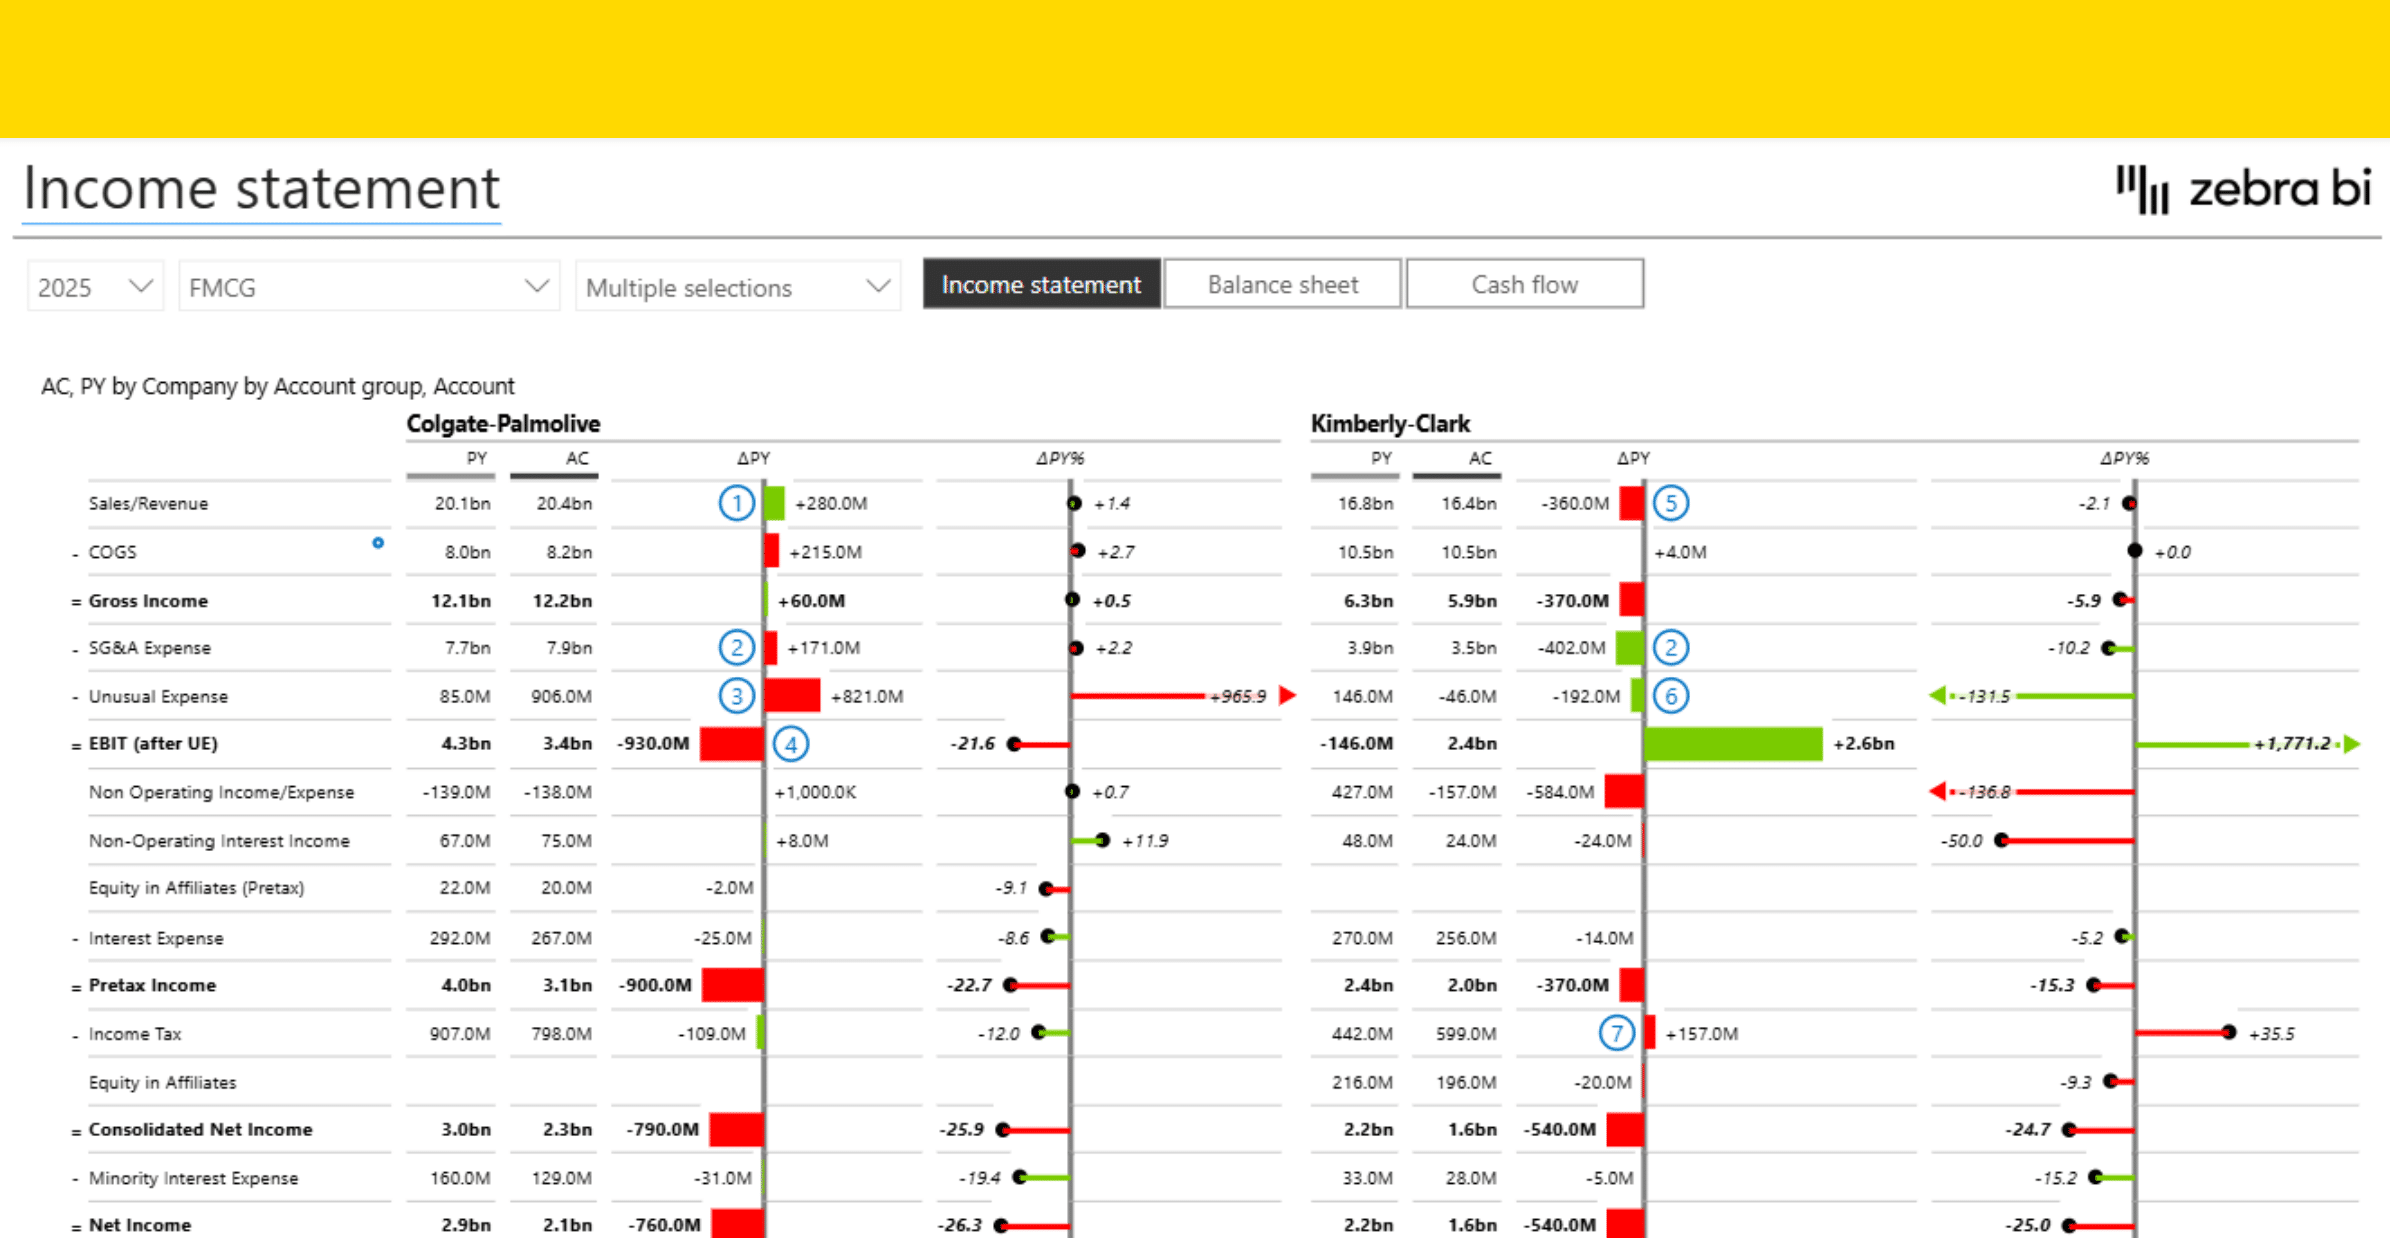
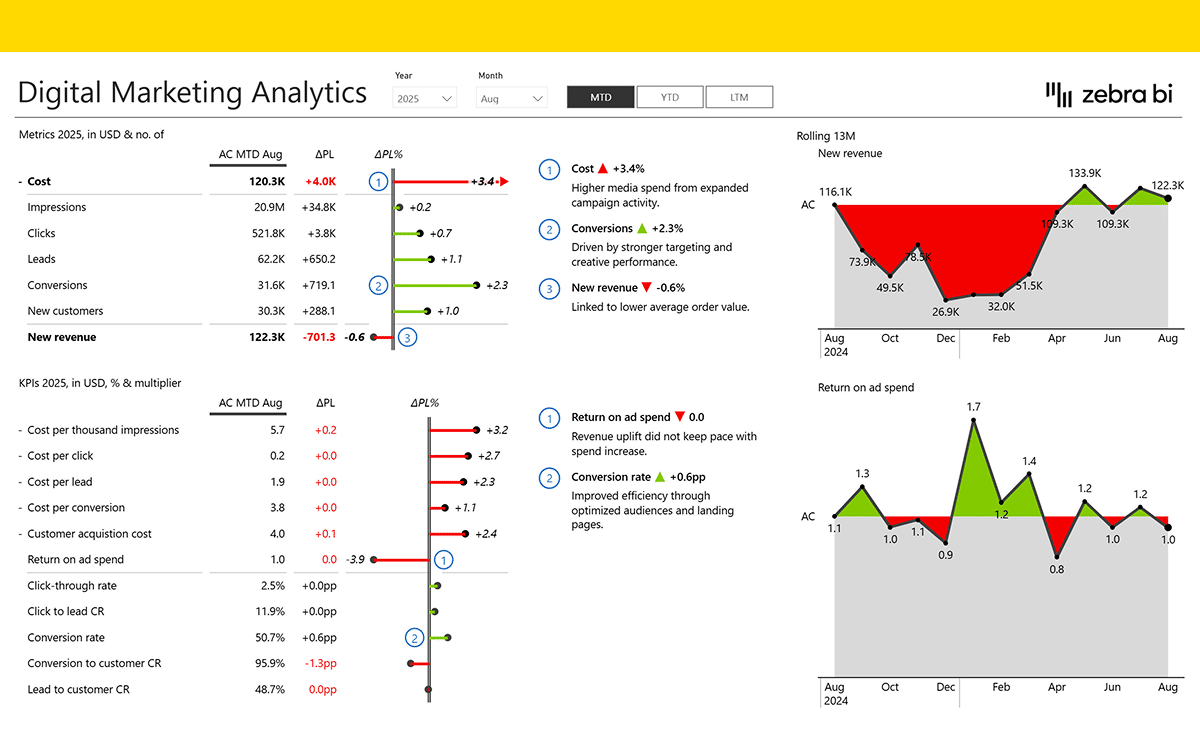
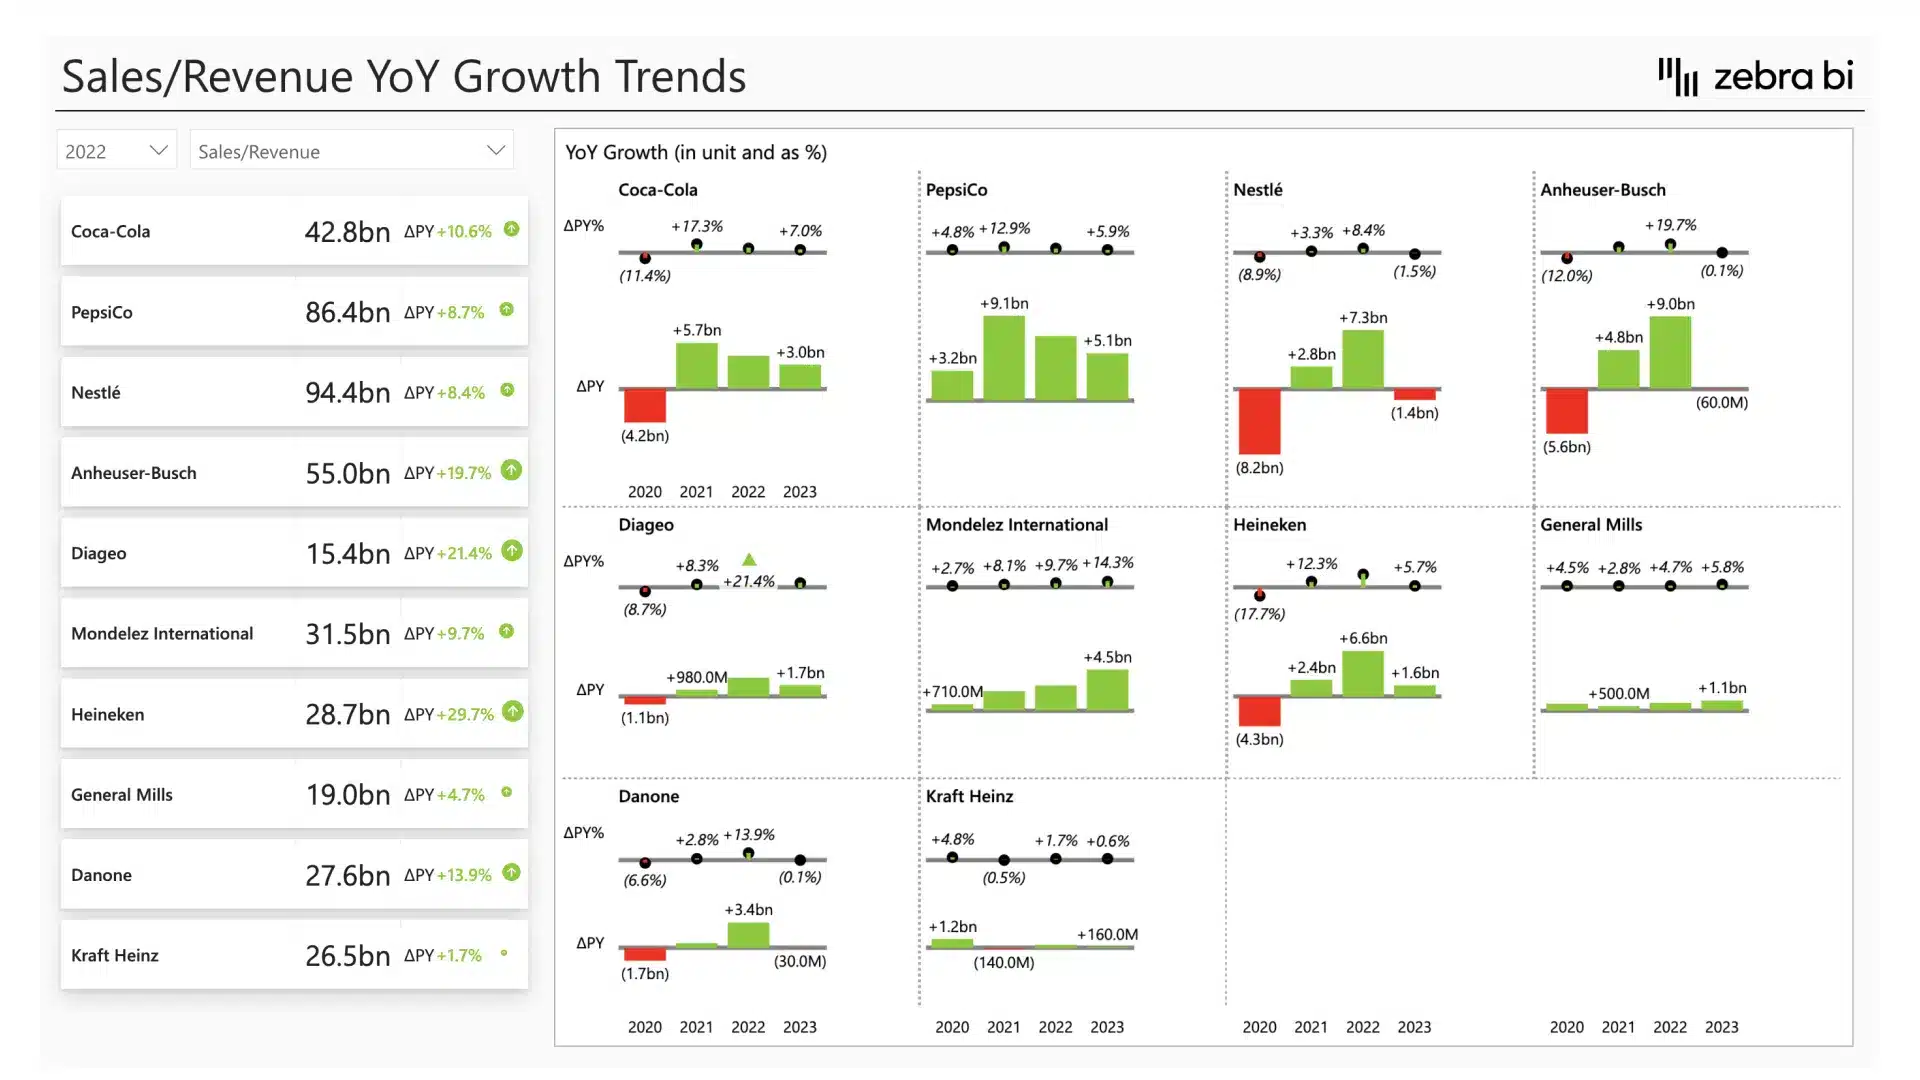
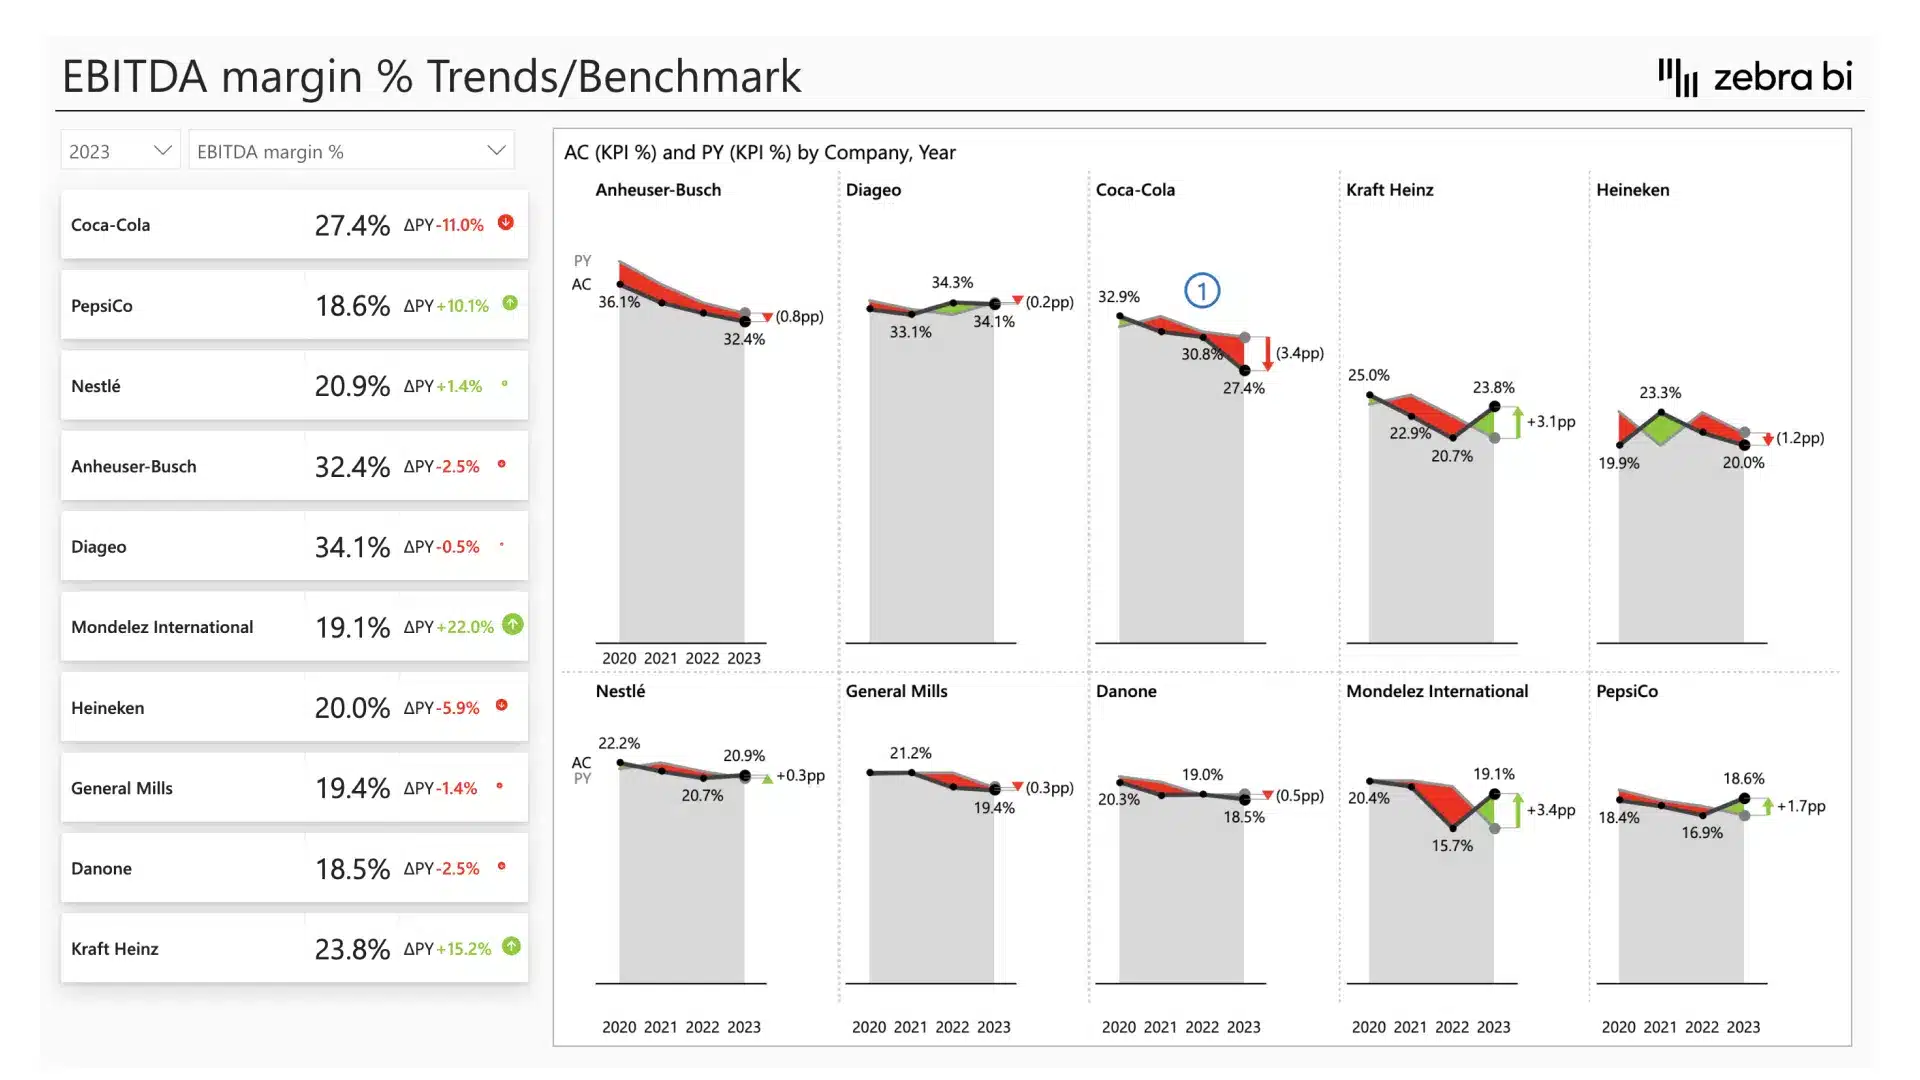
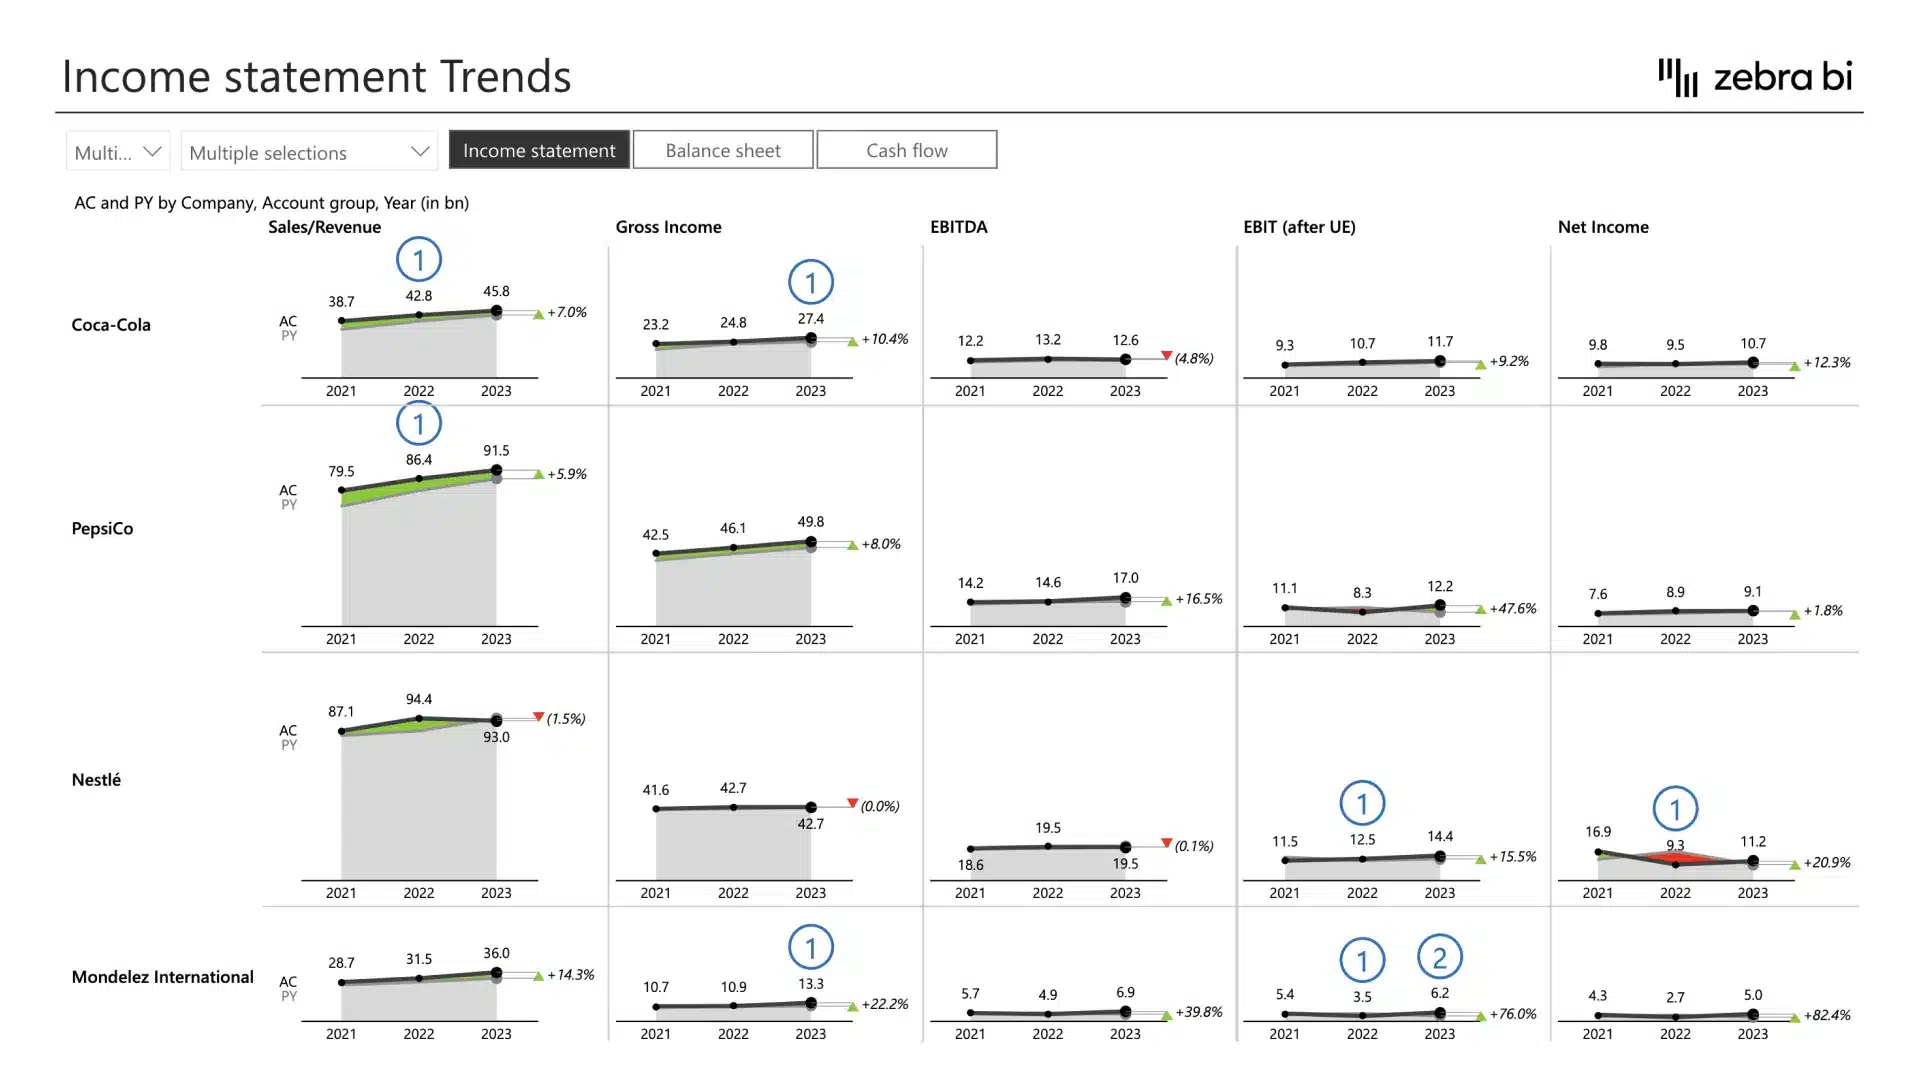
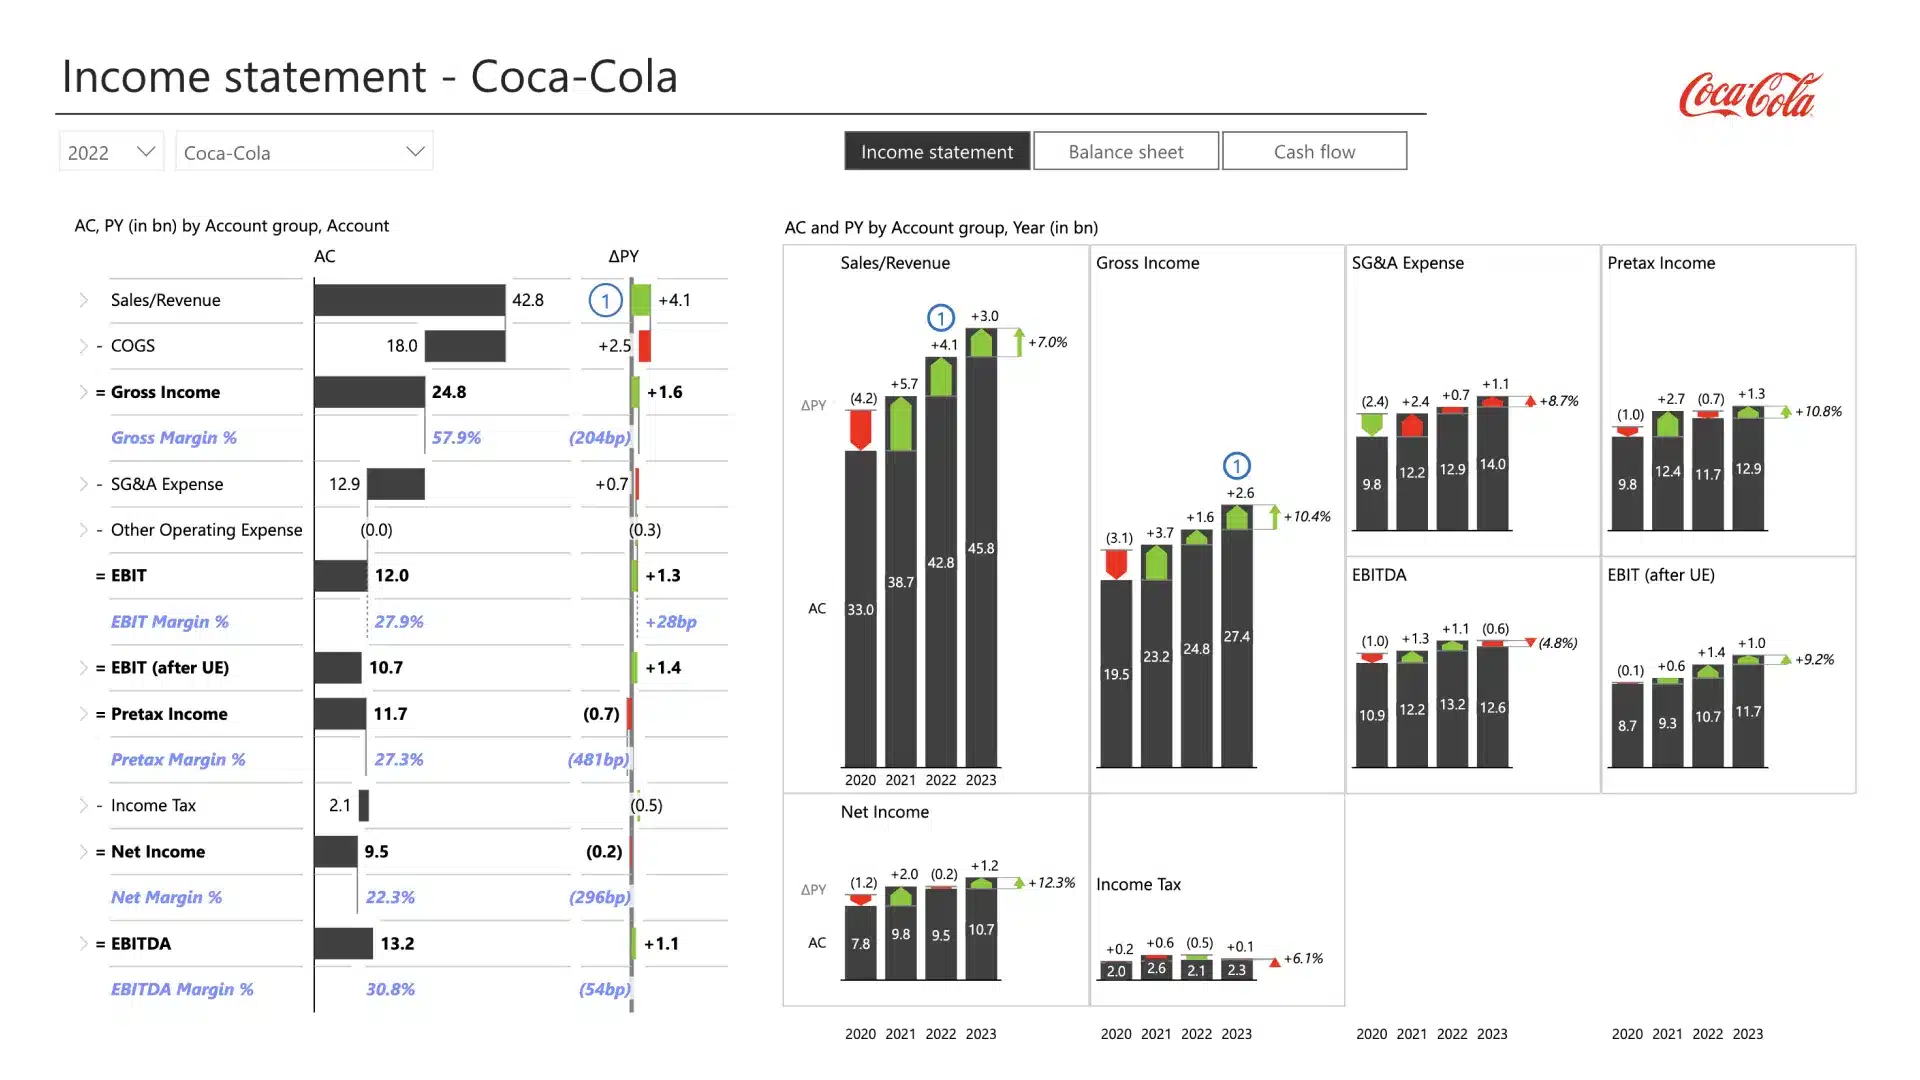
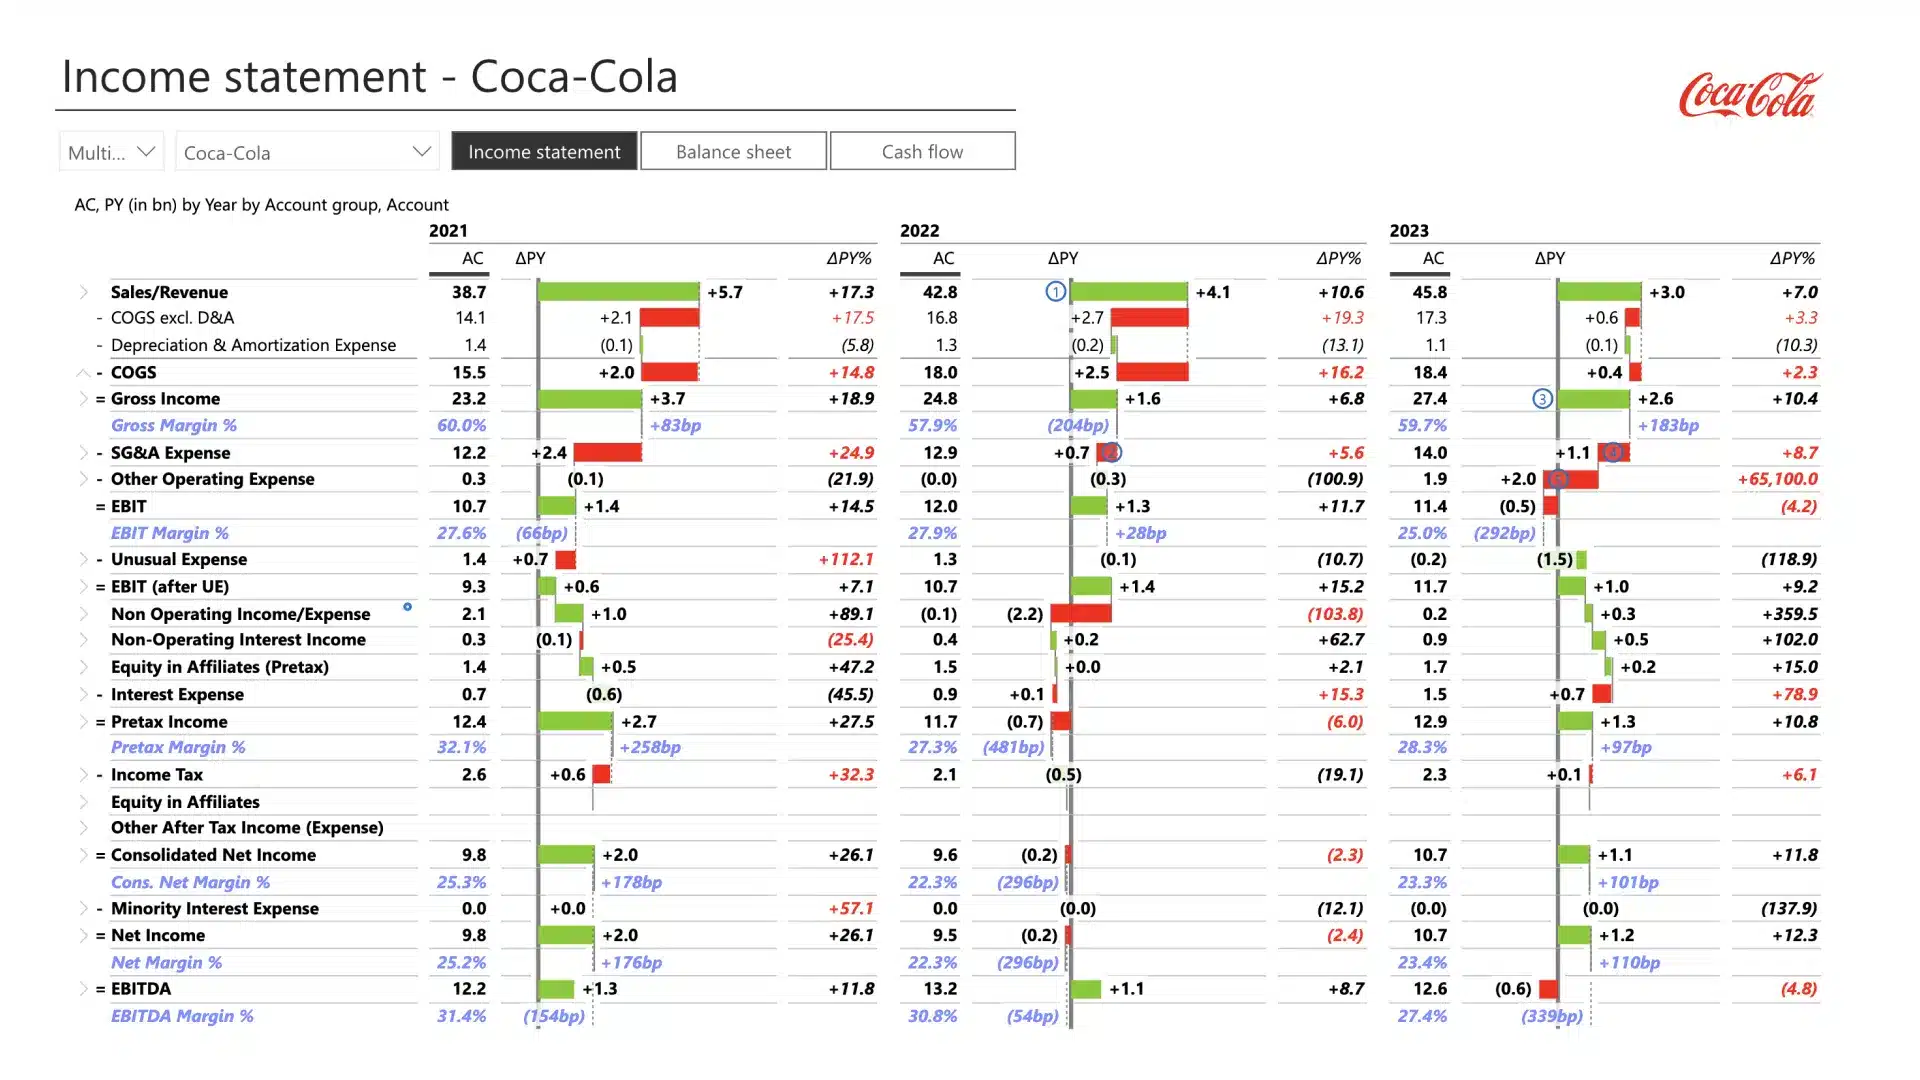
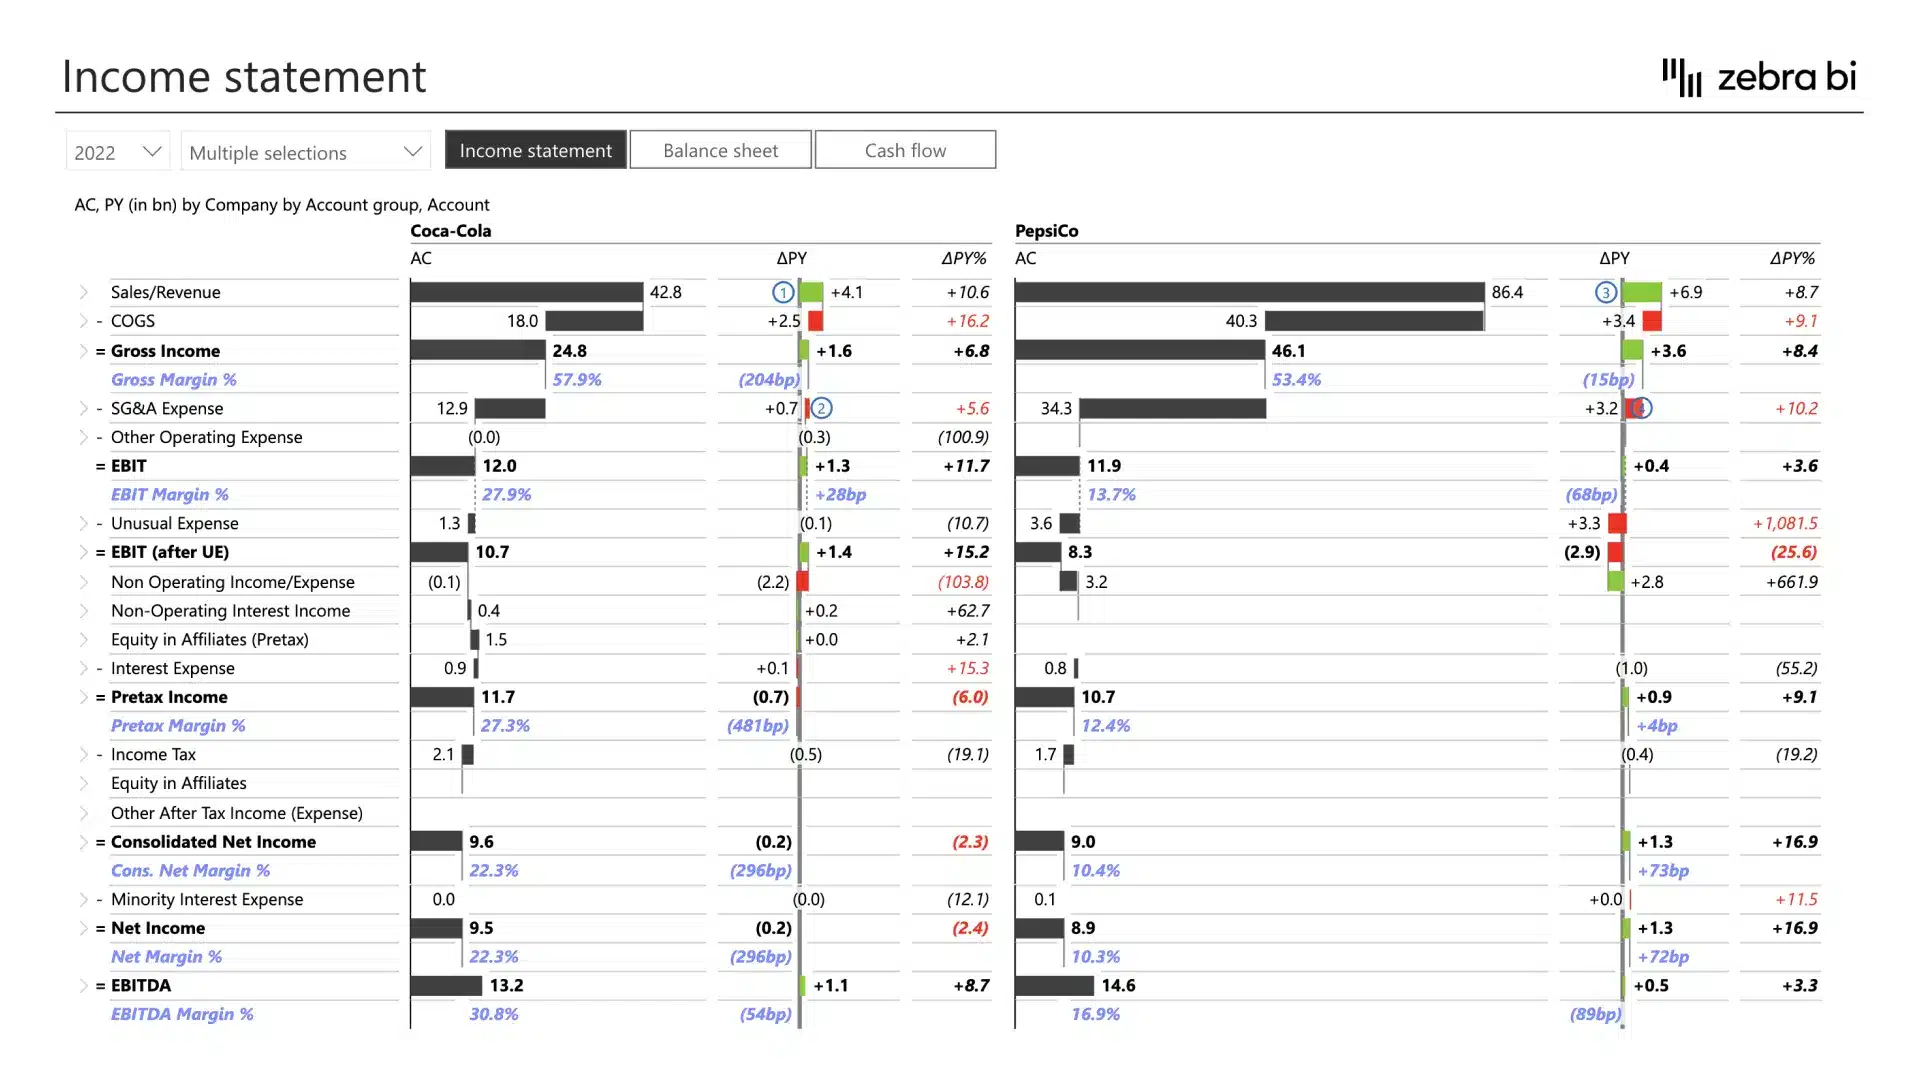
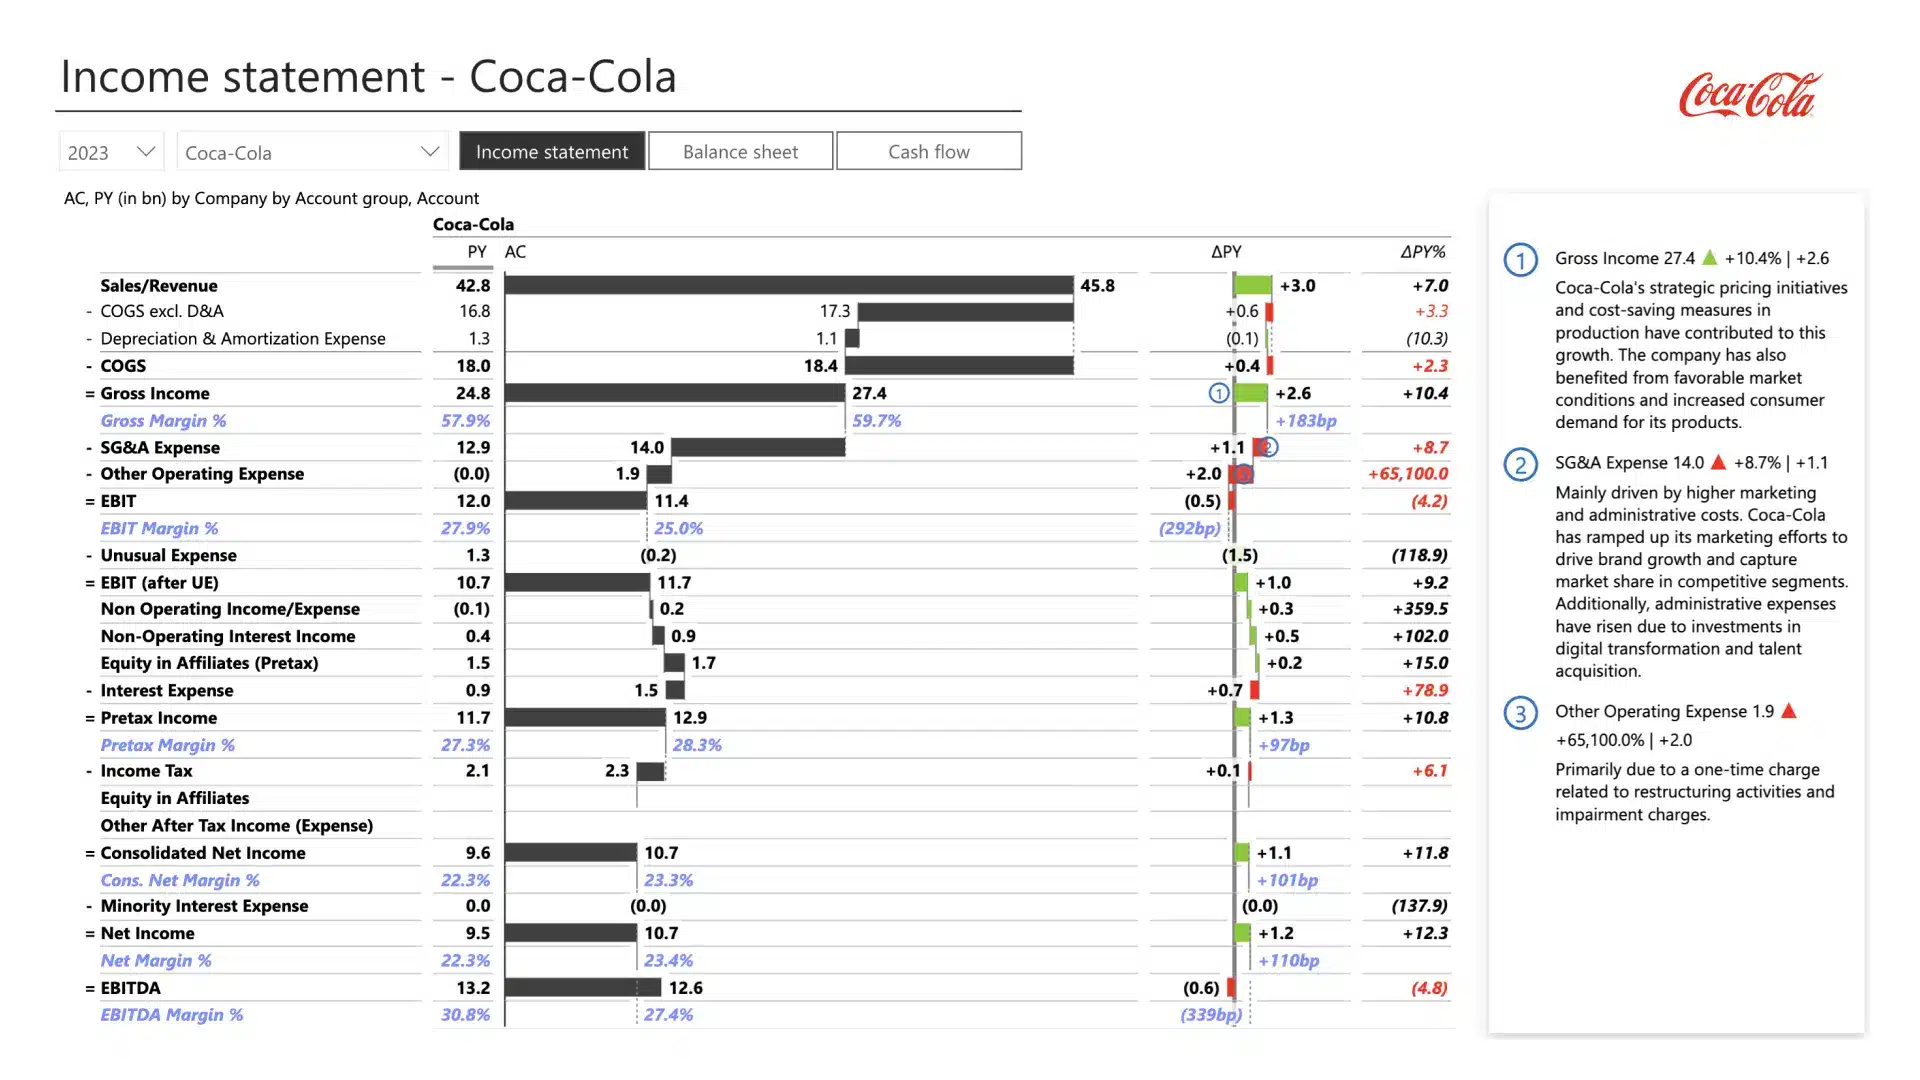
The purpose of this report is to provide precise financial analysis and benchmarking reports for the Food & Beverage industry. The dashboard provides industry professionals with key performance indicators (KPIs) such as Inventory Turnover, Return on Assets (ROA), and Cash Flow Conversion Ratio. Ideal for financial analysts, accountants, and business executives, it simplifies tracking market trends, operational efficiency, and financial health. Use it for monthly, quarterly, and annual reviews to make data-driven decisions, manage costs, and enhance profitability. Compare your performance against industry peers with this dynamic template to stay competitive and achieve strategic goals.
Play with the interactive demo below. If you click the ⤢ icon at the bottom-right of the report page you'll be able to enjoy the full-screen view.
Get started in 3 steps
1
Download & Open
Download the .pbix file and open it in Power BI Desktop
2
Connect Your Data
Replace sample data with your CRM, ERP, or database source
3
Customize & Publish
Adjust KPIs, colors, and branding, then publish to Power BI Service
Fill out the form and get the Power BI template

20,000+ users have downloaded this template