Back to Templates for PowerPoint
Last update:

Financial Management Report in PowerPoint

Revolutionize your financial decision-making process with our free PowerPoint template, designed specifically for comprehensive and insightful financial management reports.
Overview
In the dynamic world of business, a robust financial management report is a critical tool that provides a comprehensive overview of an organization's financial performance over a specific period. This could range from a month to a year-to-date period. Designed to offer valuable insights into an organization's financial health, this report equips management and key decision-makers with the necessary data to make informed and strategic decisions.

Adaptable and Comprehensive Reporting

With our free PowerPoint template, creating an effective financial management report becomes an easier and more streamlined process. This versatile slide deck can be used for various reporting needs, such as monthly reporting to management, quarterly reports, year-end reports, and performance reporting. It's a tool designed with flexibility and utility at its core, readily adjustable to tailor your needs in terms of inputs and formatting.

Uncover Financial Insights

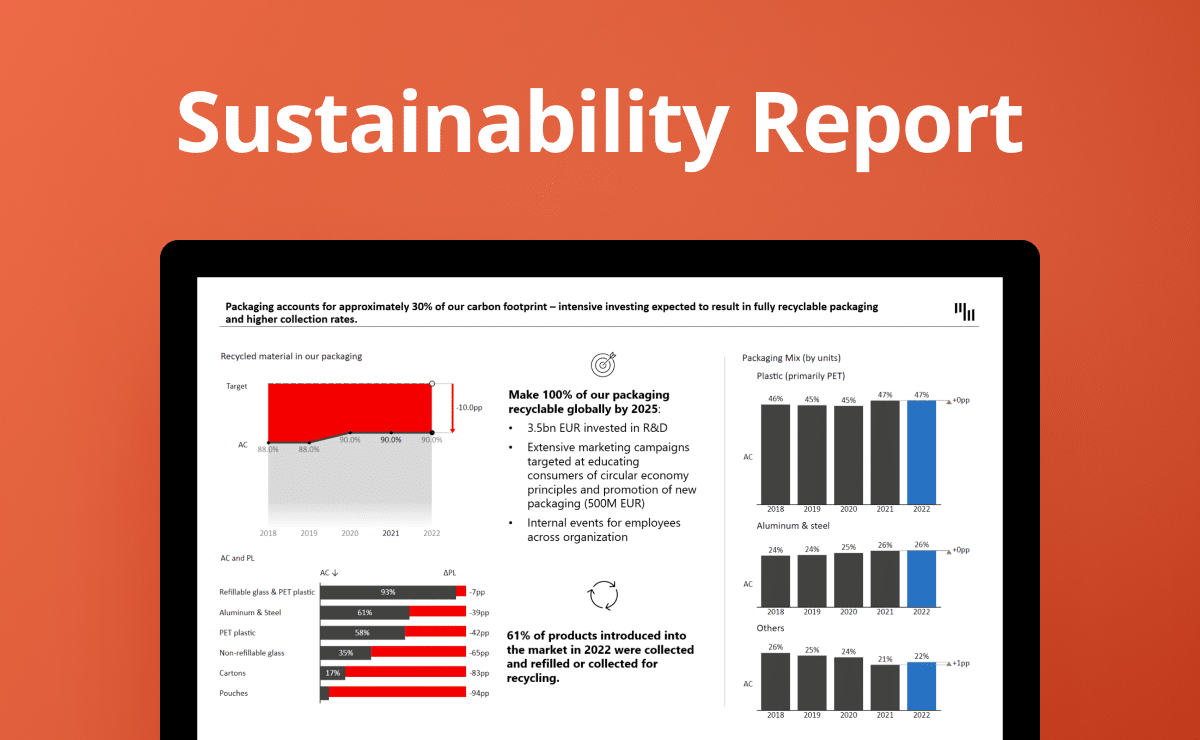
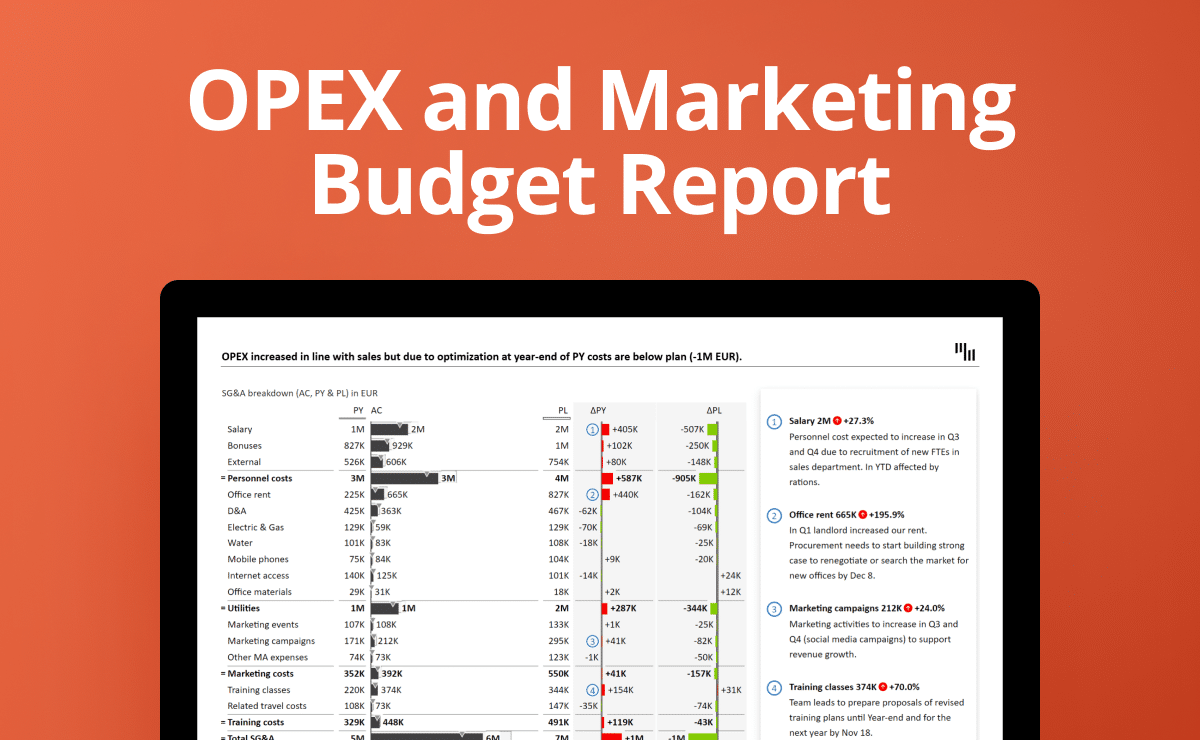
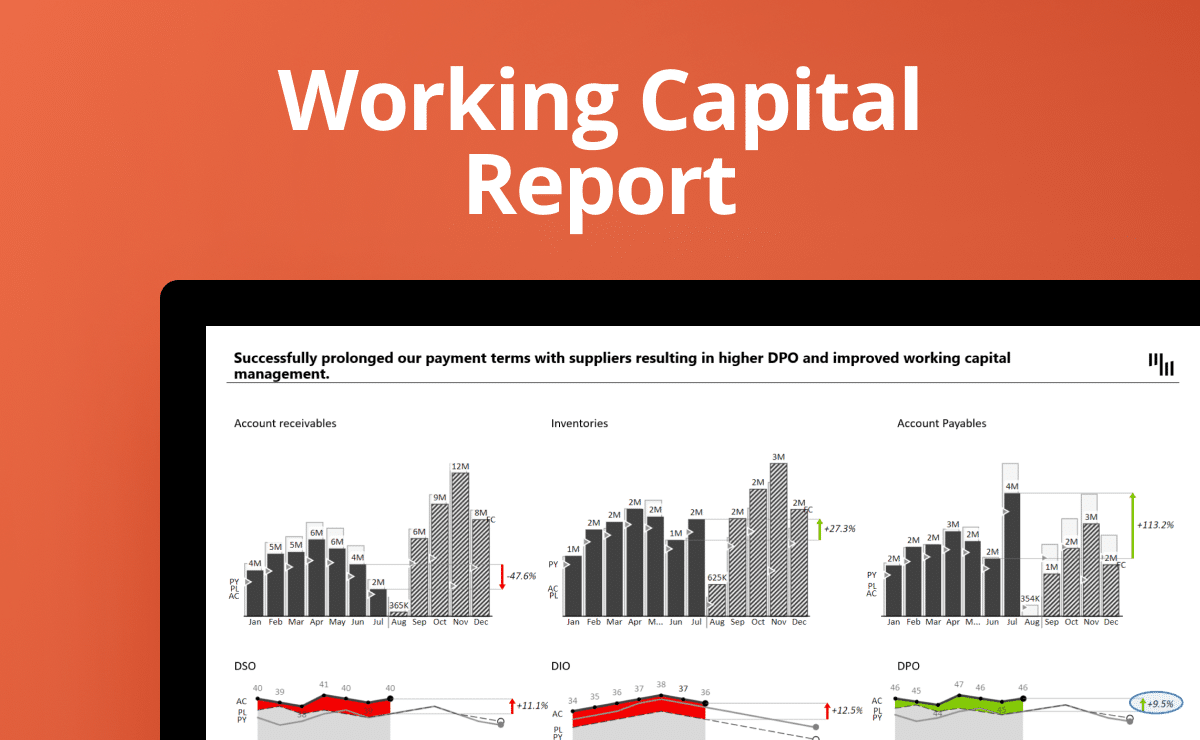
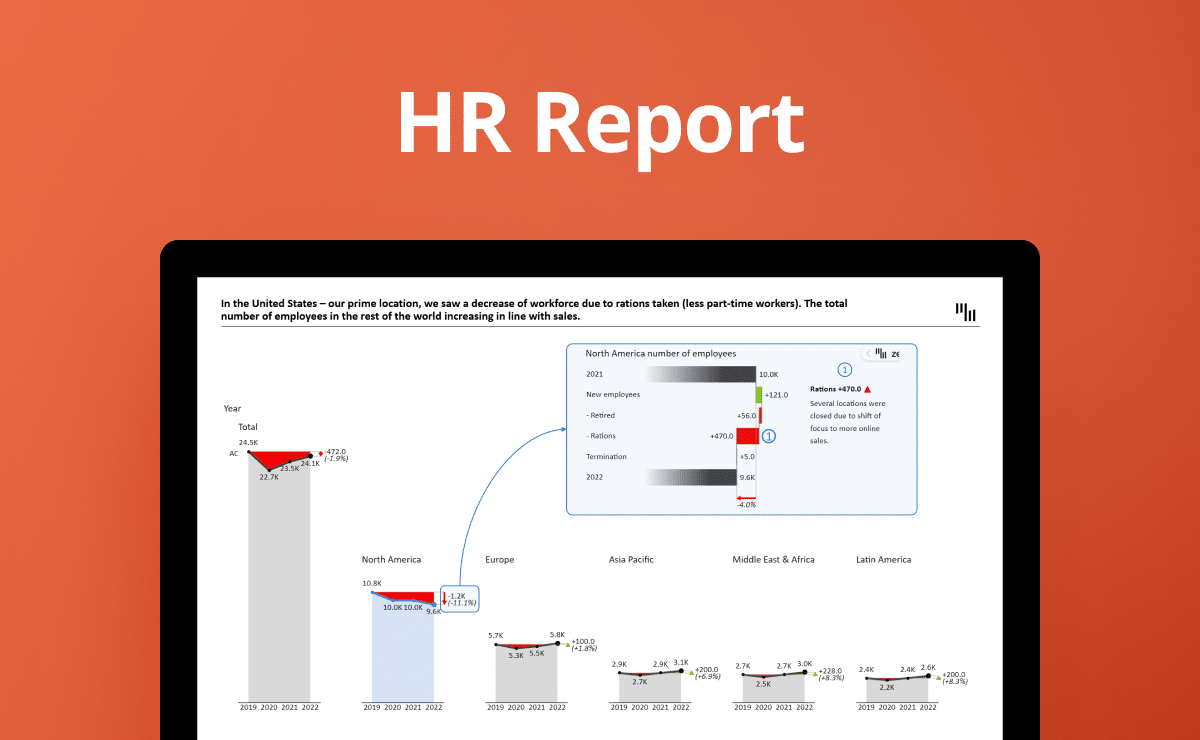
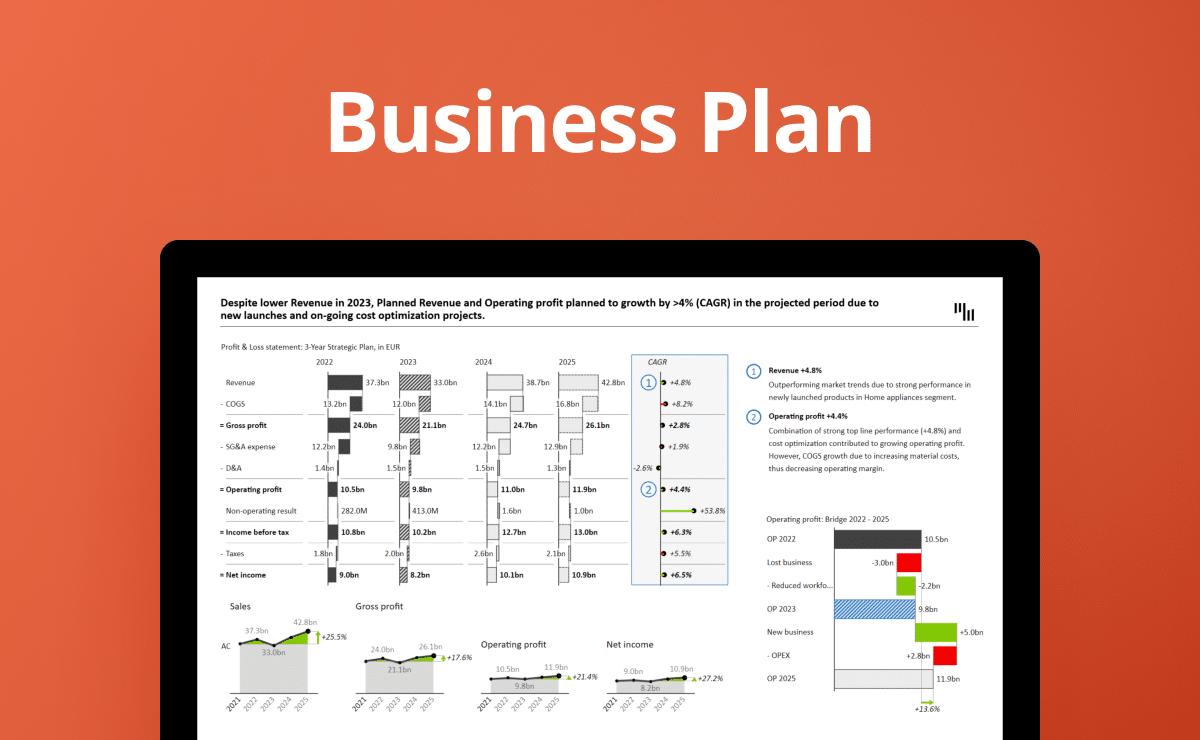
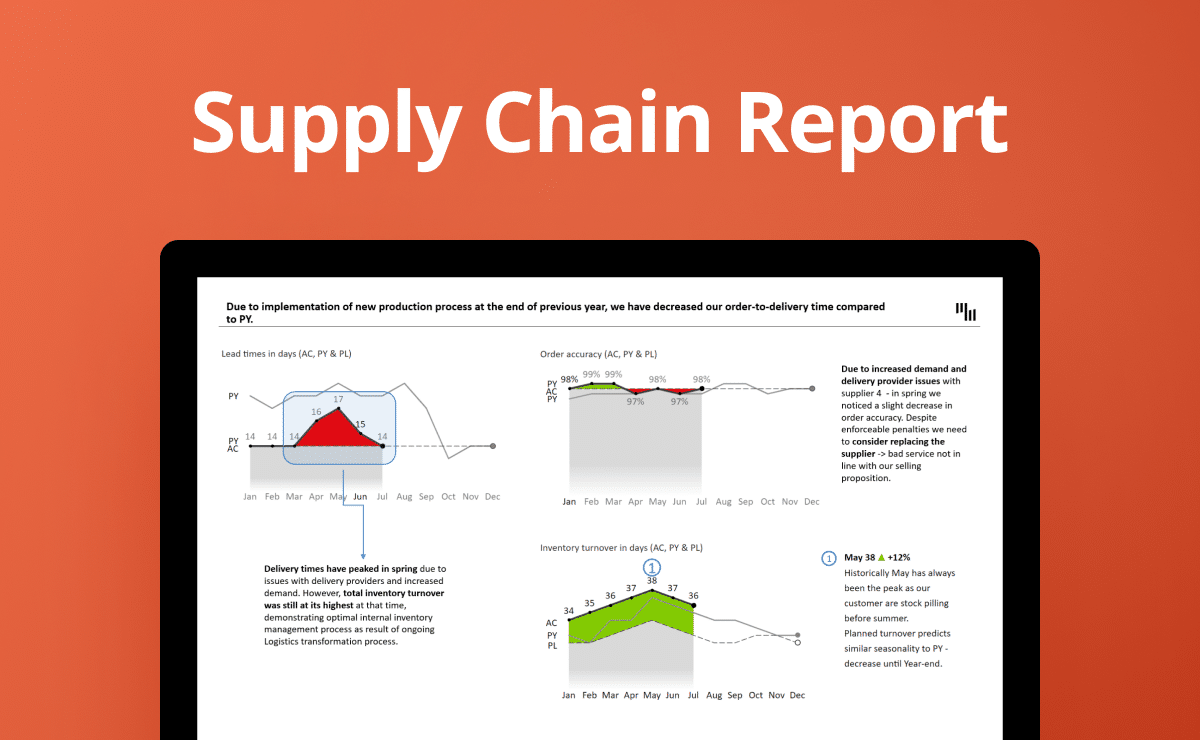
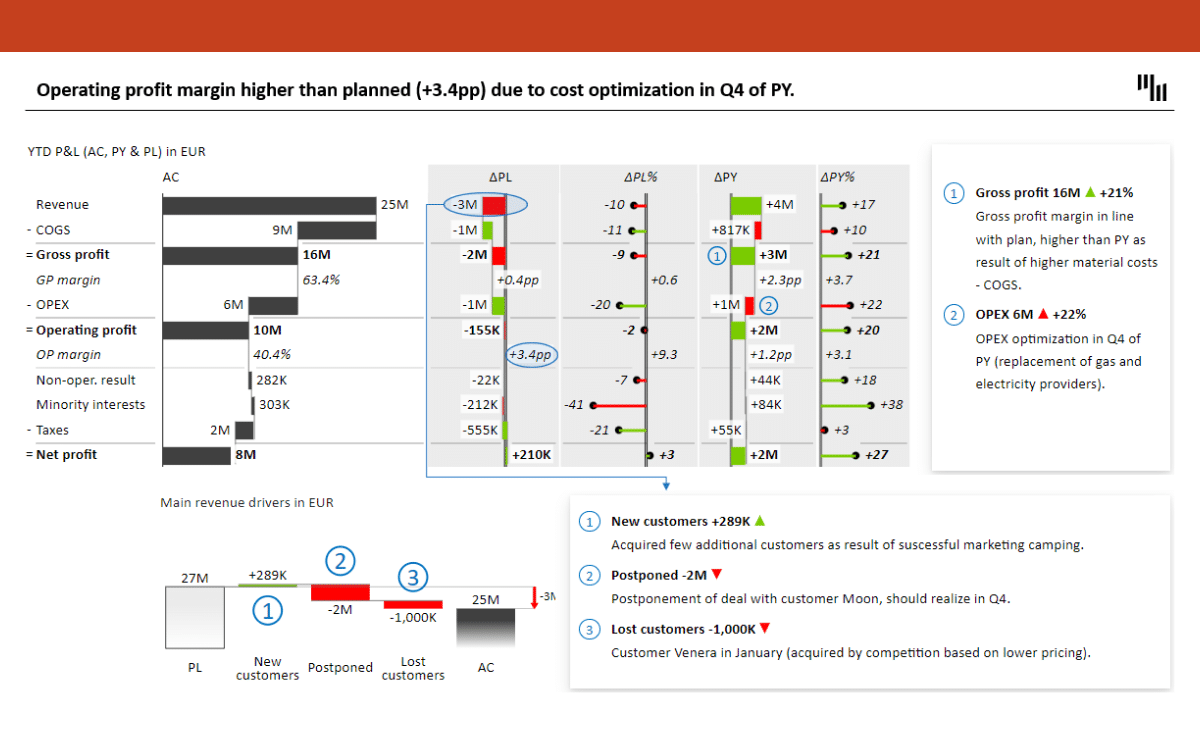
Our financial management report template gives you the power to dive deep into your financials. It offers insight into Profit & Loss statements, balance sheets, cash flow statements, sales performance, cost breakdown, and working capital overviews. These insights are consistently presented with Zebra BI visuals, ensuring clarity and effectiveness in communication.

Fulfilling the Needs of Leadership

The readers of these reports are typically individuals in leadership positions, including but not limited to the CFO, CEO, and top management teams. The level of involvement in the operational aspects of the business can vary, but the critical point is that this template serves those who need a clear, accurate, and insightful overview of financial performance.

Actionable Reporting for Future Success

Our PowerPoint template isn't just about presenting data; it's about creating a narrative that leads to action. This slide deck is an excellent example of a monthly report that includes year-to-date financials and forecasts, with comparisons to the previous year and planned figures. But what sets it apart is its emphasis on actionable reporting. Each report includes comments with action points for future actions, ensuring that every piece of data presented serves a purpose and leads to strategic decision-making.
Features used
Comparison to plan and previous year
Advanced charts & tables
Waterfall chart
Automatic variance calculation
Trends over time
Comments
Hide columns
Highlighting
Formula editor
Start making data-driven decisions today. Our template is a click away, ready to facilitate your financial management process.
Download this template

More professionally-designed templates to use

Contribution Margin Analysis Excel Template
Gross Sales vs Net Sales Excel Report Template
Basic
Financial Forecasting and Planning: Profit & Loss Overview Excel Template
Adjusted EBITDA template and adjusted income statement example created with Zebra BI for Excel
Basic
Adjusted EBITDA Template & Adjusted Income Statement Example for Excel
Basic
Long-Term Assets and CapEx Report Excel Template
Basic
Cash Flow Statement from Pivot Table (Hierarchical)
Intermediate
Break-Even Analysis Template for Excel
Intermediate
Working Capital Analysis Template in Excel
Intermediate
Sales variance analysis report templates for Excel
income statement template excel afi
Intermediate
Basic
Income statement templates for Excel
Advanced
Consolidated financials dashboard in Excel
Intermediate
Sales variance report with multiple levels
Intermediate
Sales overview report in Excel
Advanced
Sales dashboard in Excel
Intermediate
Revenue-cost-profit analysis
Intermediate
Inventory report
Intermediate
Quarterly income statement
Basic
Income statement with multiple levels
Basic
Balance sheet template for Excel
Basic
Subscription business model analysis in Excel
Basic
Marketing budget variance analysis in Excel
Basic
Income statement (bridge chart) in Excel
Intermediate
Price-Volume-Mix variance analysis in Excel
Basic
EBIT contribution analysis in Excel
Basic
Cash Flow Statement template
Basic
Income statement in Excel (PY-AC-PL-FC)
Basic
Income statement in Excel (PY-AC-PL)
Basic
Income Statement in Excel (PY-AC) and (AC-PL)
Basic
Cost Variance Table in Excel (PY-AC-FC-PL)
Basic
Cost Variance Table in Excel (PY-AC-PL)
Basic
Cost Variance Table in Excel (PY-AC and AC-PL)
Intermediate
Monthly Sales Variances in Excel (PY-AC-FC-PL)
Intermediate
Monthly Sales Variances in Excel (AC-FC-PL)
Intermediate
Monthly Sales Variances in Excel (AC-PY-PL)
Intermediate
Monthly Sales Variances in Excel (PY-AC and AC-PL)
Basic
Sales Variance Table in Excel (PY-AC-FC-PL)
Basic
Sales Variance Table in Excel (PY-AC-PL)
Basic
Sales variance table in Excel (PY vs. AC and AC vs. PL)