OPEX and Marketing Budget Report PowerPoint Template
Overview
In the intricate world of financial planning and analysis, understanding and managing operational expenses (OPEX) and marketing budgets is key. The OPEX and Marketing Budget report PowerPoint template by Zebra BI is an essential tool for FP&A professionals, Business/Financial Controllers, CFOs, Financial Analysts, Business Planning and Analytics experts, Business Analysts, Marketing teams, and CMOs. This template is designed to enhance budget tracking, resource allocation, and profitability analysis, crucial for assessing the efficacy of marketing strategies and expenditures. Discover the benefits of precise budget management with Zebra BI for PowerPoint.
Optimizing Budget Allocation and Resource Management
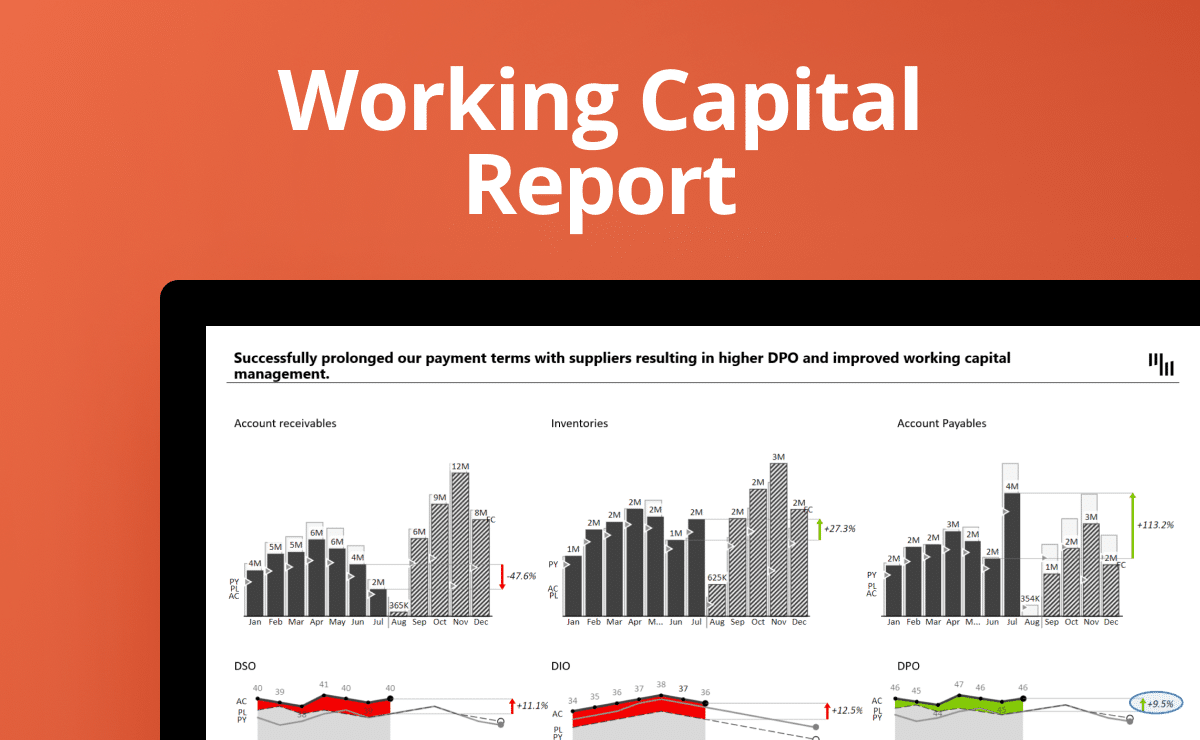
Effective budget tracking is not just about monitoring expenses; it's about strategic resource allocation and understanding profitability. For sectors where marketing is a significant cost center, this template provides a comprehensive view of spending patterns. It enables easy comparison with previous years or planned budgets, offering valuable insights into the success rate of marketing activities and remaining budget. With Zebra BI's standardized, IBCS-compliant charts and tables, your financial reporting becomes more than data—it becomes a story that engages and informs every member of your organization.
Clarity and Engagement in Financial Reporting
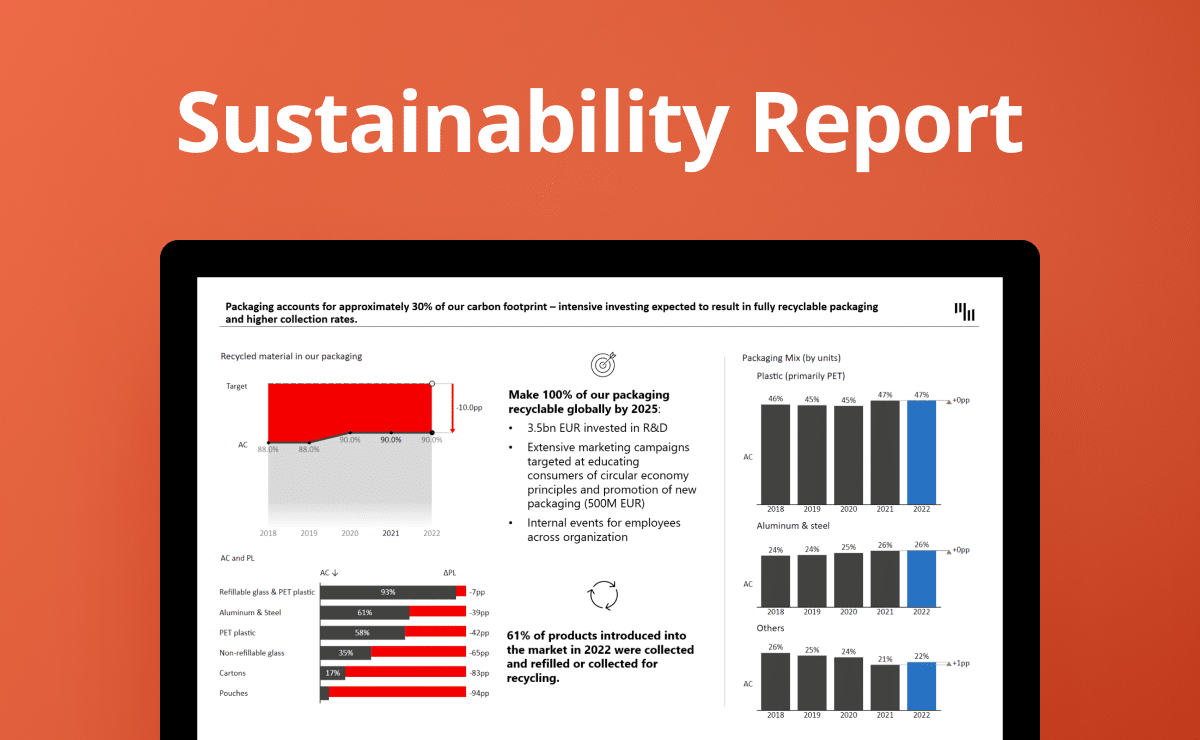
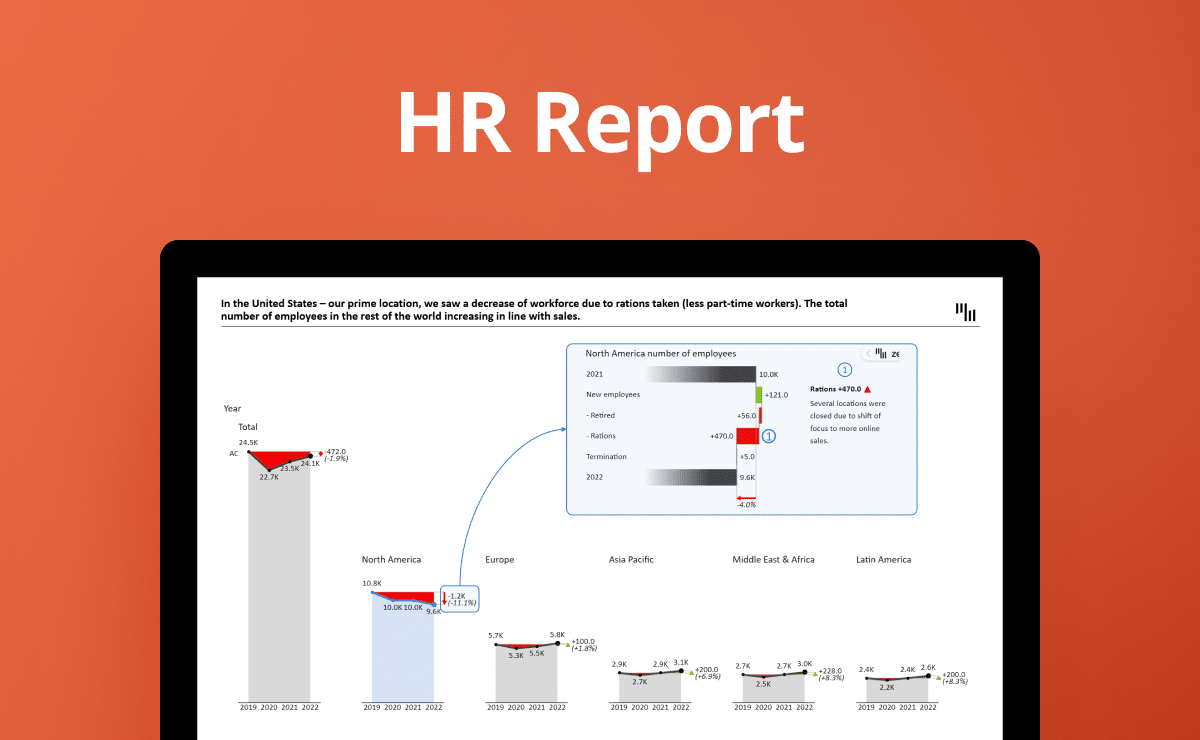
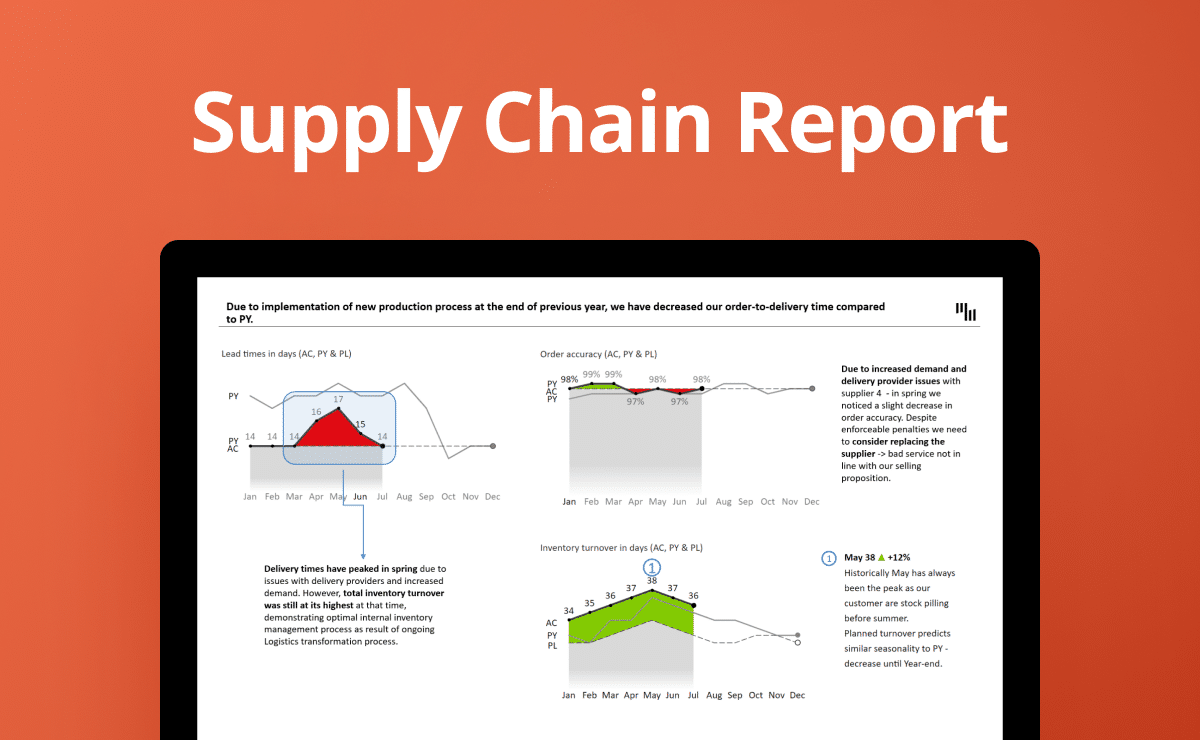
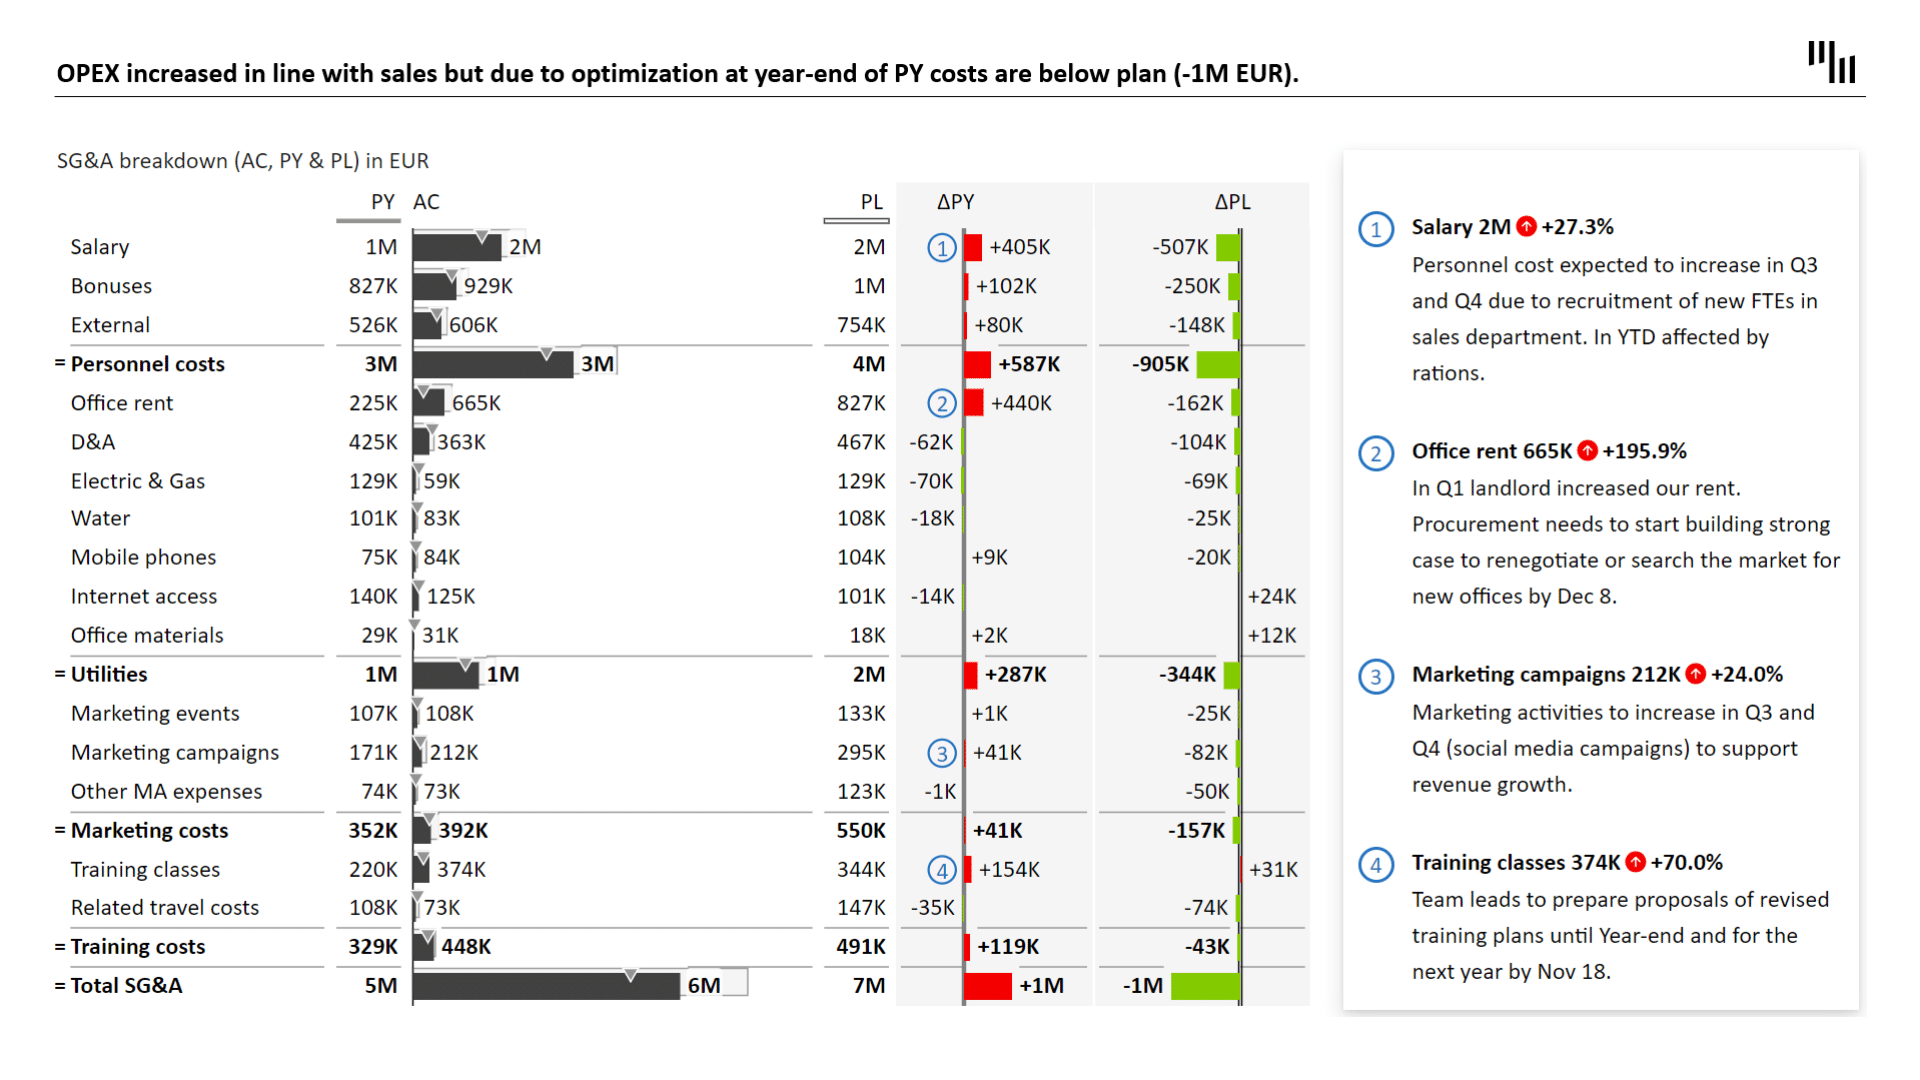
The OPEX and Marketing Budget Report PowerPoint Template transforms complex financial data into clear, engaging, and easily interpretable visuals. ZBI Tables, in particular, bring a new level of clarity to even the most intricate financial tables. This template not only presents total OPEX in a period-over-period overview but also delves into detailed marketing budget tracking. It offers a clear depiction of where your spending stands in relation to your goals, enhancing the decision-making process.
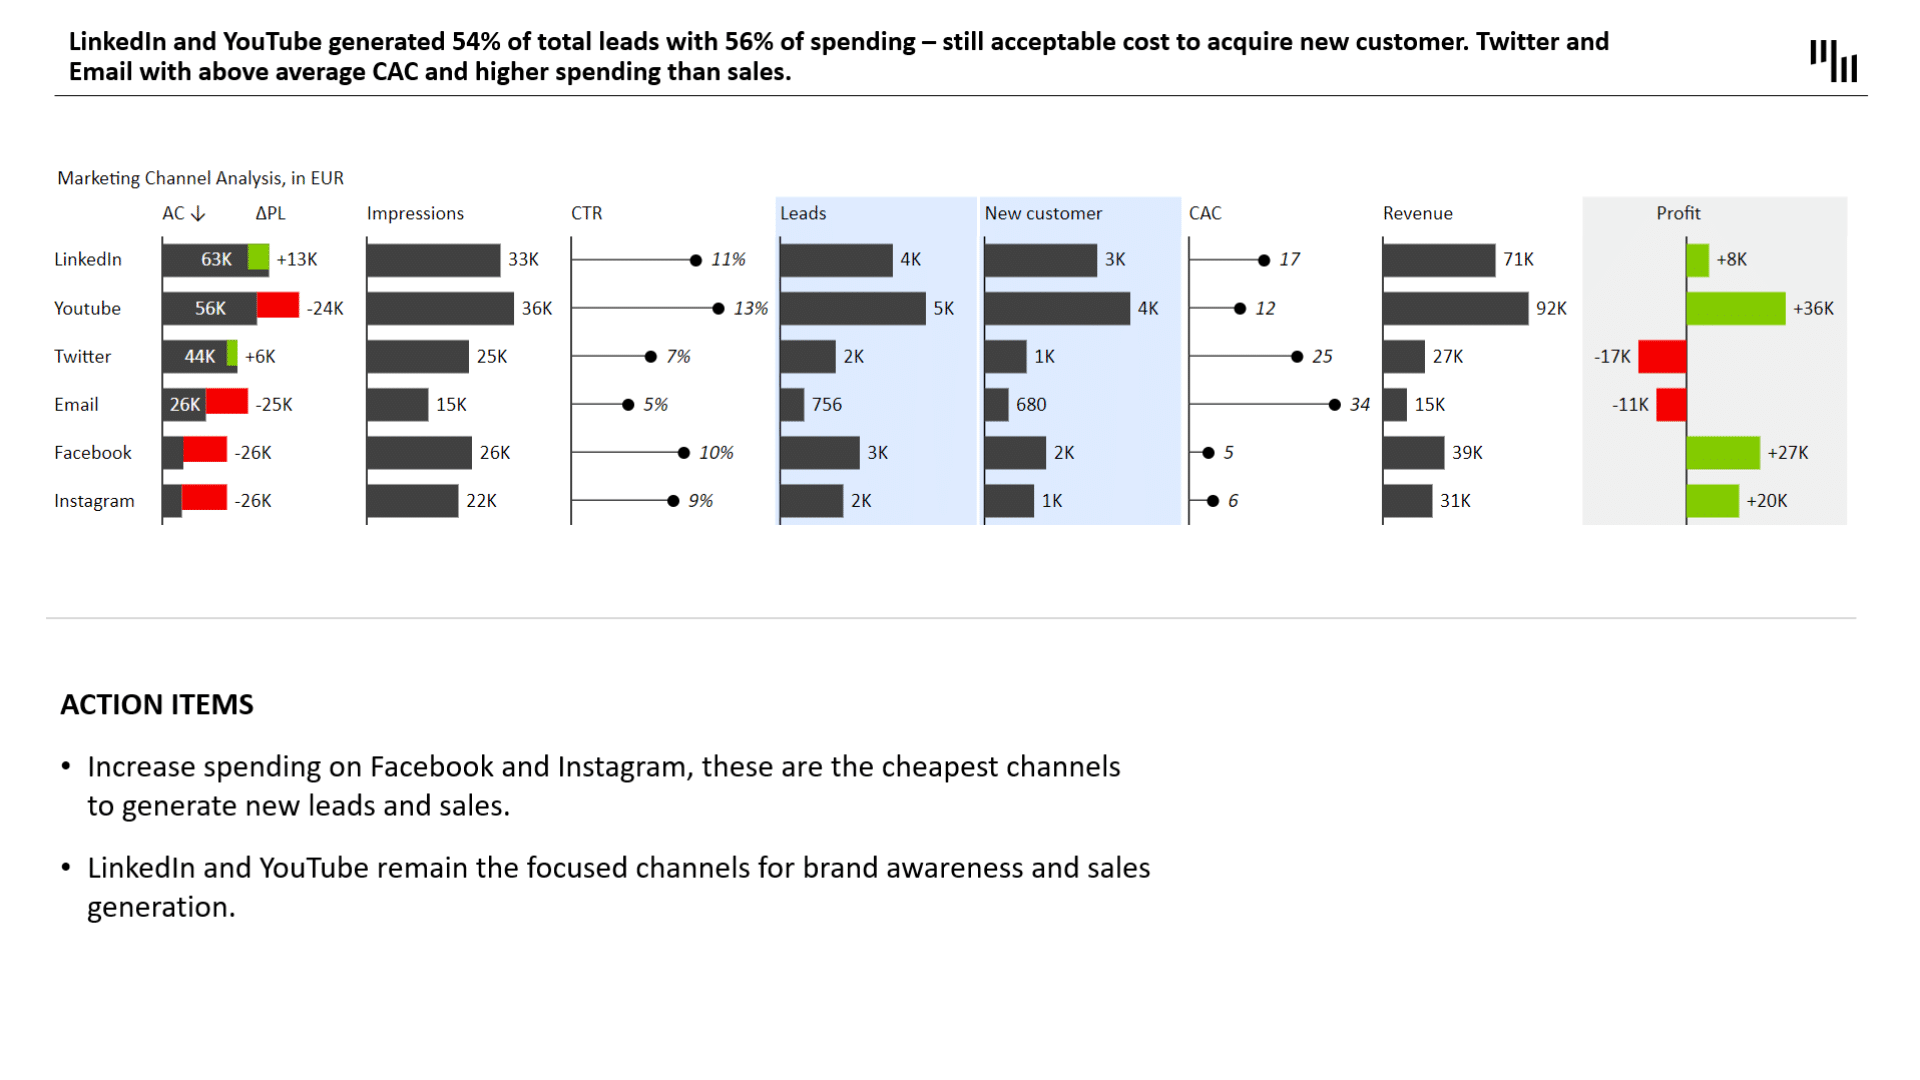
Marketing Budget Analysis with Real-Life Insights
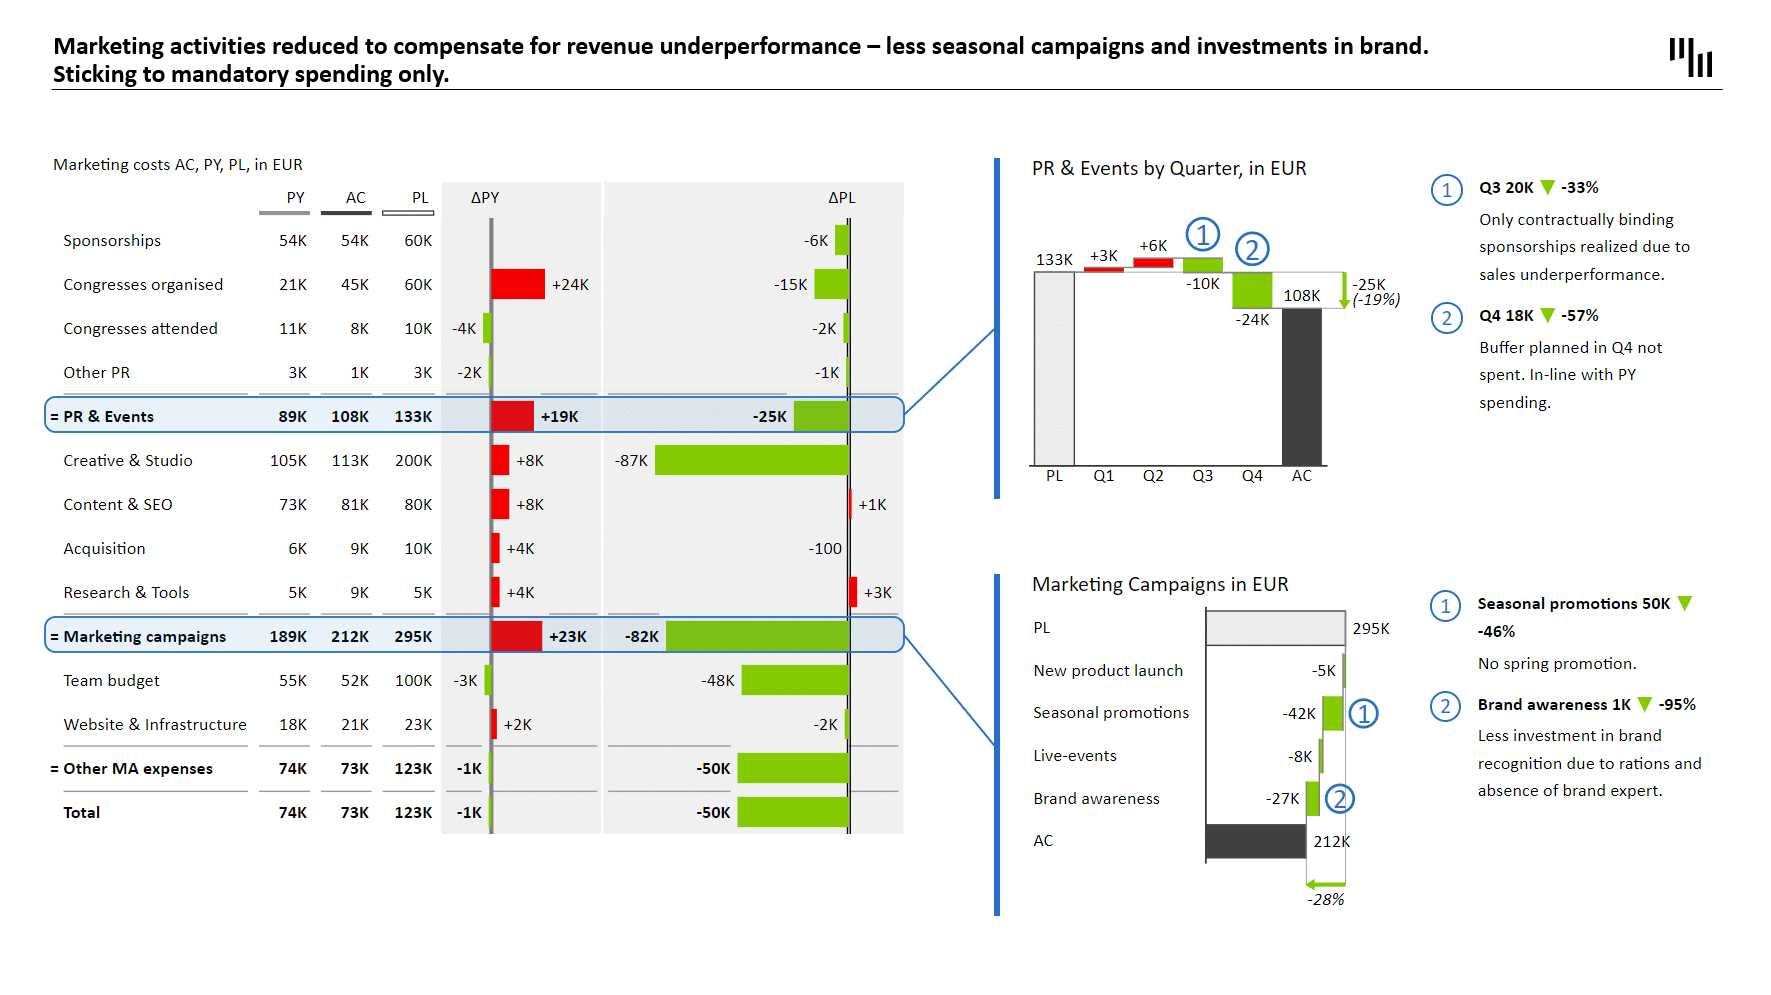
In addition to tracking marketing budgets, this template provides an overview of marketing channel efficiency, allowing for a comprehensive assessment of what's working and what's not in the market. These real-life insights are invaluable for drawing conclusions and planning future marketing strategies. The ZBI Tables in this template serve as a powerful tool, offering lucid insights from your data to make accurate business decisions.
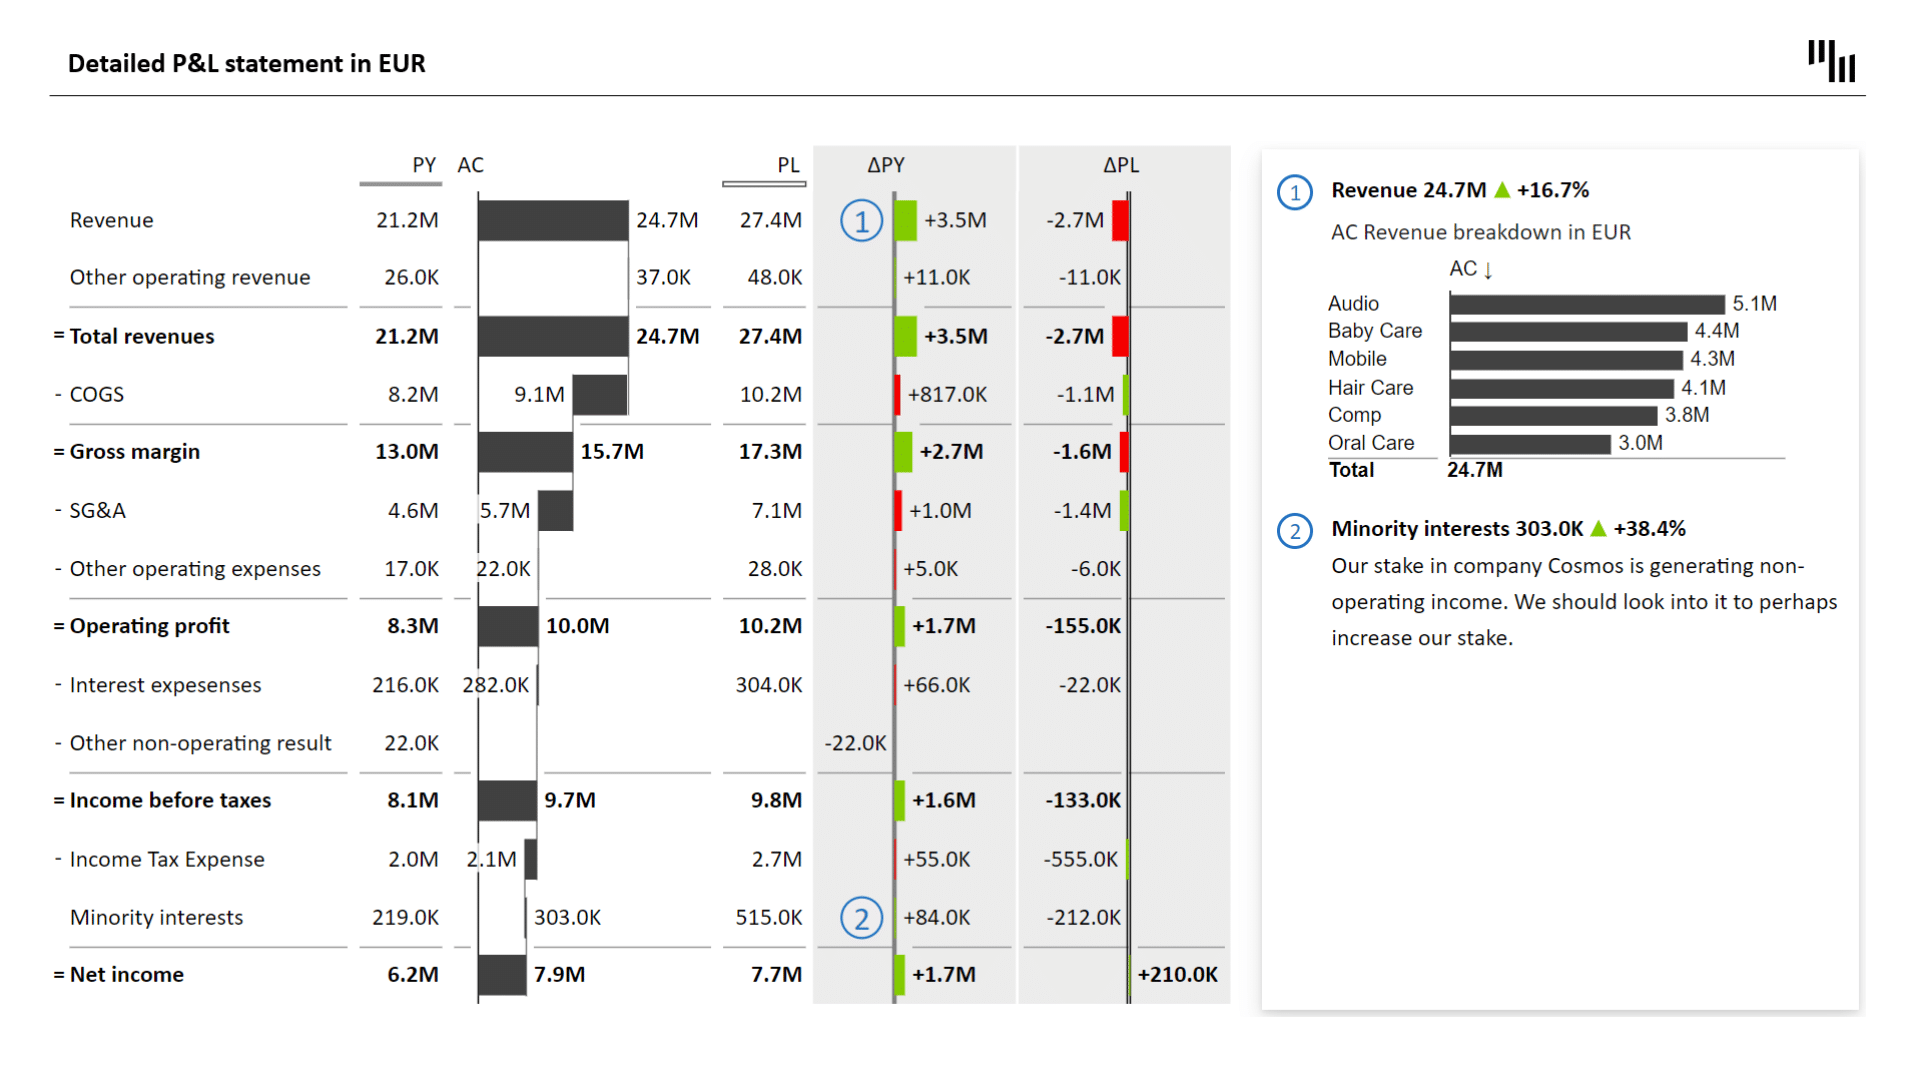
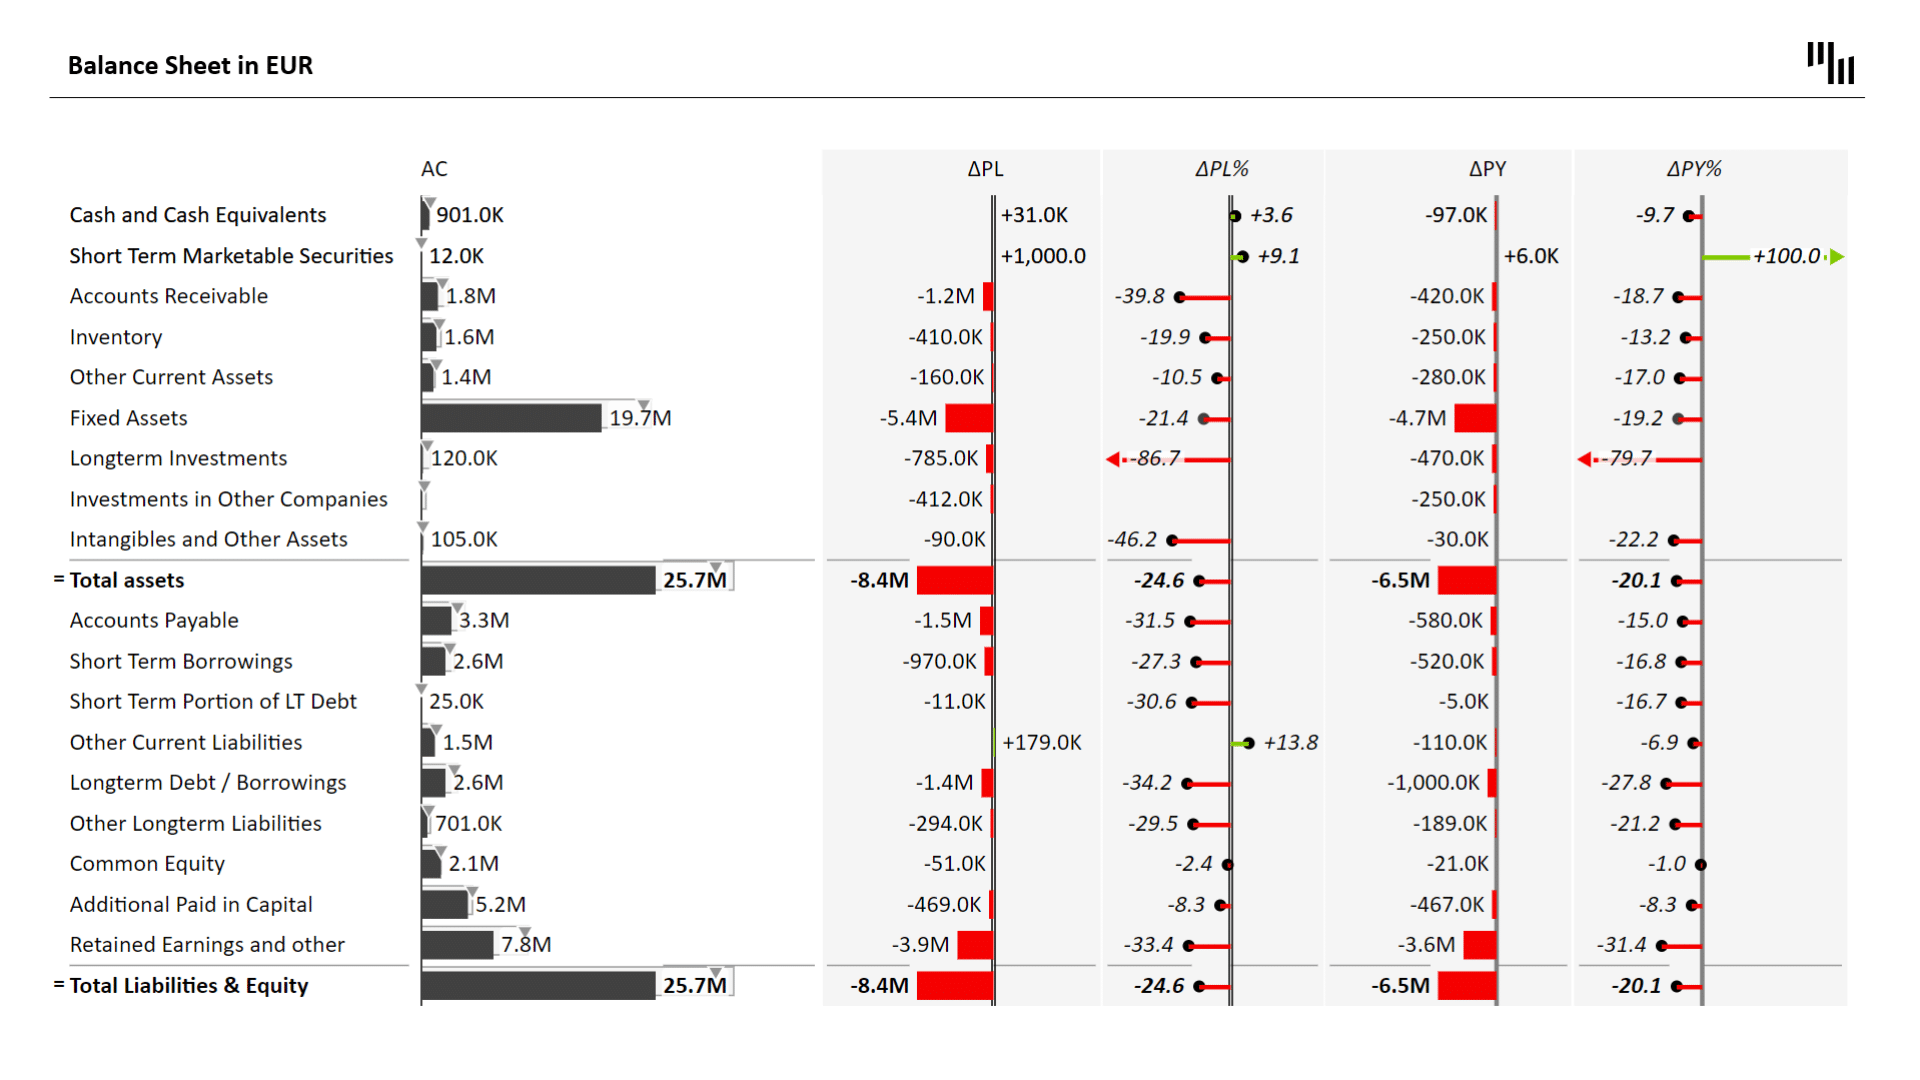
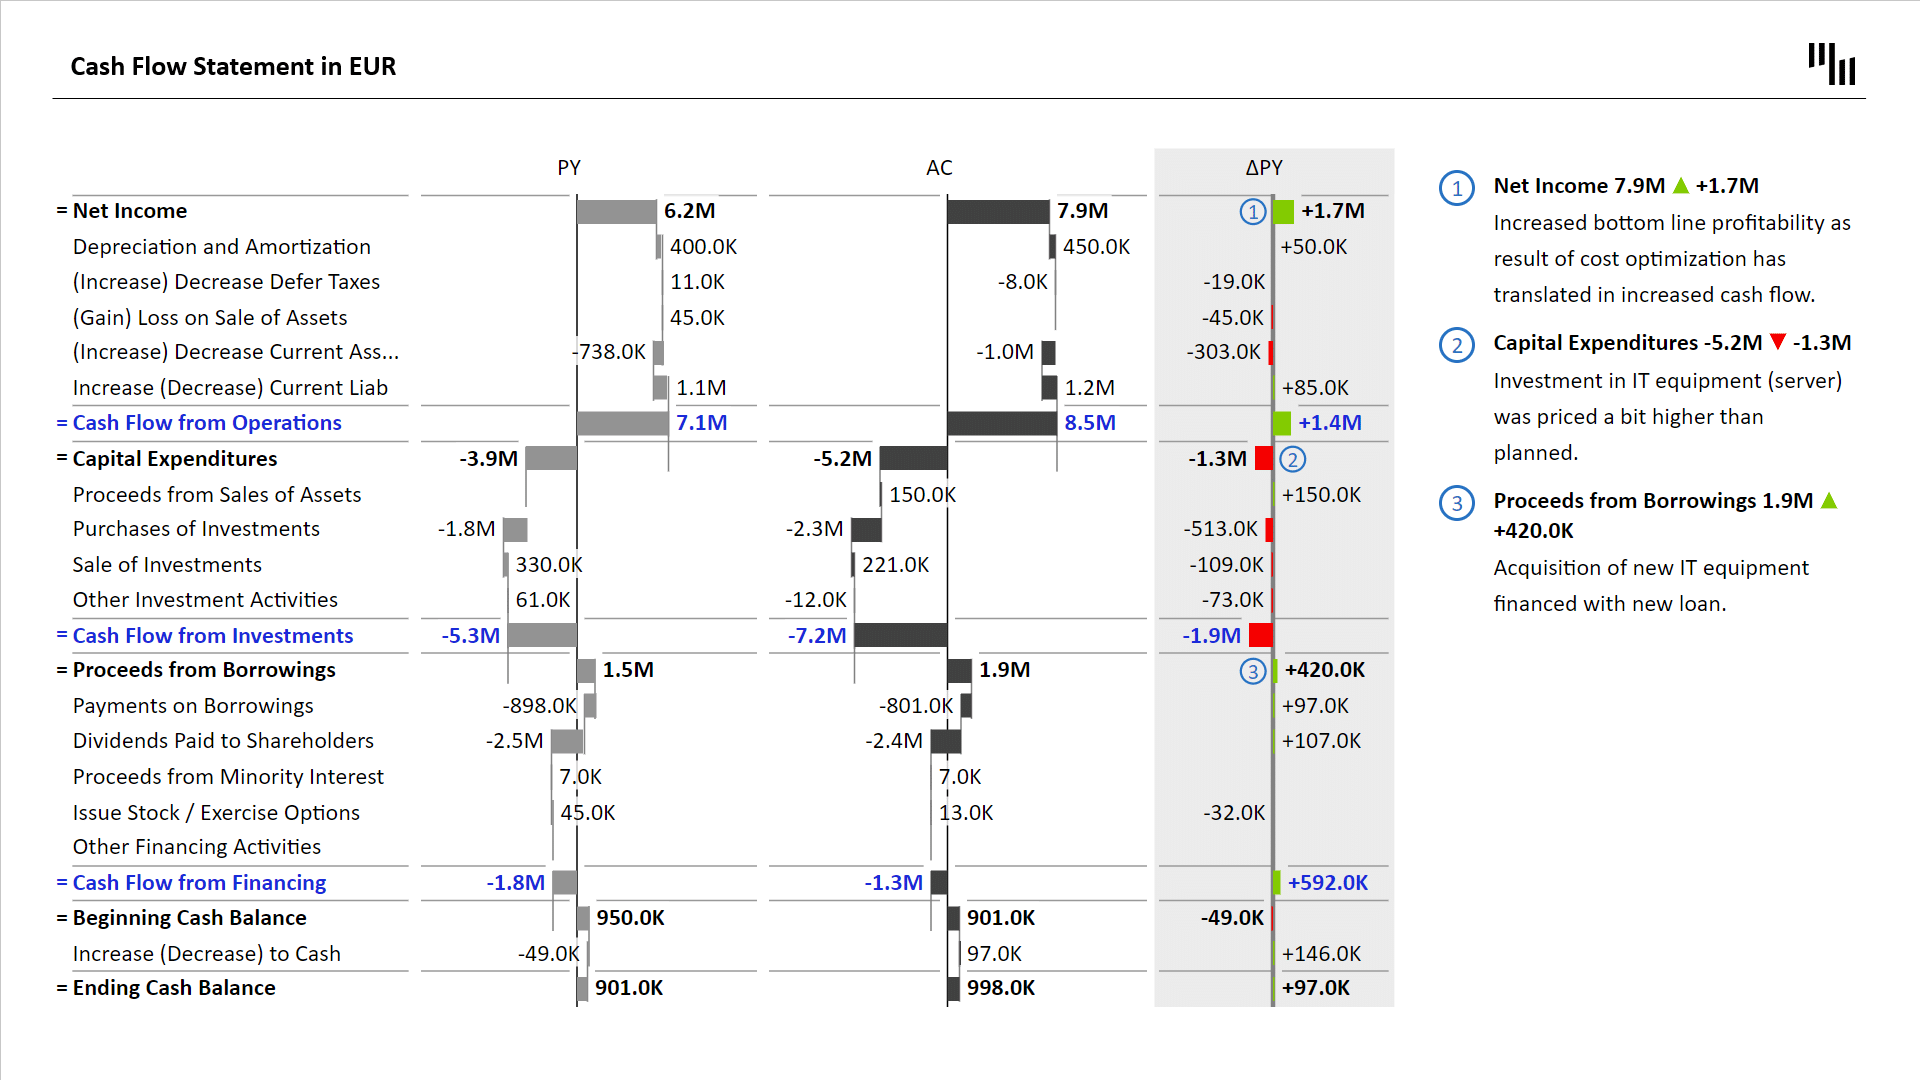
Detailed Financial Reporting for Informed Strategies
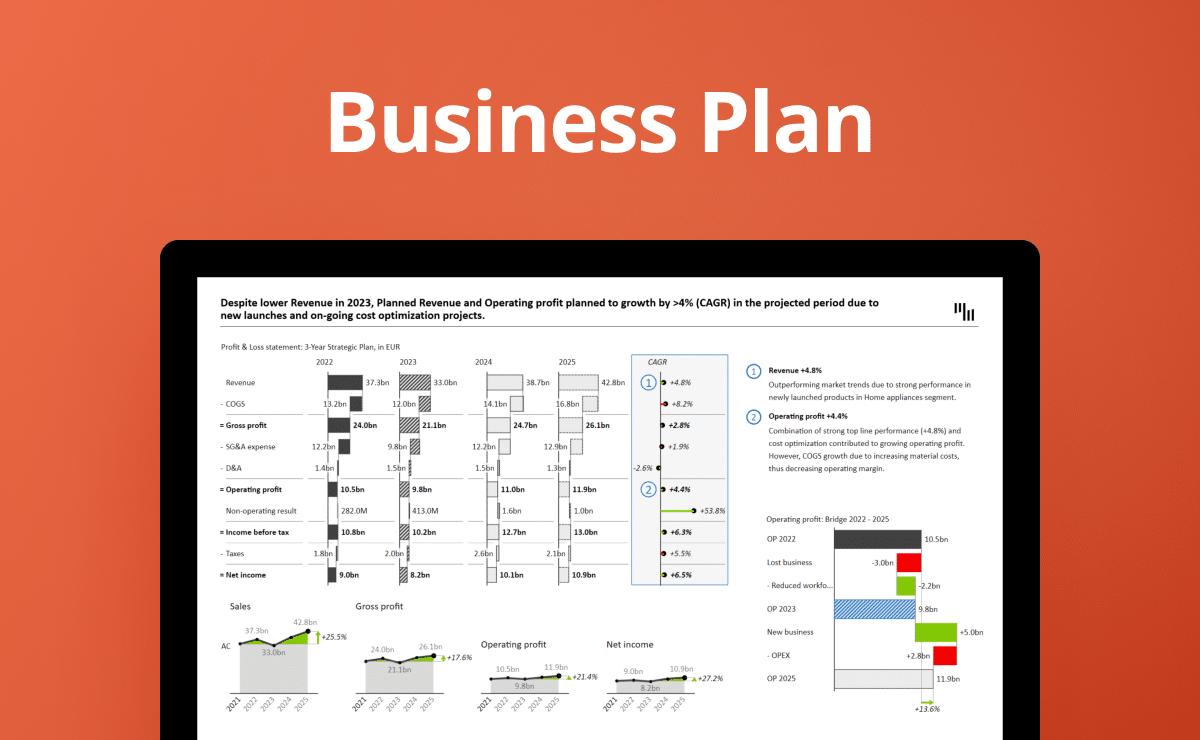
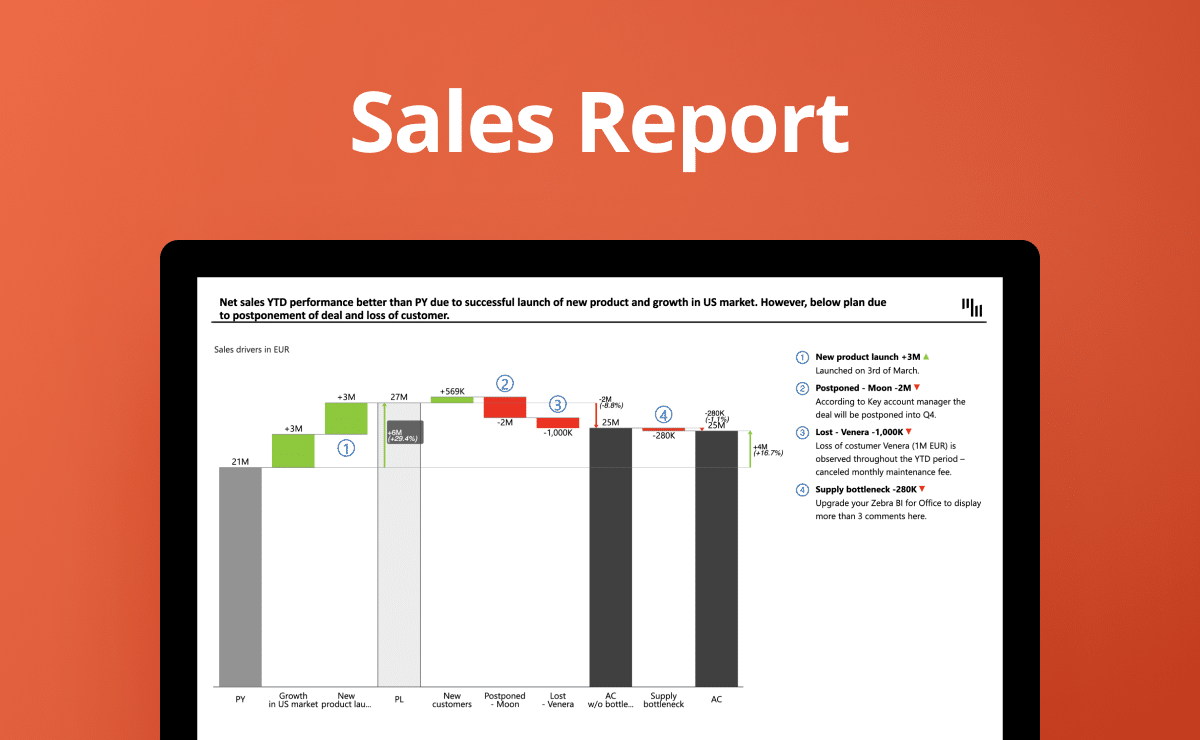
This template goes beyond basic budget reporting. It includes examples of how to present detailed financial statements such as P&L, Balance Sheets, and Cash Flow statements in PowerPoint, with a focus on variance and period comparisons. This feature is essential for a holistic financial understanding, ensuring that every financial aspect is accounted for in your strategic planning.
Empower Your Financial Narratives
Elevate your financial presentations with the OPEX and Marketing Budget Report PowerPoint Template from Zebra BI. Download this versatile tool, input your data, and experience how it transforms complex financial information into compelling narratives, driving strategic decisions and organizational alignment.