Sustainability Report PowerPoint Template
Overview
Sustainability Report PowerPoint Template: Charting a Greener Future
In today's world, sustainability reporting is not just a corporate responsibility; it's a strategic imperative. The Sustainability Report PowerPoint Template by Zebra BI is tailored for FP&A experts, Business/Financial Controllers, COOs, Business Planning and Analytics professionals, and Business Analysts. It's designed to leverage sustainability reporting for enhanced risk management, cost optimization, streamlined decision-making, and help improve corporate reputation. With this template, sustainability reports go beyond mere compliance—they become tools to stay ahead of the competition. Experience the power of data-driven sustainability decisions with Zebra BI for PowerPoint.
Empowering Sustainable Decision-Making
The significance of sustainability reporting in today's business landscape cannot be overstated. It serves as a critical tool for businesses to manage environmental impacts while aligning with global sustainability goals. The sustainability report PowerPoint template ensures that your reports are not only compliant with IBCS standards but also clear, standardized, and insightful. Zebra BI's Charts and Tables provide efficiency and interactivity, adding substantial value to both the preparation and interpretation of sustainability reports.
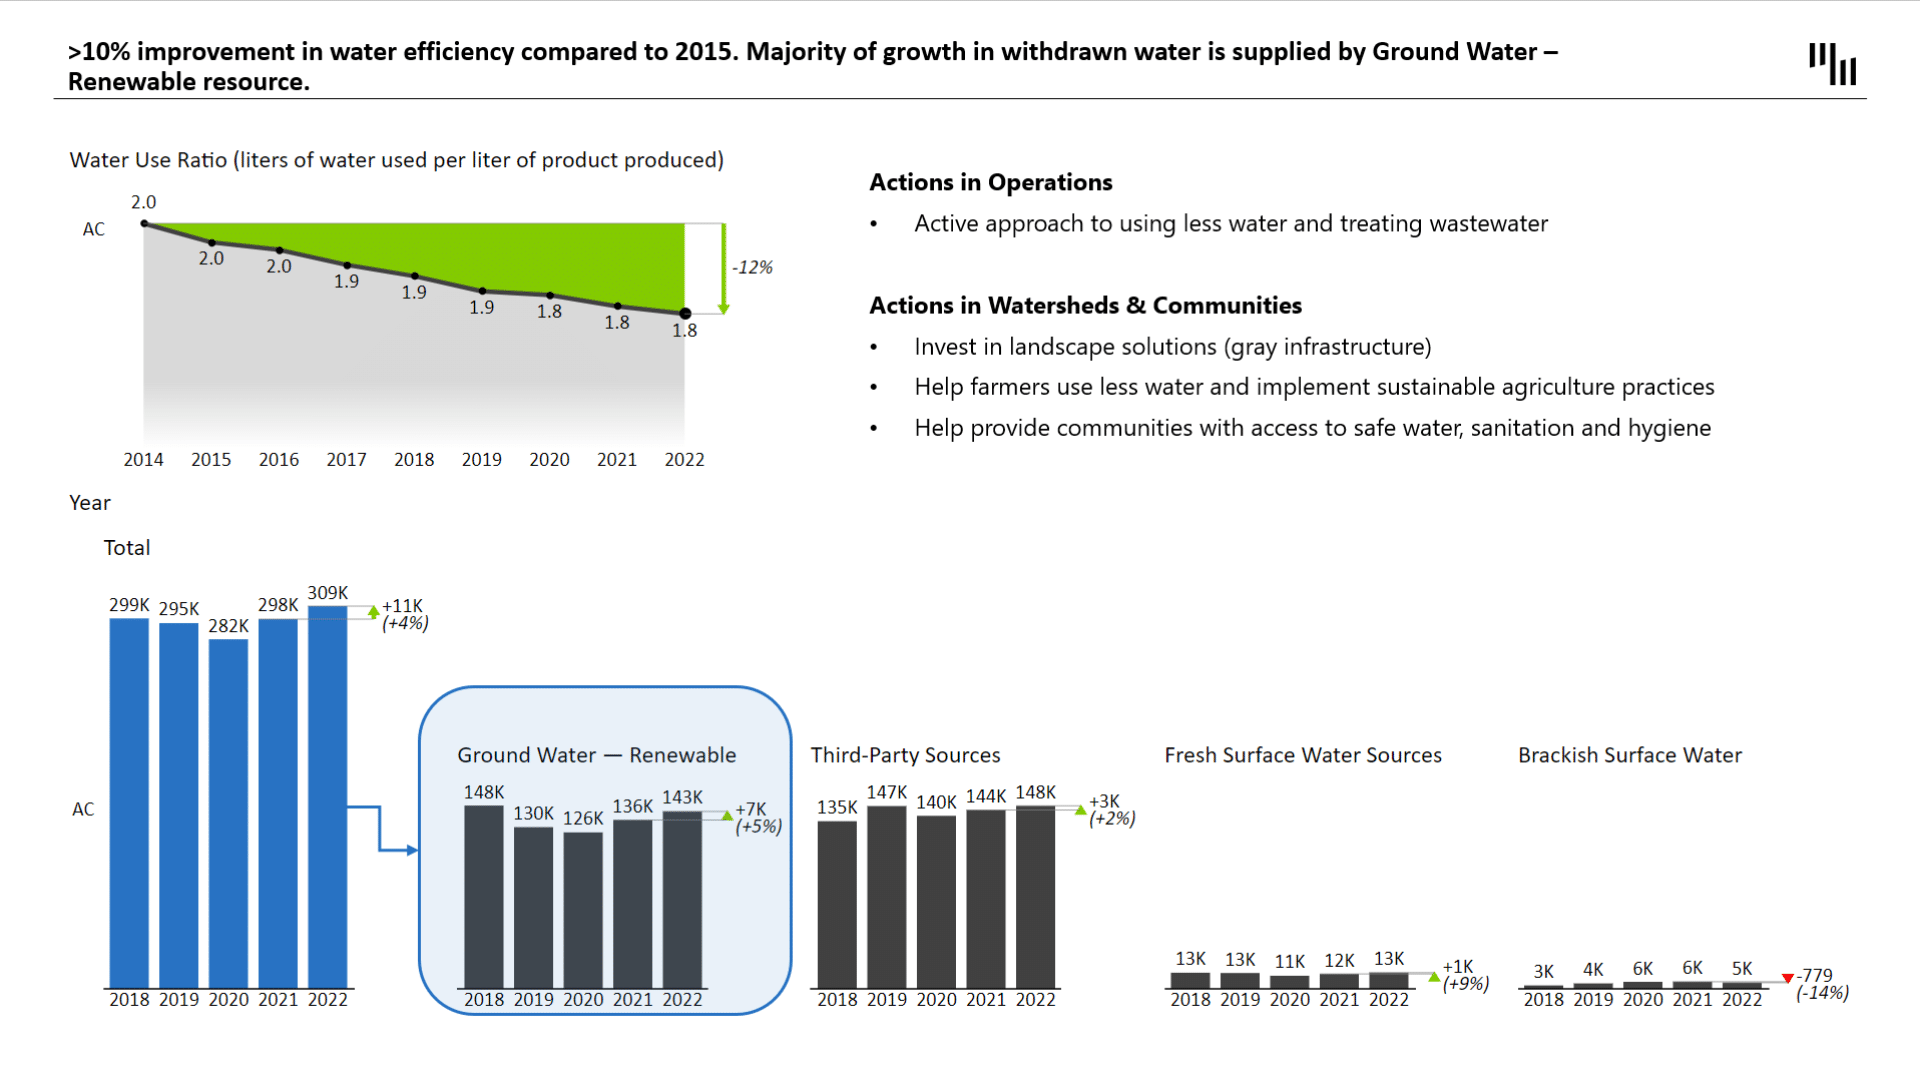
Insightful Overview of Sustainability Metrics
This template provides a comprehensive overview of sustainability metrics tailored for production companies. It showcases how a company effectively manages water resources to meet both business and community needs. This includes detailed processes for water withdrawal, water use rights, mitigating water risks, and replenishing water used across the system and value chain. By visualizing these critical elements, the template makes it easier to communicate complex sustainability efforts in a clear and engaging manner.
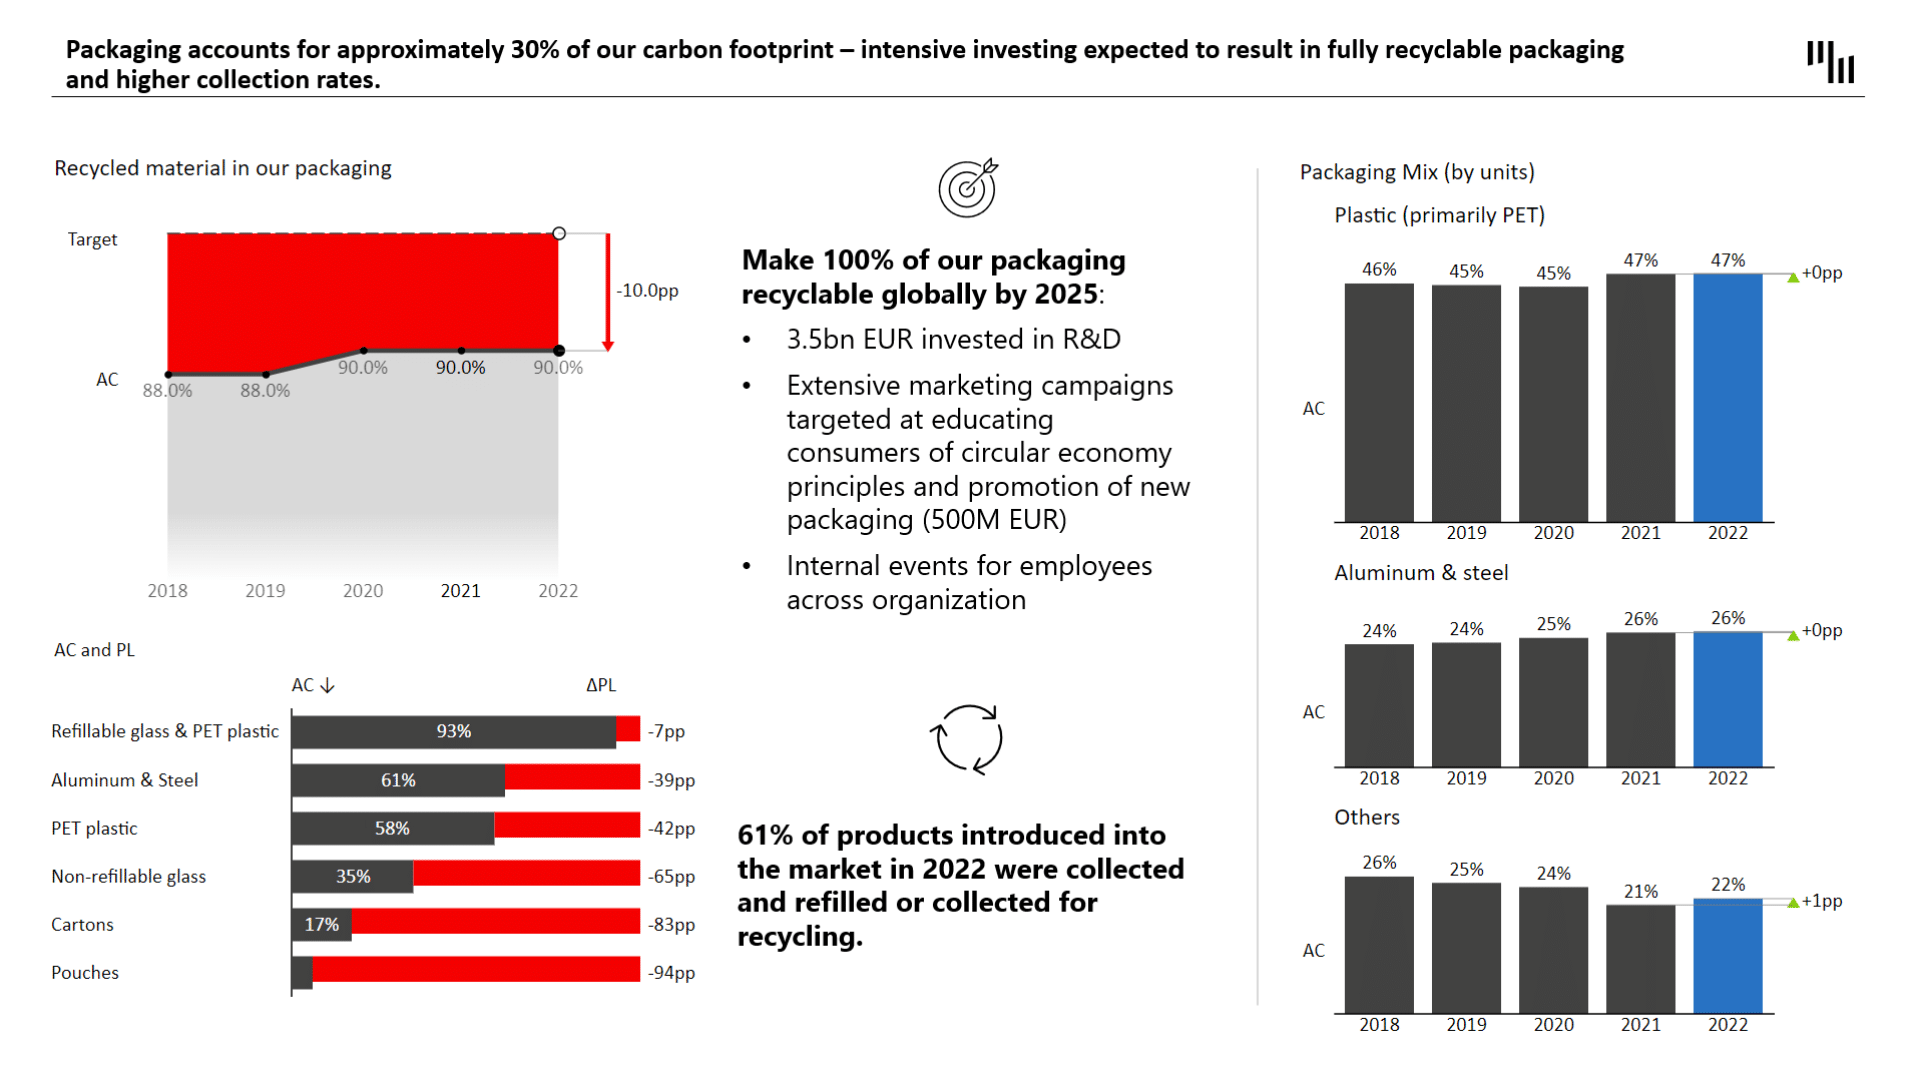
Addressing Greenhouse Gas Emissions and Climate Change
A key component of sustainability reporting is managing and mitigating greenhouse gas emissions. This template offers insights into how companies can align their operations with net-zero methodologies. It includes examples of transitioning to renewable energy, using alternative fuels, and enhancing energy efficiency through new equipment and processes. This extends to reducing the environmental footprint of buildings and facilities throughout their life-cycles. By providing a clear view of these efforts, the template aids in illustrating a company’s commitment to combating climate change.
Transform Your Sustainability Narrative
Revolutionize your approach to sustainability reporting with the sustainability report PowerPoint template from Zebra BI. Download this impactful tool, insert your data, and watch as it transforms your sustainability initiatives into powerful narratives. This template is more than a reporting tool—it's a strategic asset in showcasing your commitment to a sustainable future.