Back to Templates for PowerPoint
Last update:

PowerPoint Charts

Create stunning interactive presentations with 30+ advanced PowerPoint charts and tables in just seconds. Use your data to tell your company’s story in the easiest and most actionable way yet. This comprehensive slide deck will show you exactly how it works. Feel free to dive in and try it with your numbers.
Overview
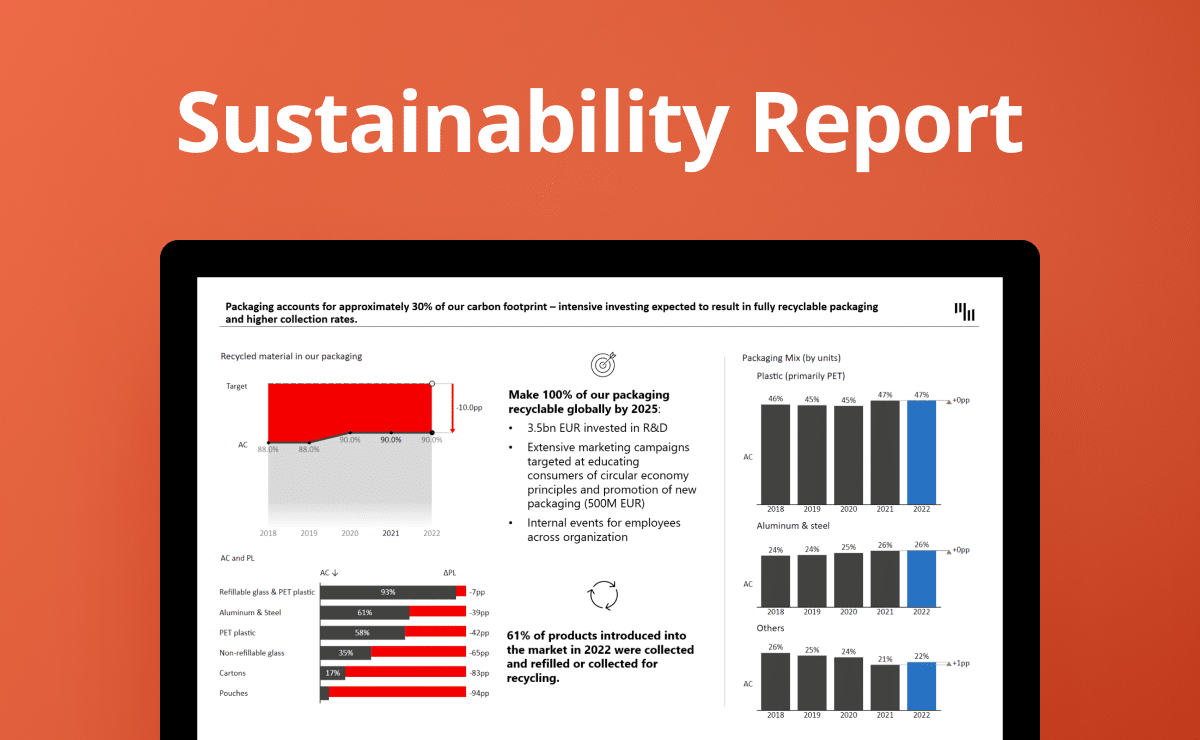
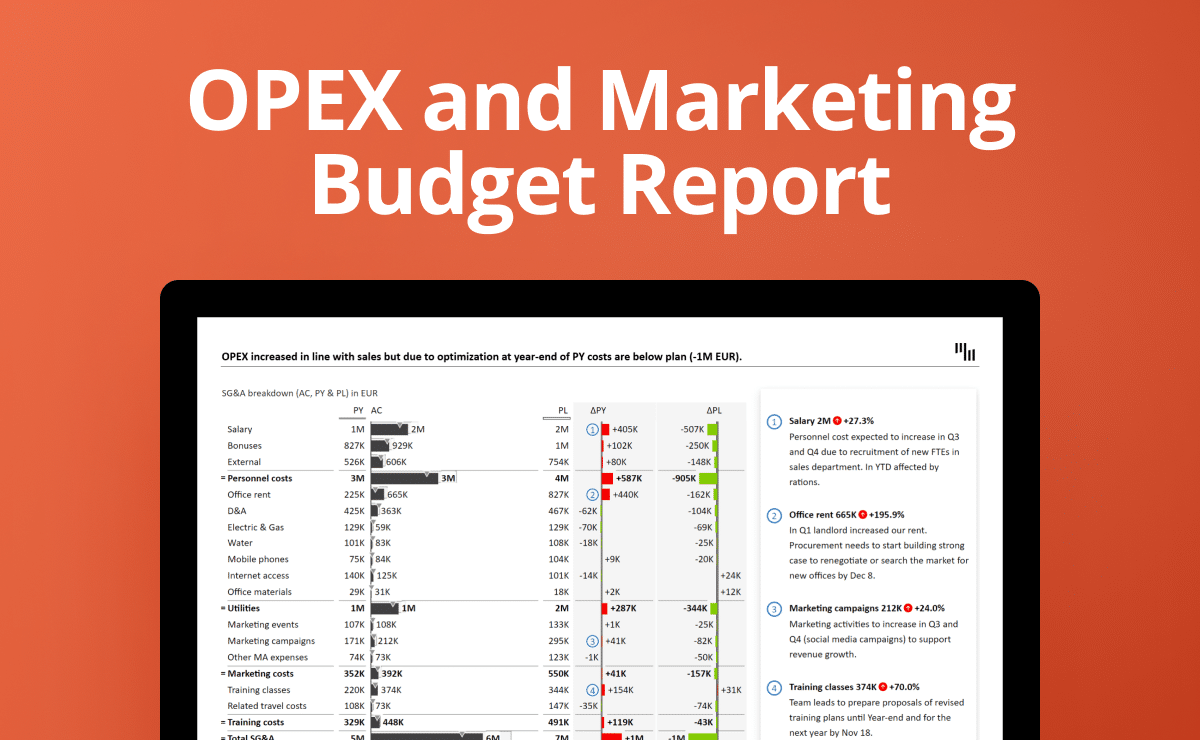
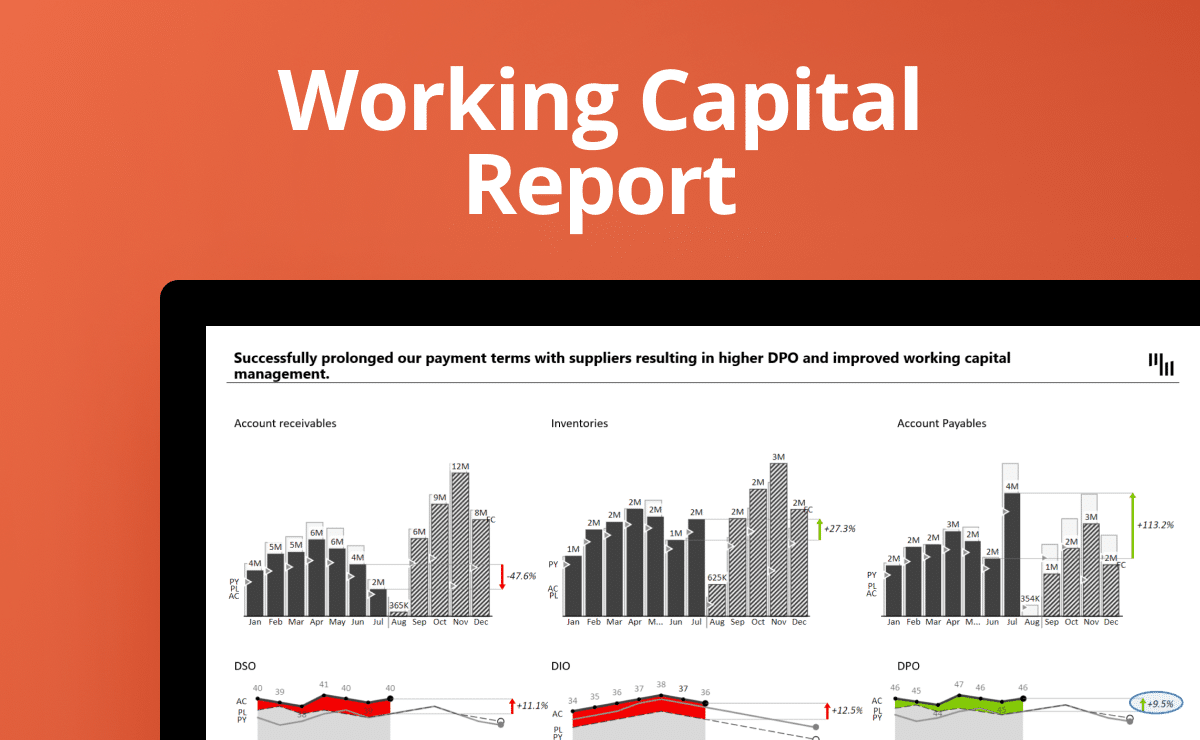
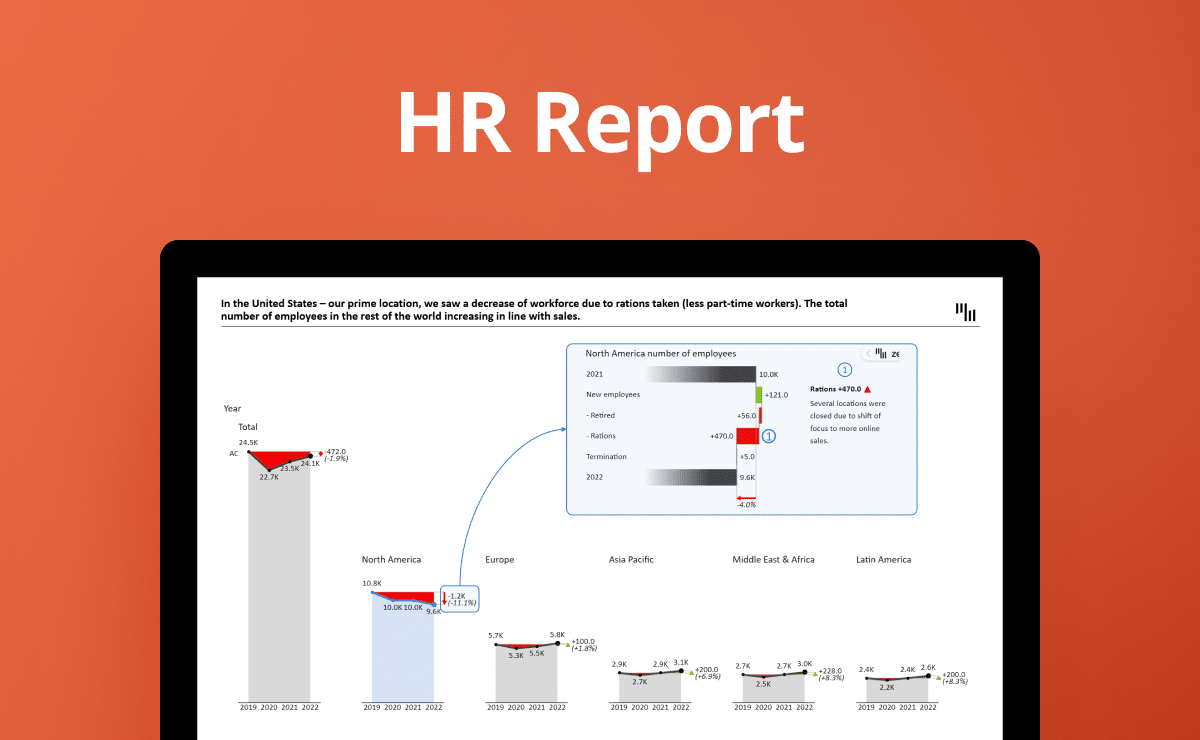
Take advantage of advanced PowerPoint charts and tables to convey your insights in a simple and effective way. Forget screenshotting your reports and adding static images to your slides. These charts enable you to create interactive business presentations right in your PowerPoint, and slide between different visualization types with just 1 click.

Create your slides with zero effort

Making business presentations in MS PowerPoint usually takes time and effort. Lots and lots of effort. Especially since its native charting options are so limited. But it doesn’t have to be this way. Zebra BI PowerPoint charts and tables come with automatic visualizations which save you tons of painstaking manual work. Use this slide deck to see just how easy it can be to create stunning, easy-to-understand slides – all in mere seconds of your time.

Deliver actionable insights fast

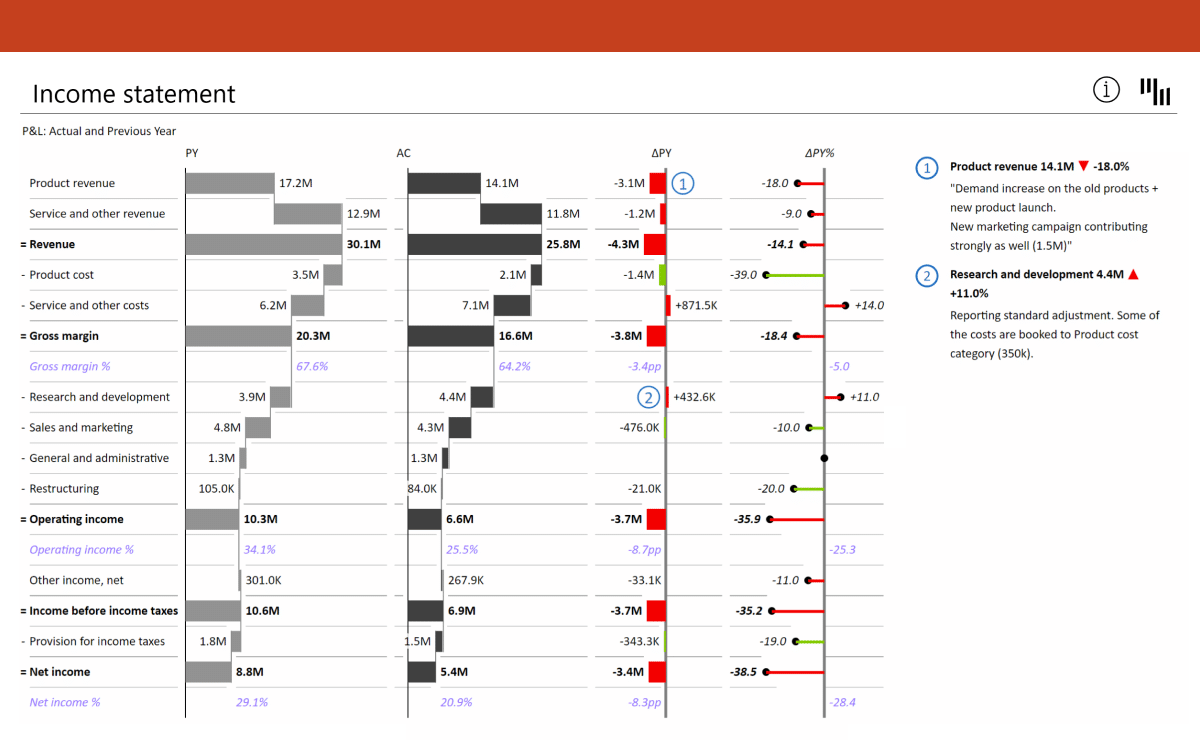
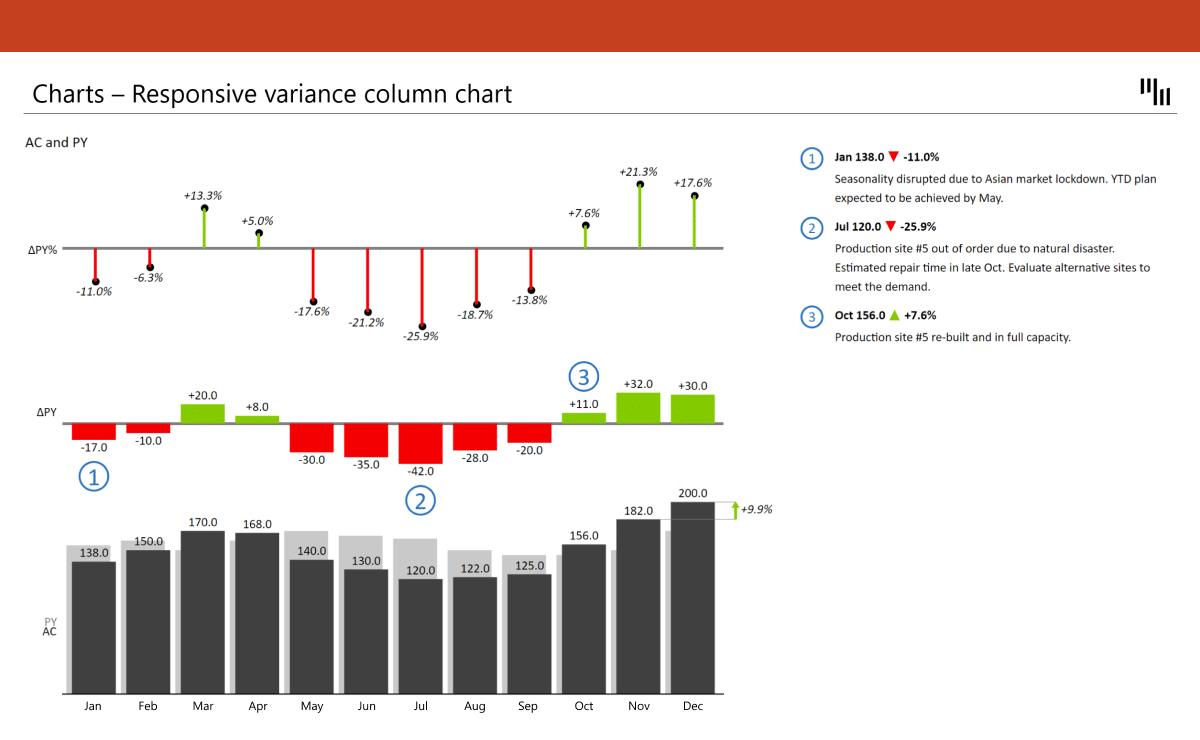
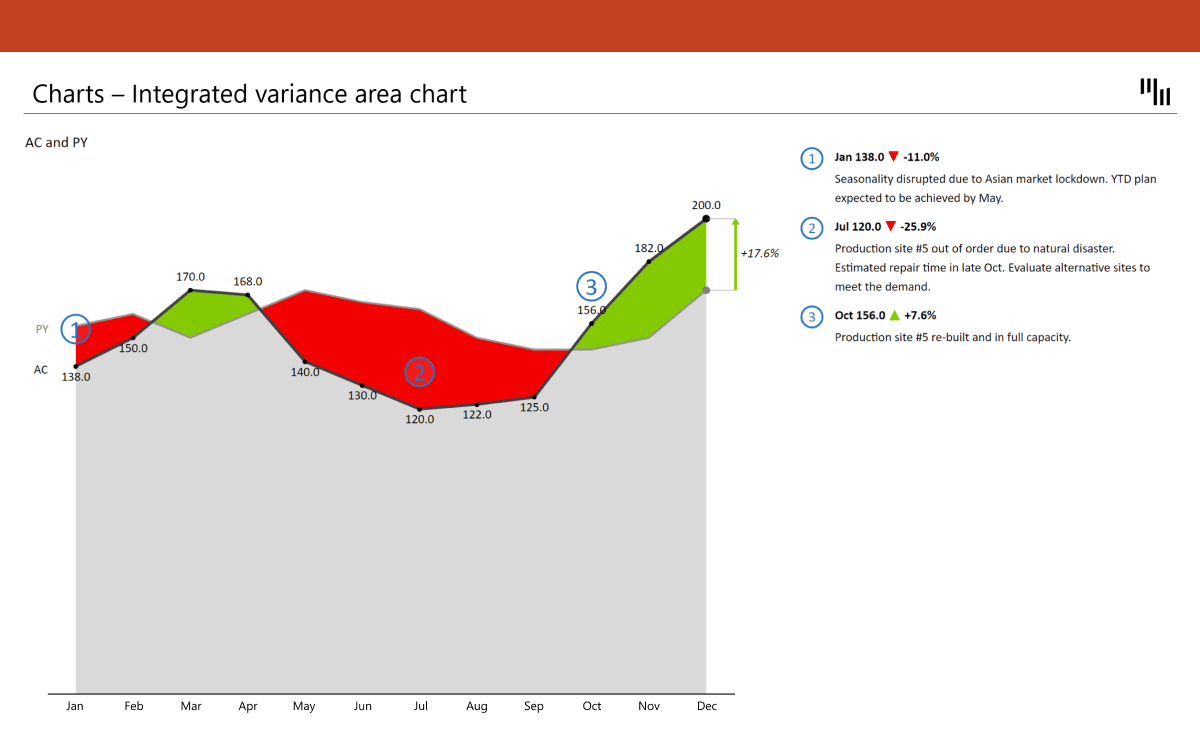
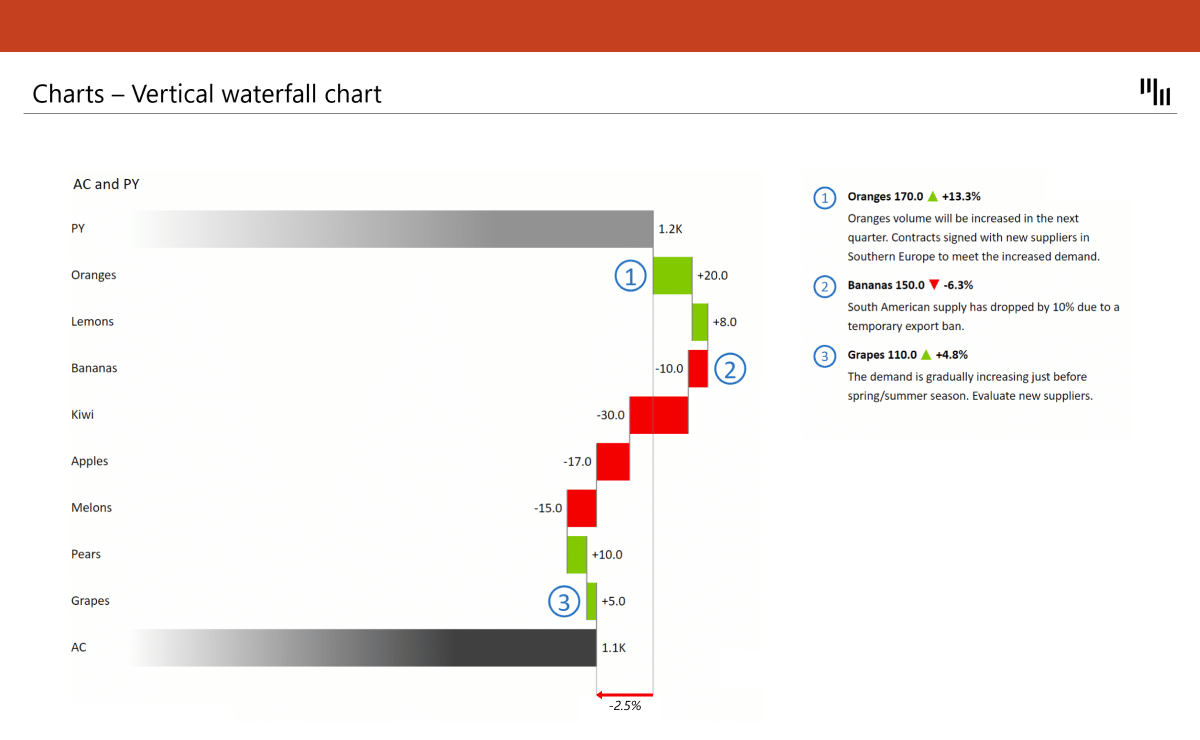
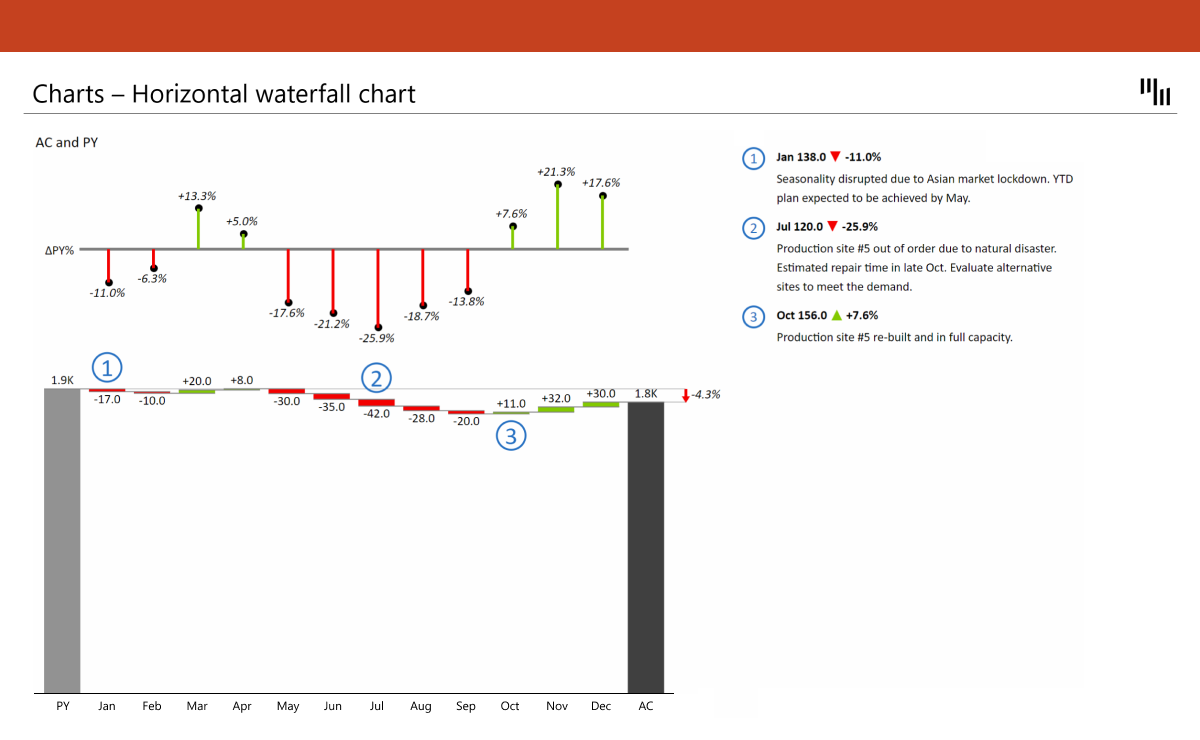
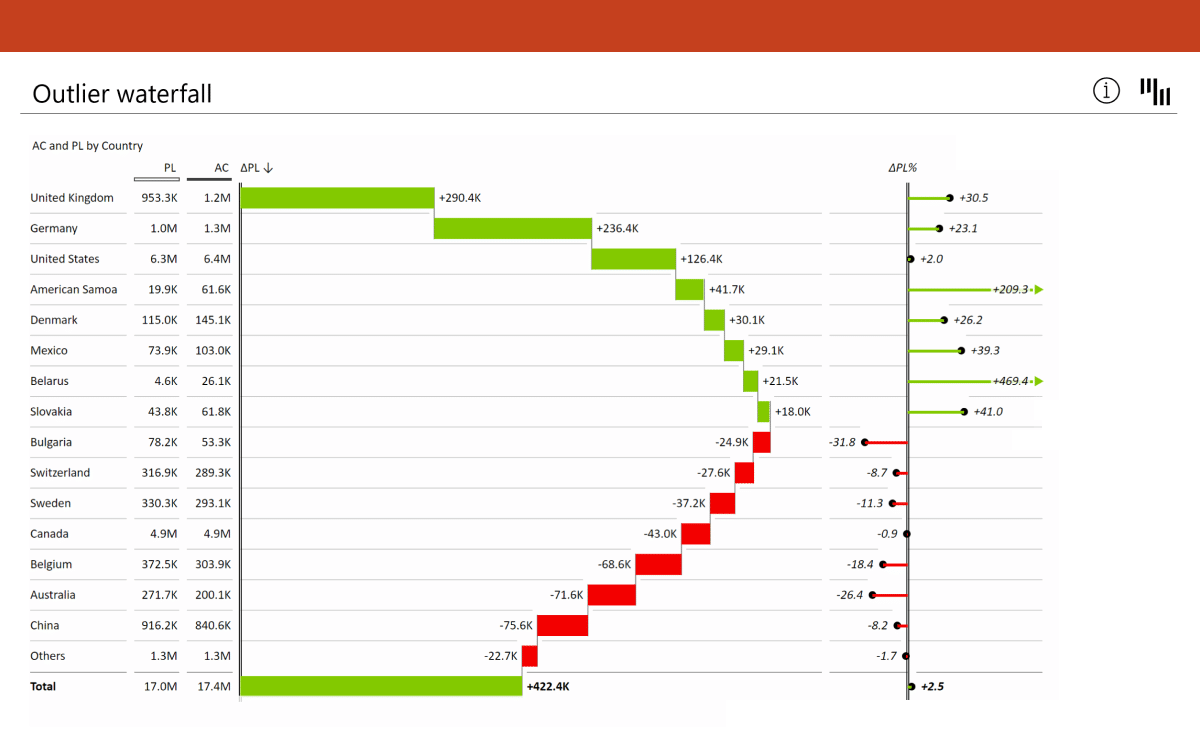
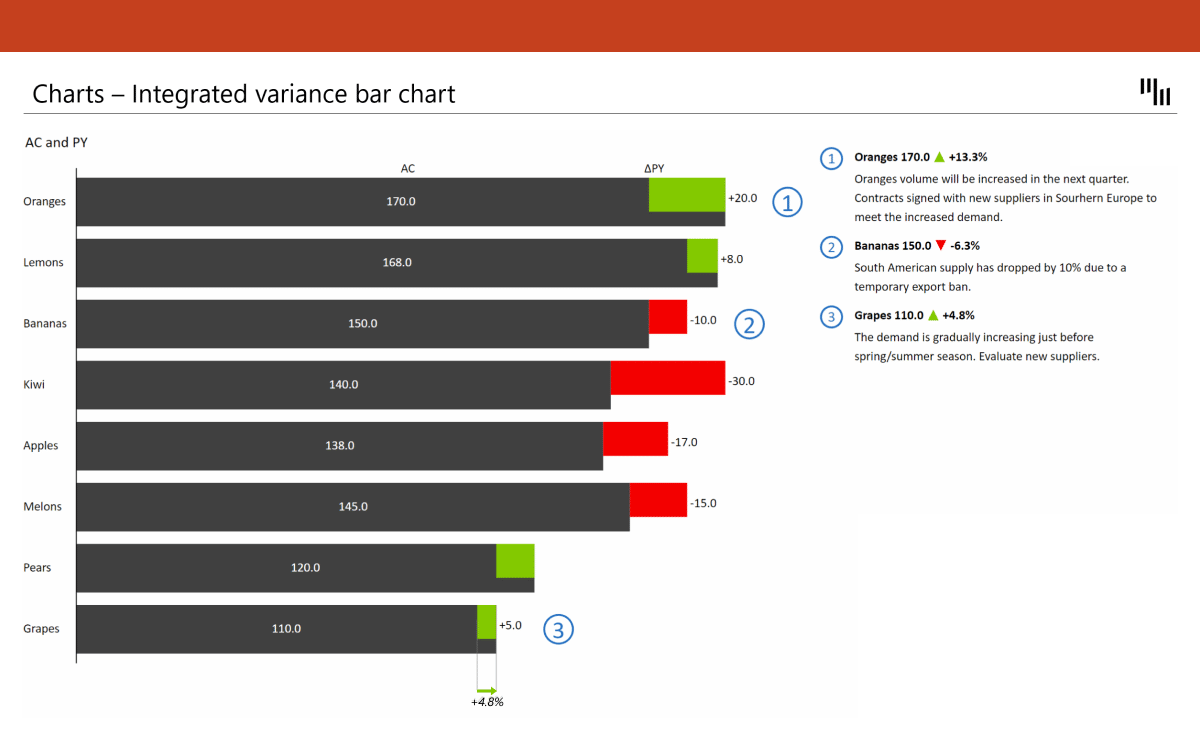
All Zebra BI PowerPoint charts and tables are IBCS-compliant out of the box. This means you can deliver actionable insights which your stakeholders can easily consume at just a glance. To this end, the interactive visuals include a number of advanced features, including automatically calculated variances and dynamic comments. These can help direct extra attention to your performance gaps and add some context to them.

Customize your presentations to match the story

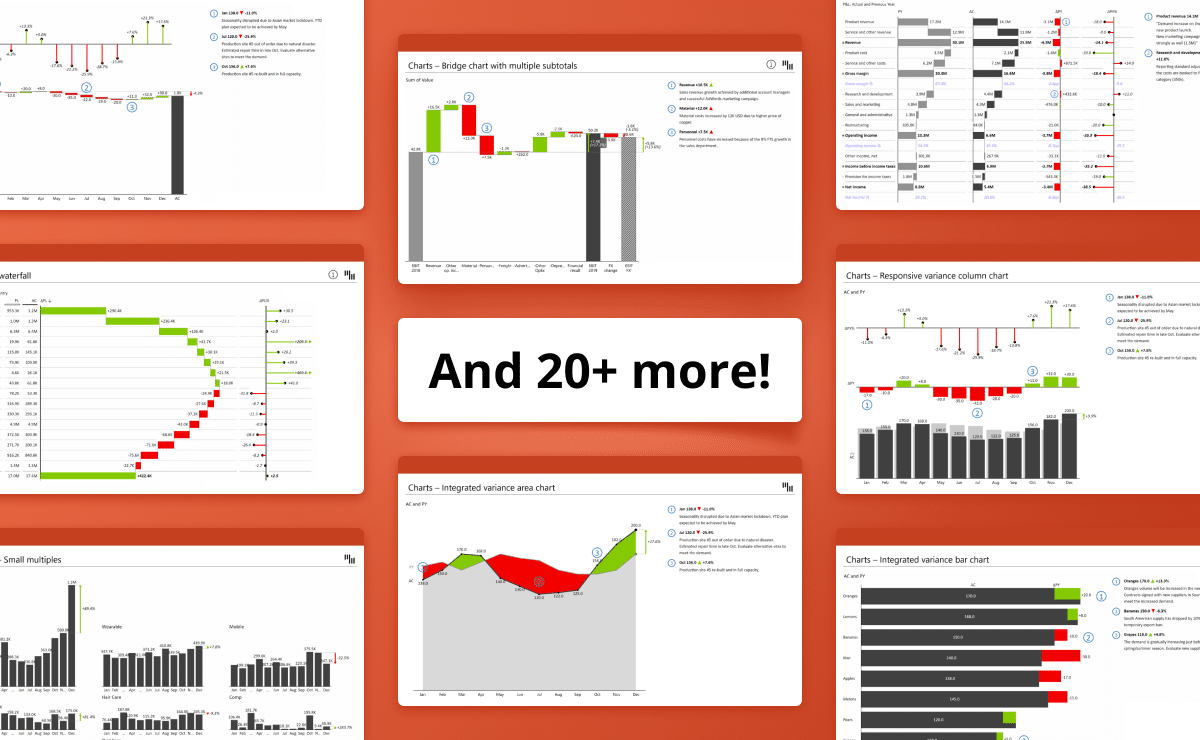
This slide deck includes over 30 different charting examples you can explore. They come with a wide range of customizable options which allow you to tailor the visualizations to your unique business needs. Change colors, fonts, layouts, and more to highlight your key data points and create a personalized presentation that fully reflects your brand.

Dive right in

Download the slide deck at the bottom of the page & see the variety of stunning PowerPoint charts and tables you can create in moments of your time. Want to add them to your business presentations? Here’s a sneak peek at how simple it is to insert them for free.
Features used
Advanced charts and tables with integrated charts (waterfall, bar, overlapped bar, pin)
Automatically calculated variances
Formula editor for calculating new data elements
Dynamic comments
Custom calculations (invert, result, skip)
Top N + Others
Up to 3 comparisons (plan, previous year and forecast)
Subtotal difference highlights
Other highlighting options
Creating game-changing business presentations has never been so easy. Explore the feature-rich charting options to get inspired & try it with your data.
Download this template

More professionally-designed templates to use

Contribution Margin Analysis Excel Template
Gross Sales vs Net Sales Excel Report Template
Basic
Financial Forecasting and Planning: Profit & Loss Overview Excel Template
Adjusted EBITDA template and adjusted income statement example created with Zebra BI for Excel
Basic
Adjusted EBITDA Template & Adjusted Income Statement Example for Excel
Basic
Long-Term Assets and CapEx Report Excel Template
Basic
Cash Flow Statement from Pivot Table (Hierarchical)
Intermediate
Break-Even Analysis Template for Excel
Intermediate
Working Capital Analysis Template in Excel
Intermediate
Sales variance analysis report templates for Excel
income statement template excel afi
Intermediate
Basic
Income statement templates for Excel
Advanced
Consolidated financials dashboard in Excel
Intermediate
Sales variance report with multiple levels
Intermediate
Sales overview report in Excel
Advanced
Sales dashboard in Excel
Intermediate
Revenue-cost-profit analysis
Intermediate
Inventory report
Intermediate
Quarterly income statement
Basic
Income statement with multiple levels
Basic
Balance sheet template for Excel
Basic
Subscription business model analysis in Excel
Basic
Marketing budget variance analysis in Excel
Basic
Income statement (bridge chart) in Excel
Intermediate
Price-Volume-Mix variance analysis in Excel
Basic
EBIT contribution analysis in Excel
Basic
Cash Flow Statement template
Basic
Income statement in Excel (PY-AC-PL-FC)
Basic
Income statement in Excel (PY-AC-PL)
Basic
Income Statement in Excel (PY-AC) and (AC-PL)
Basic
Cost Variance Table in Excel (PY-AC-FC-PL)
Basic
Cost Variance Table in Excel (PY-AC-PL)
Basic
Cost Variance Table in Excel (PY-AC and AC-PL)
Intermediate
Monthly Sales Variances in Excel (PY-AC-FC-PL)
Intermediate
Monthly Sales Variances in Excel (AC-FC-PL)
Intermediate
Monthly Sales Variances in Excel (AC-PY-PL)
Intermediate
Monthly Sales Variances in Excel (PY-AC and AC-PL)
Basic
Sales Variance Table in Excel (PY-AC-FC-PL)
Basic
Sales Variance Table in Excel (PY-AC-PL)
Basic
Sales variance table in Excel (PY vs. AC and AC vs. PL)