Back to Templates for PowerPoint
Last update:

Sales Report PowerPoint Charts

Make easily digestible sales presentations with advanced sales report PowerPoint charts in no time. Use them to effortlessly present the story behind your data & facilitate further decision-making.
Overview
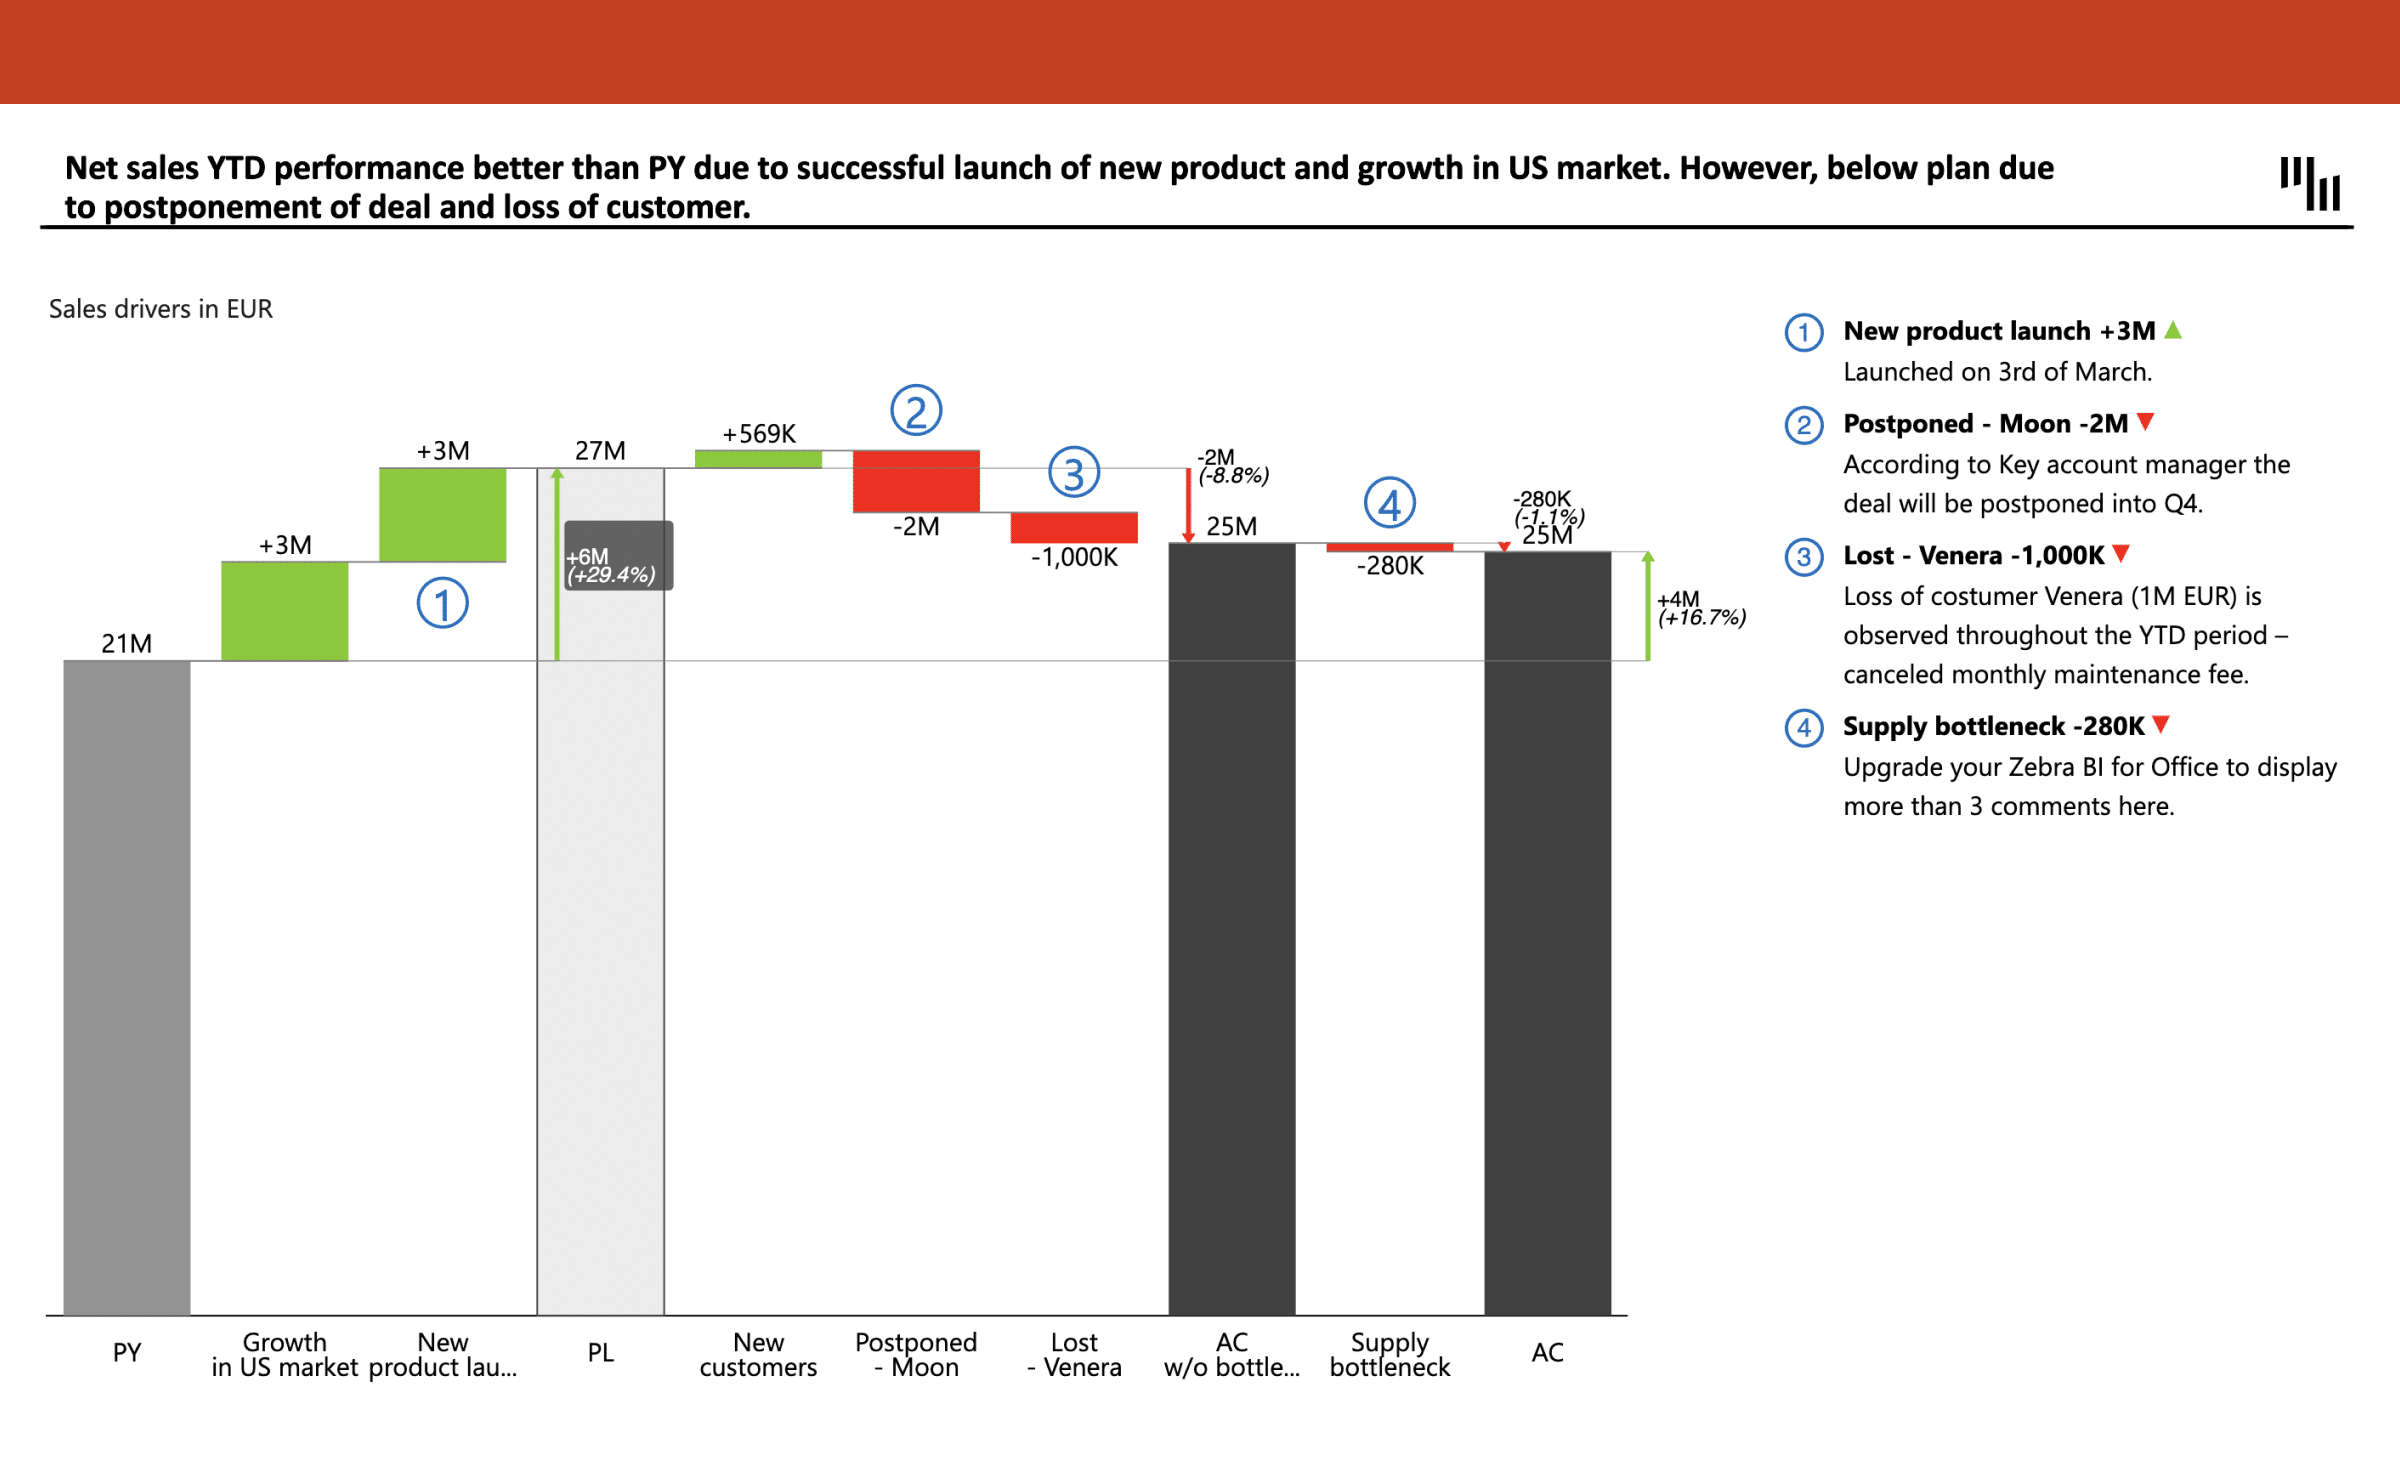
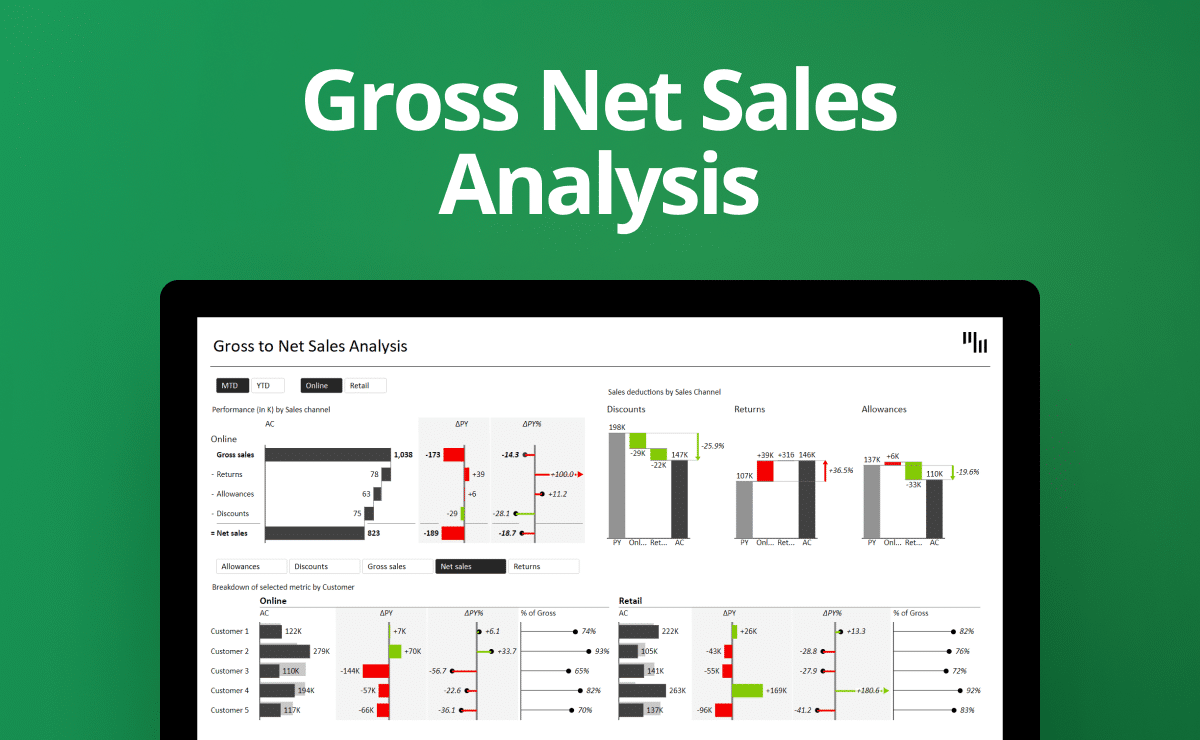
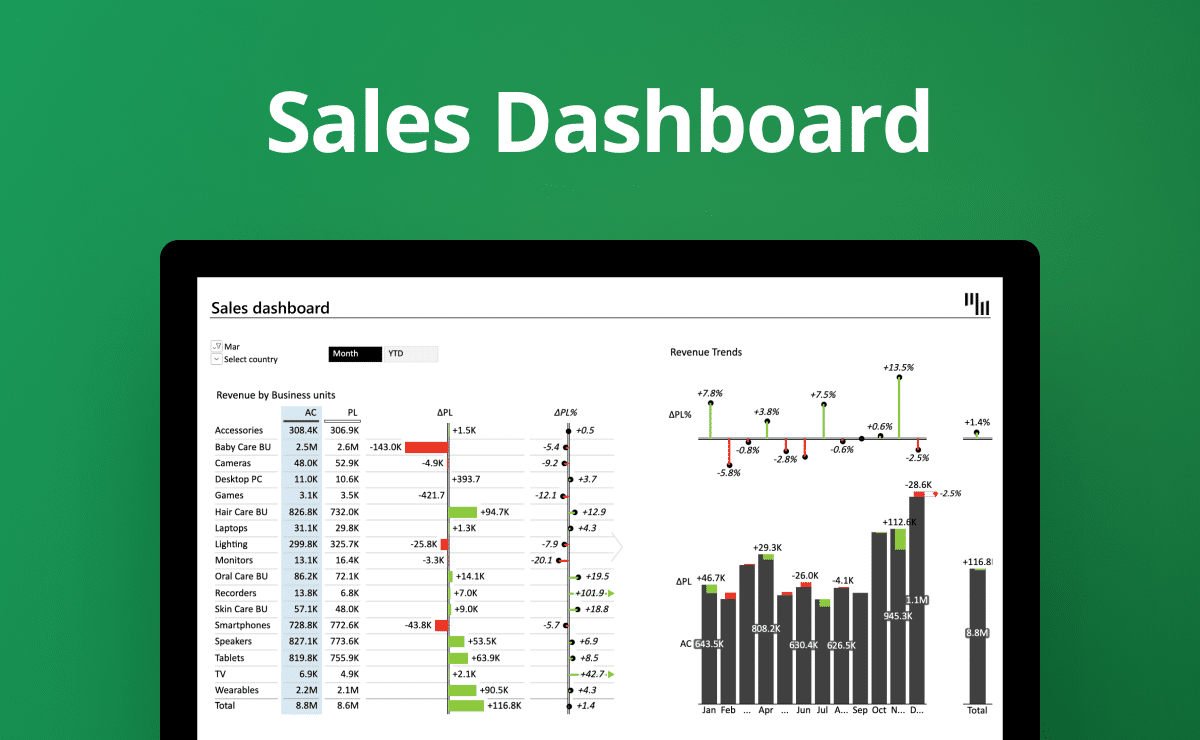
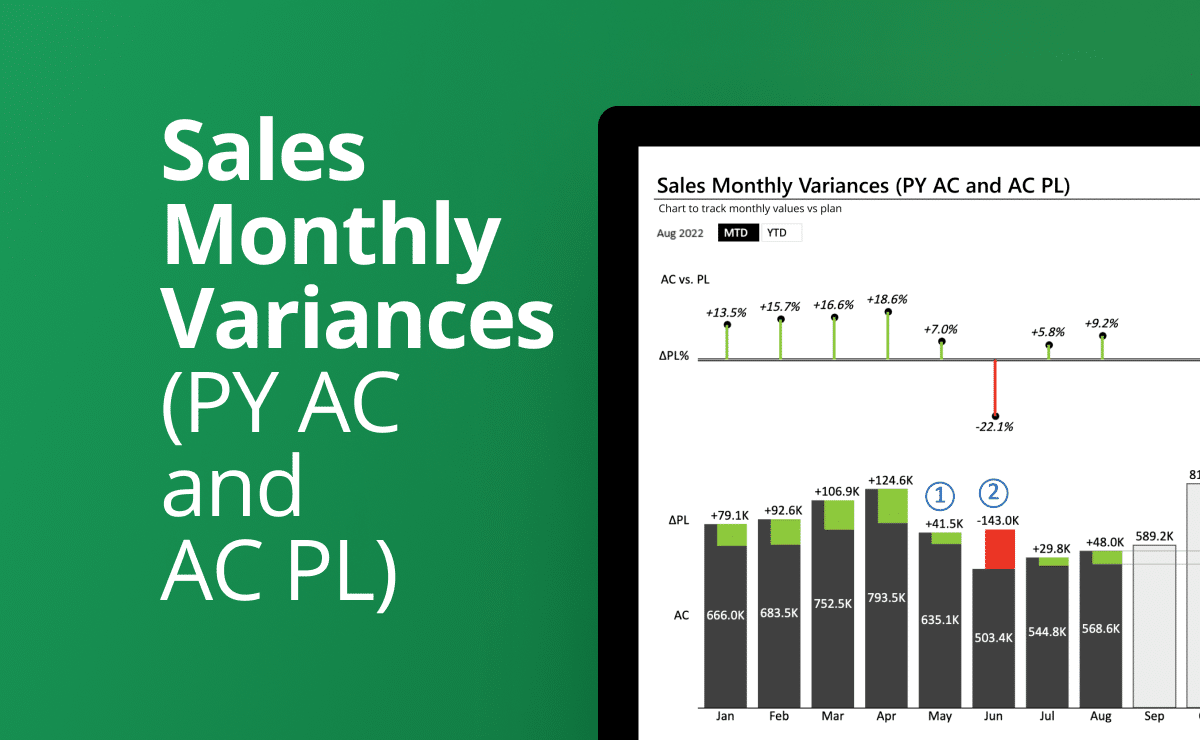
Sales reports are important, but their biggest power lies in how you present them to your stakeholders. Zebra BI Sales Report PowerPoint charts breathe life into these data narratives, transforming them into captivating stories. Use them to showcase your sales performance with striking, easily digestible visualizations, including waterfall charts and small multiples, for data-driven decisions that truly resonate. Step into a new era of sales report presentations with powerful, interactive charts created with Zebra BI for PowerPoint.

Get an unrivalled lens into your sales landscape

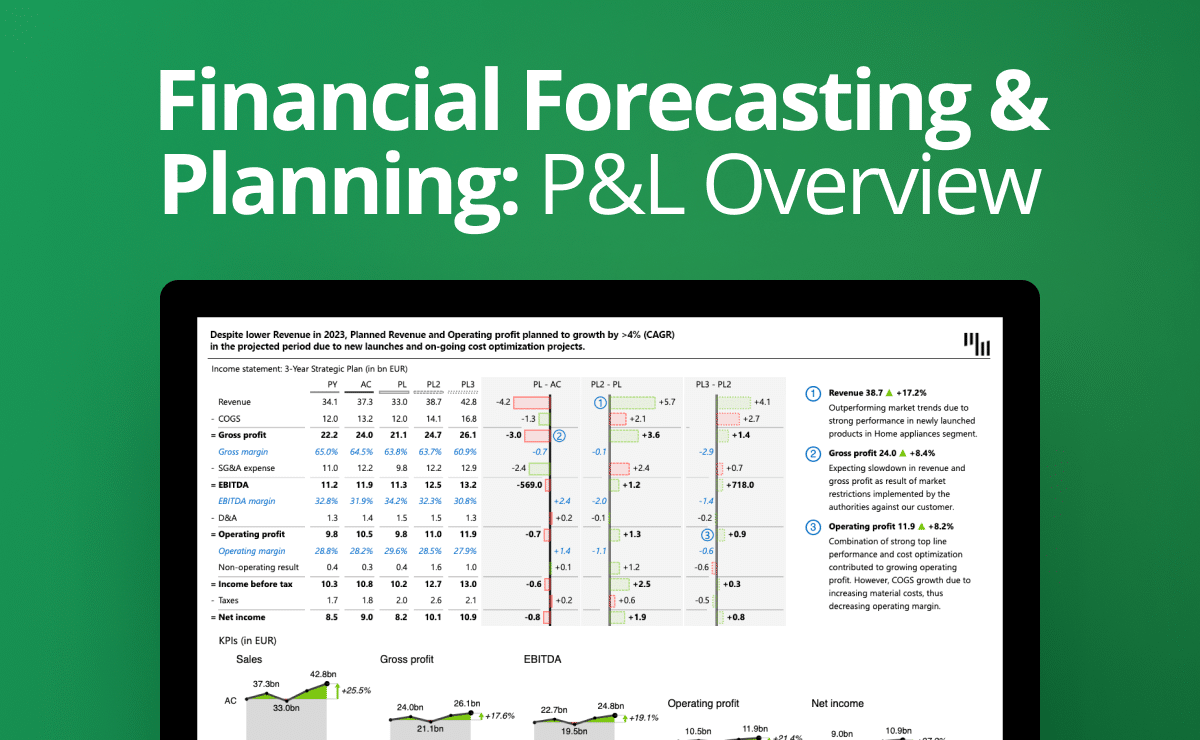
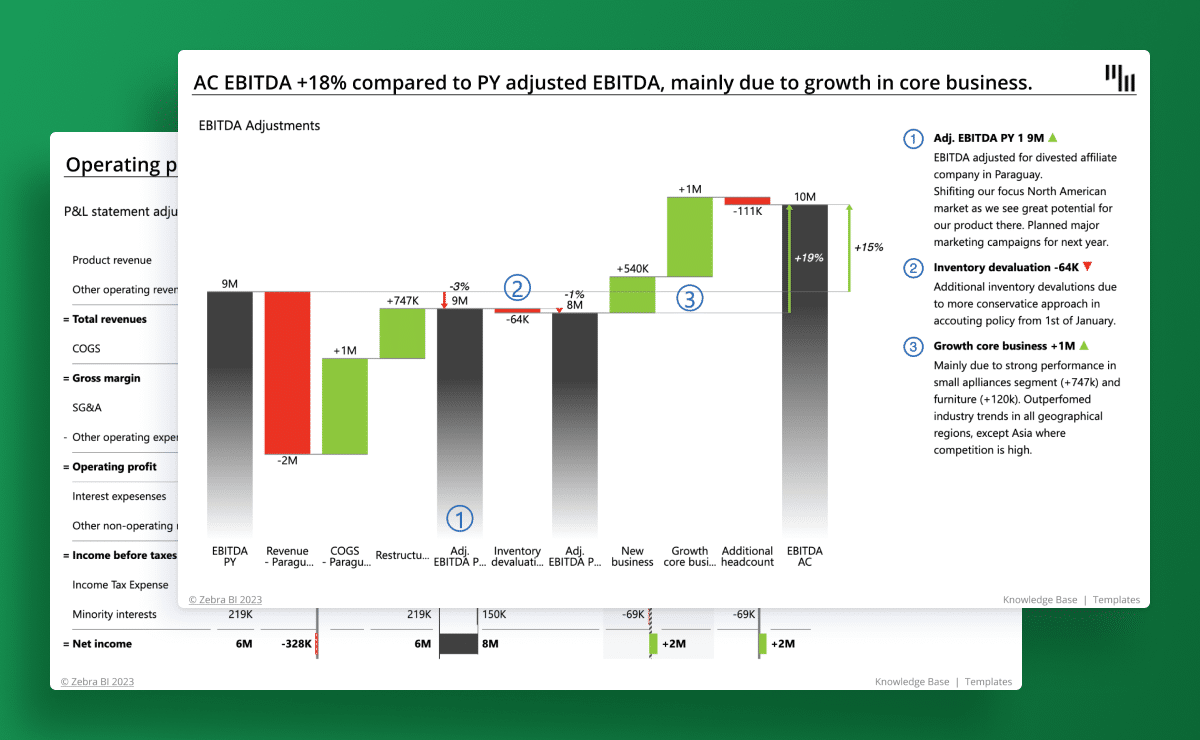
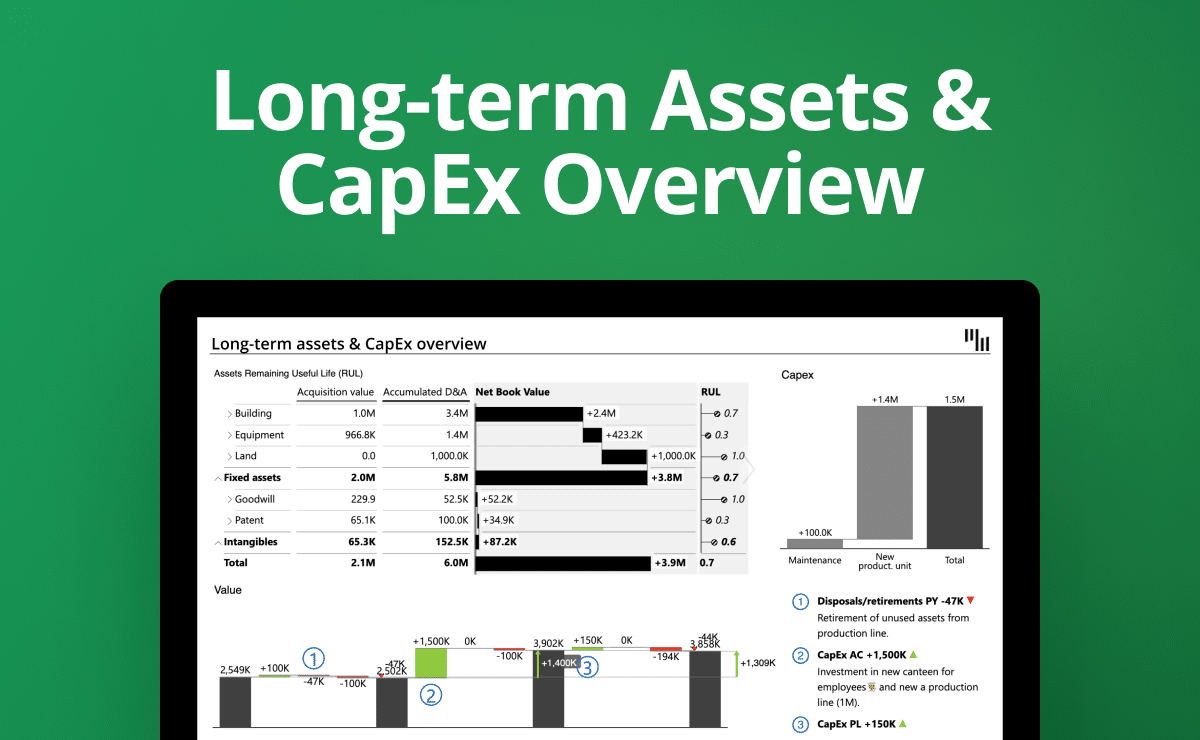
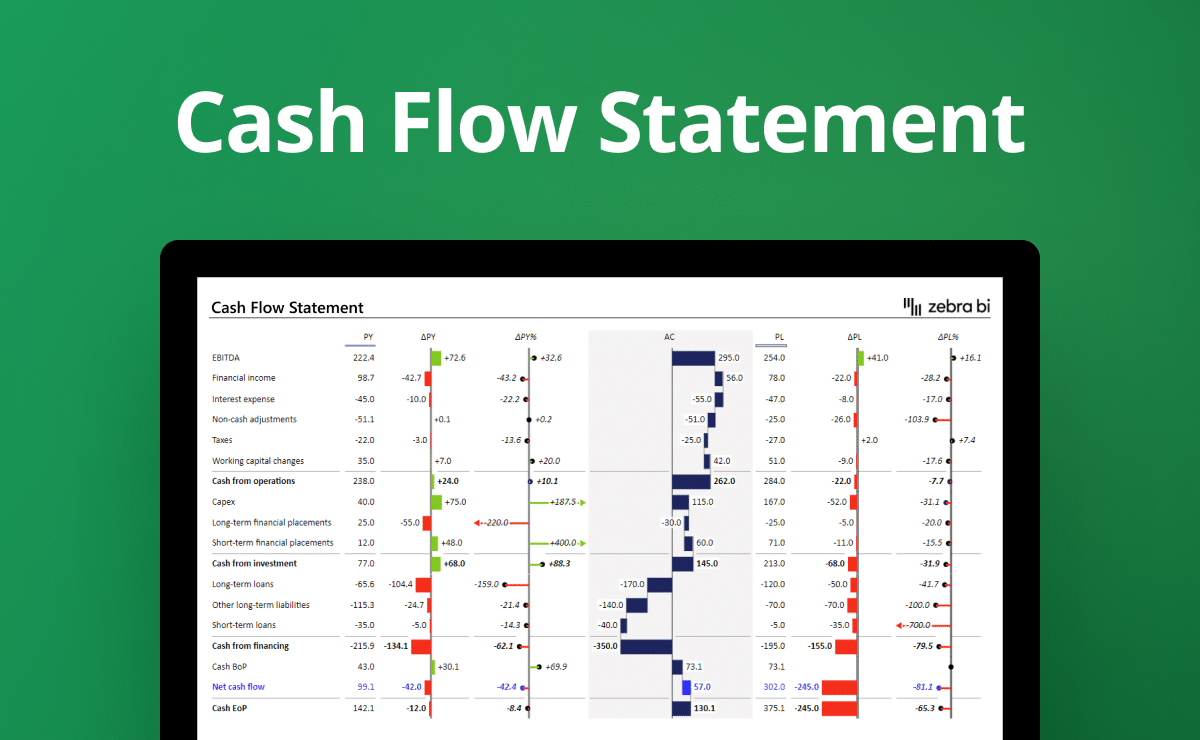
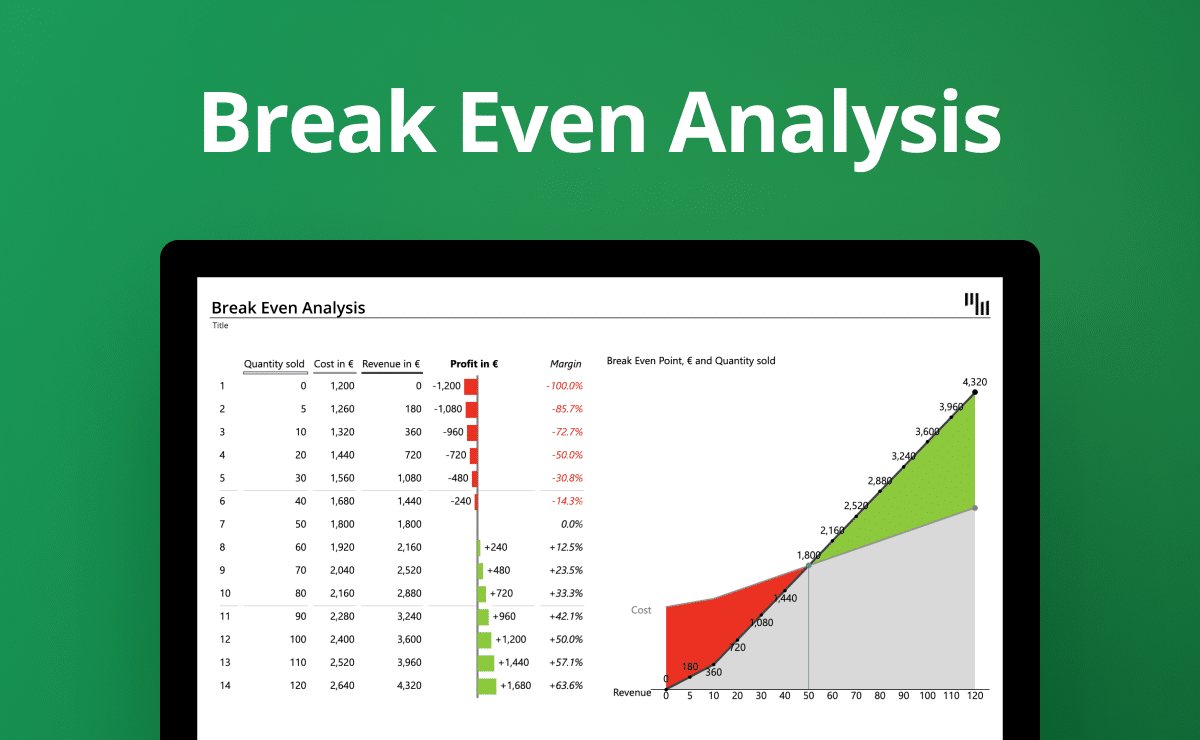
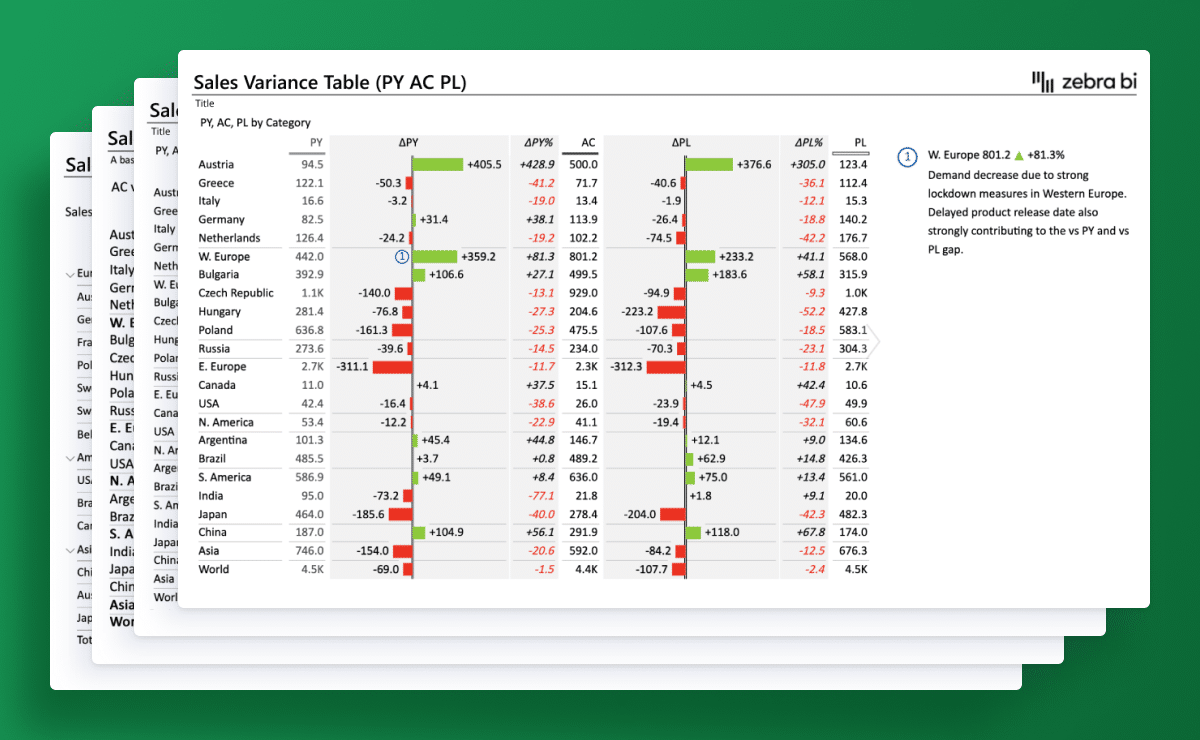
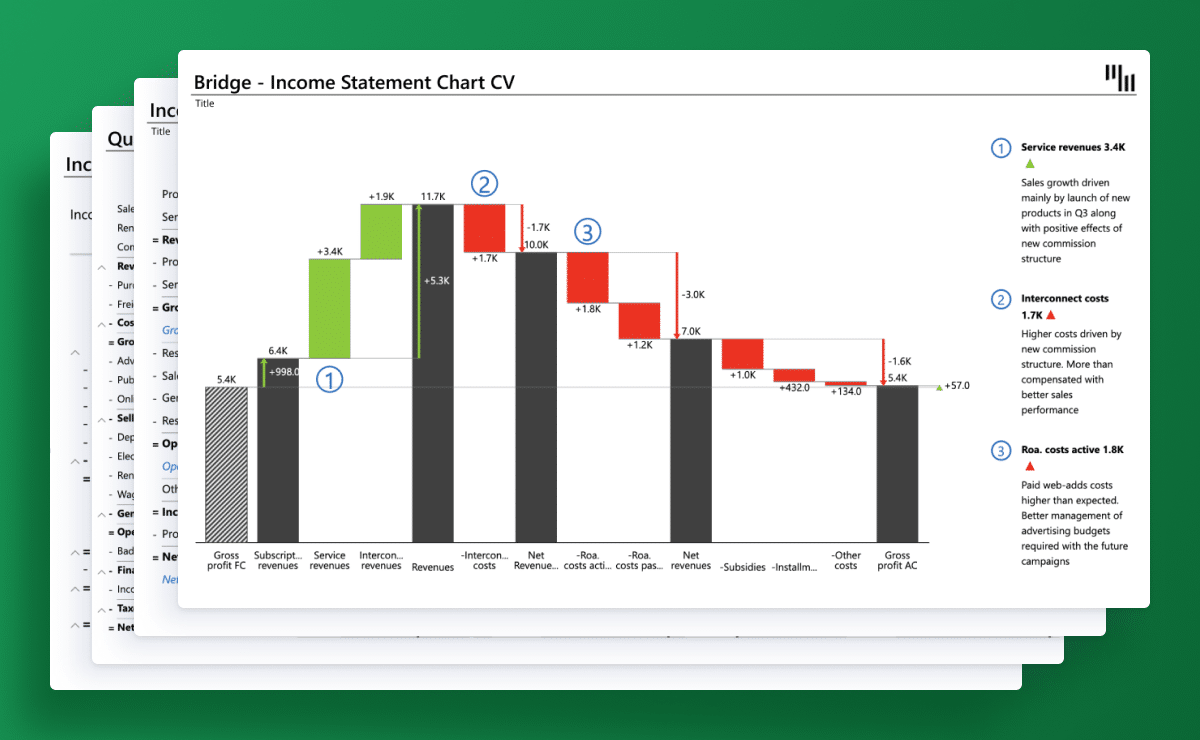
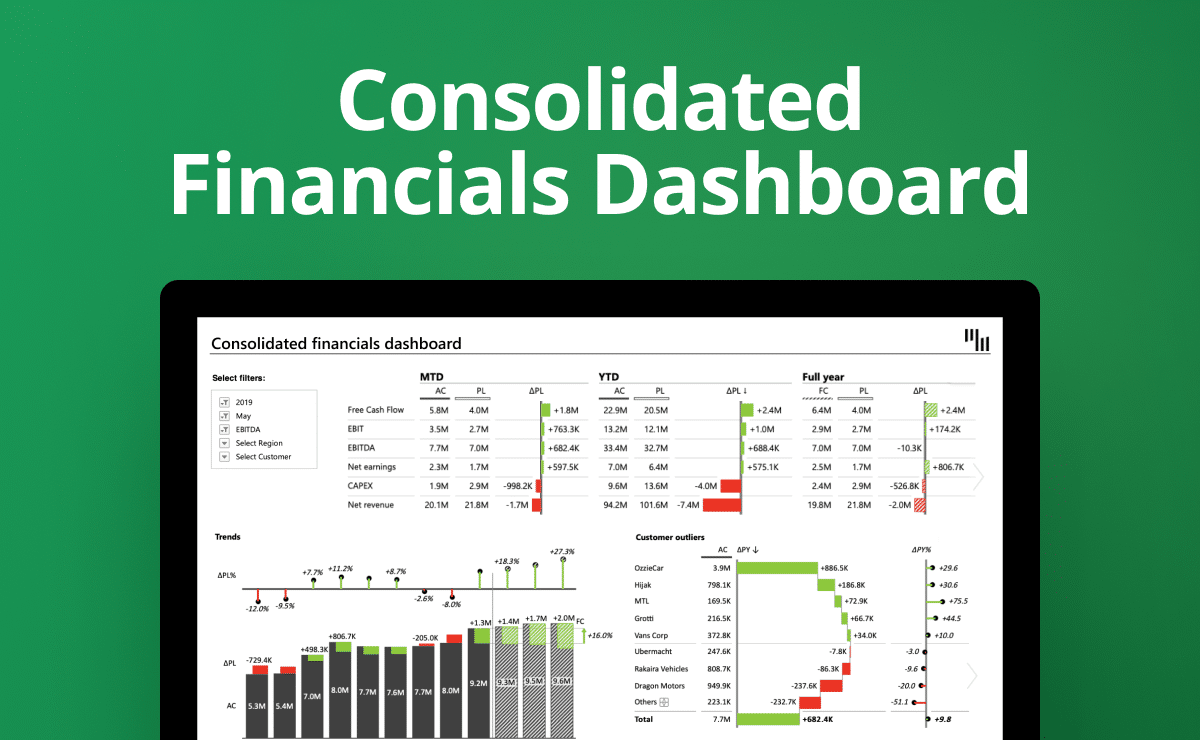
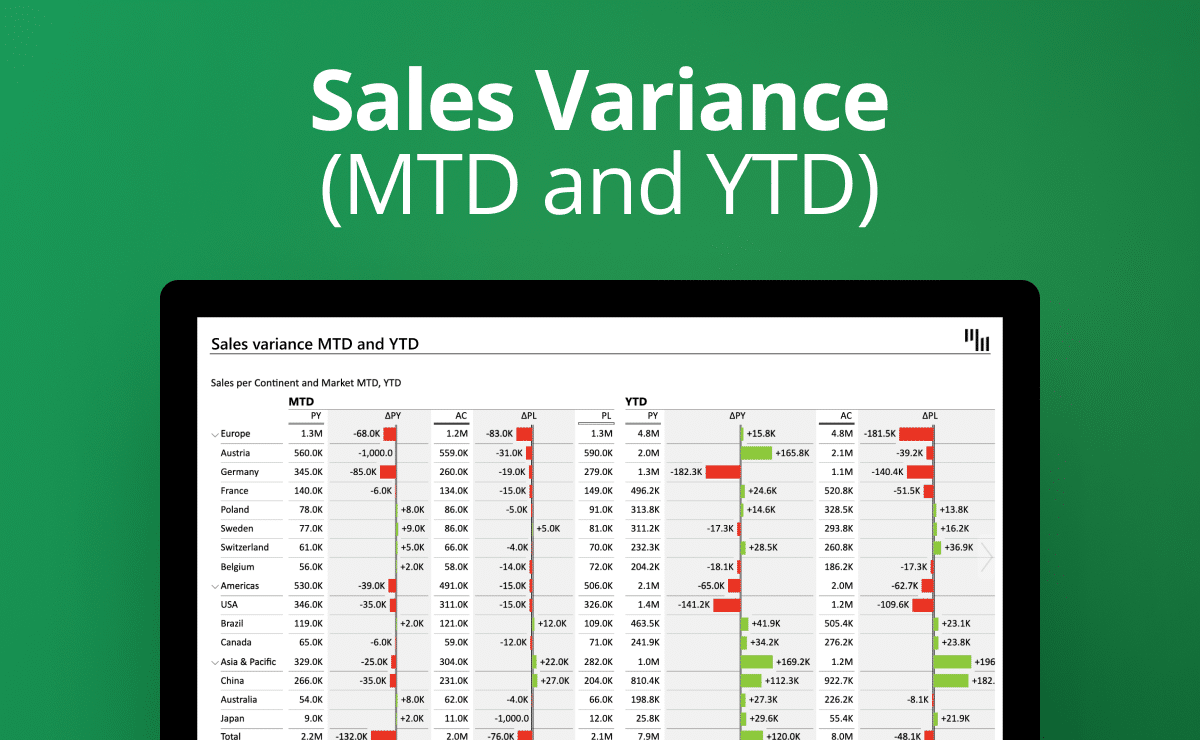
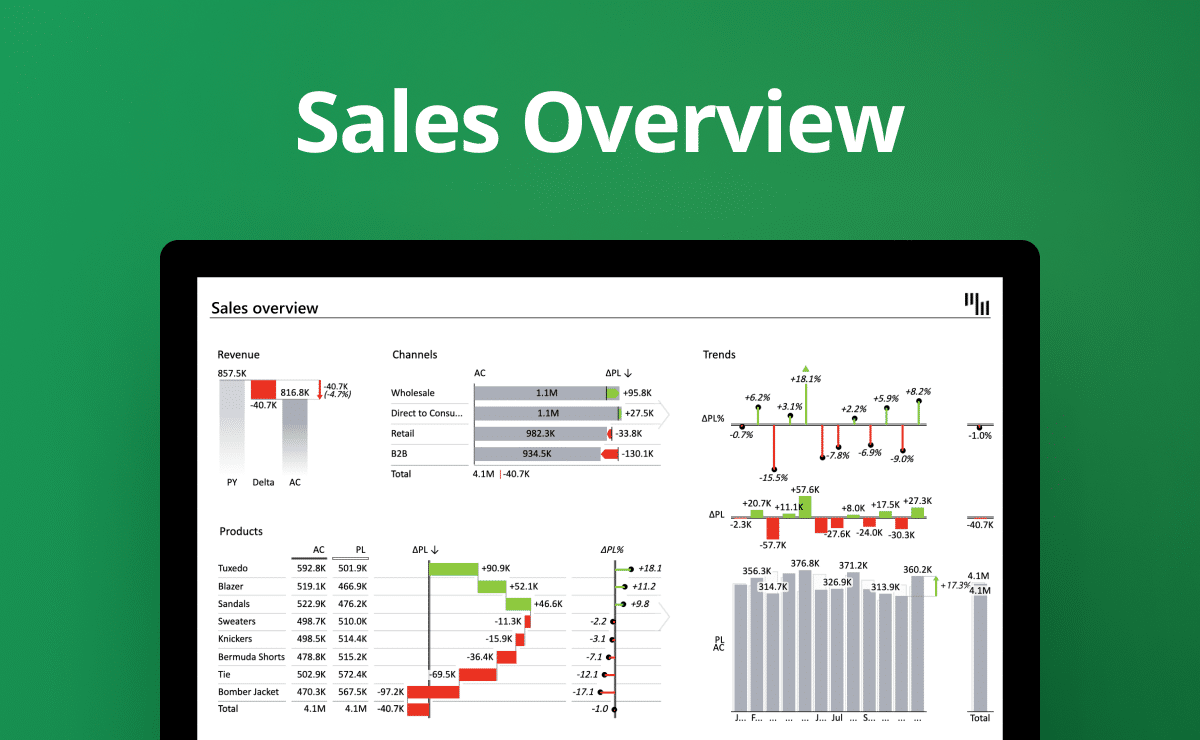
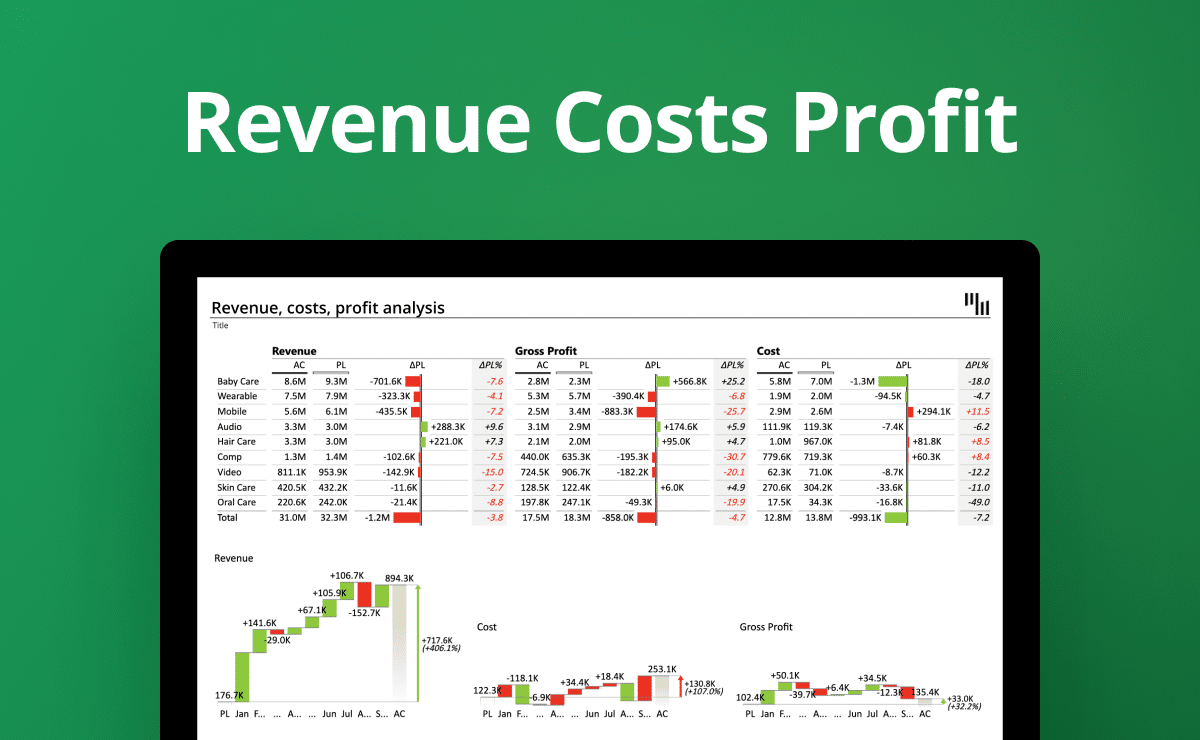
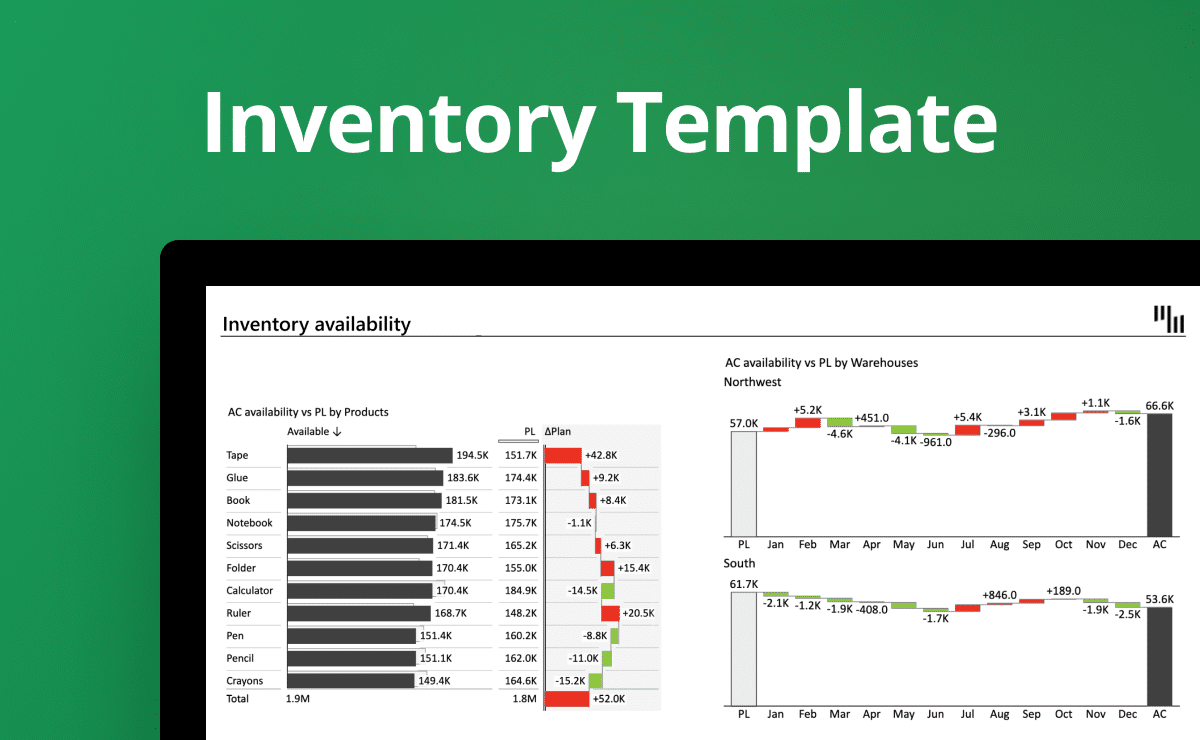
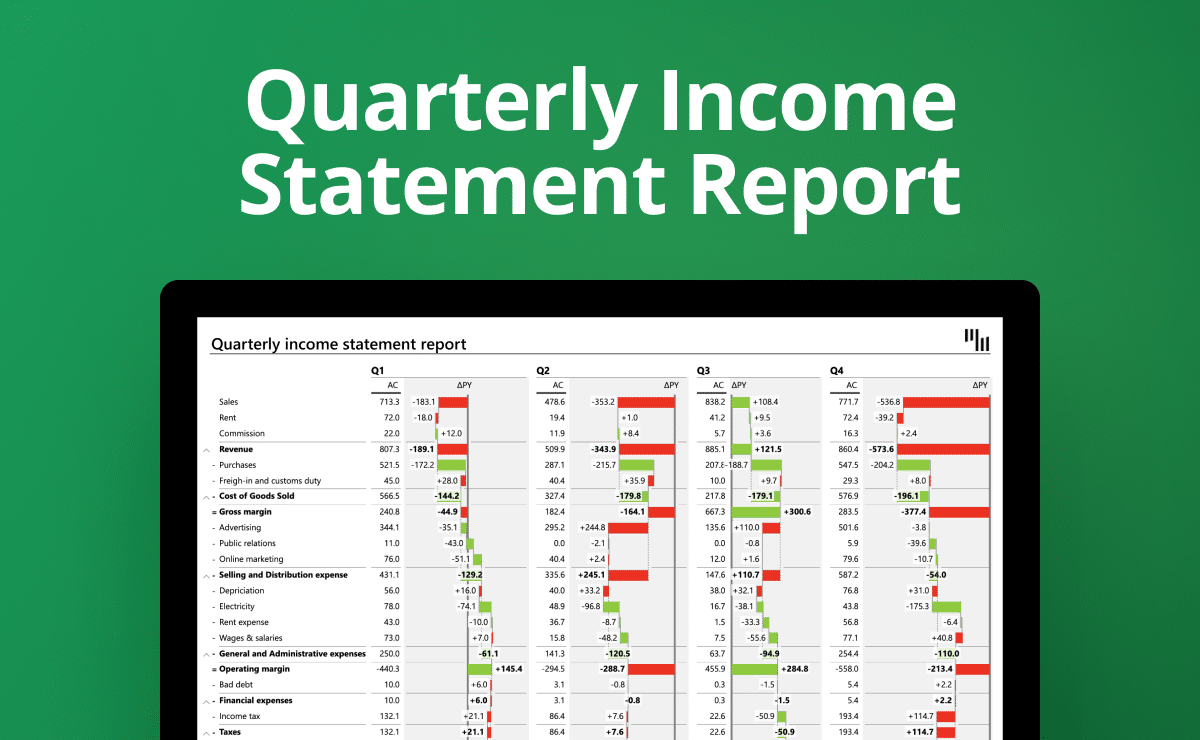
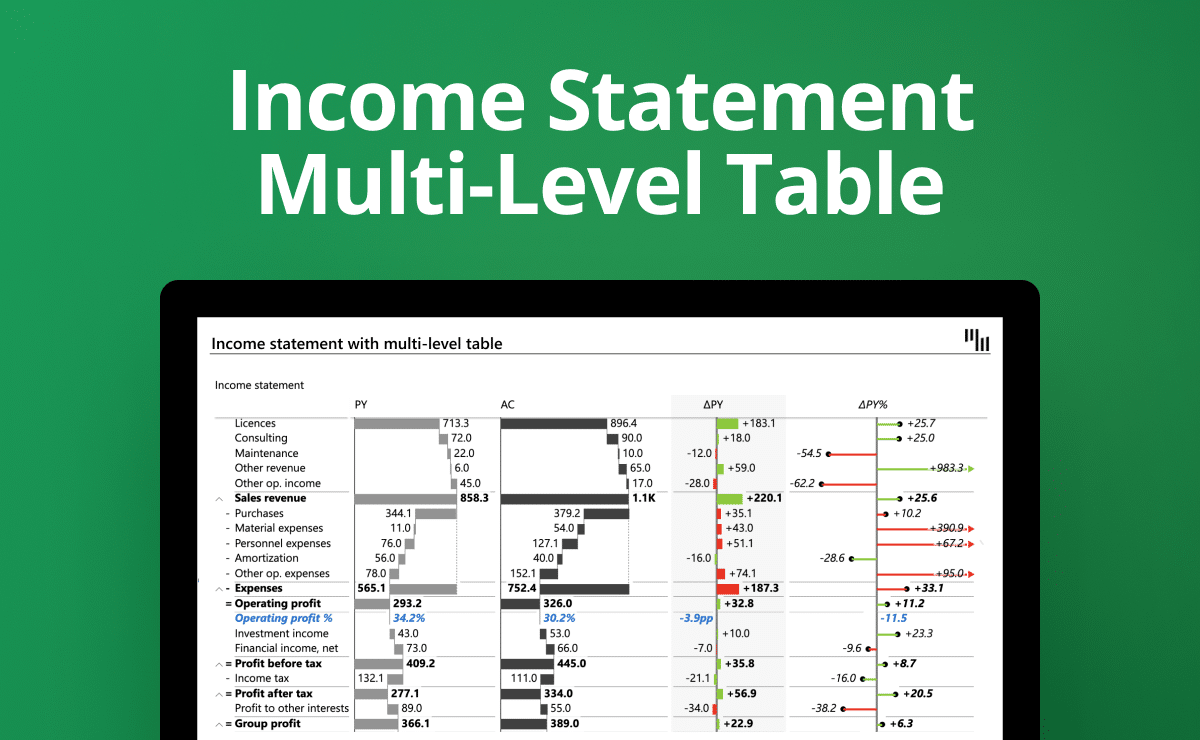
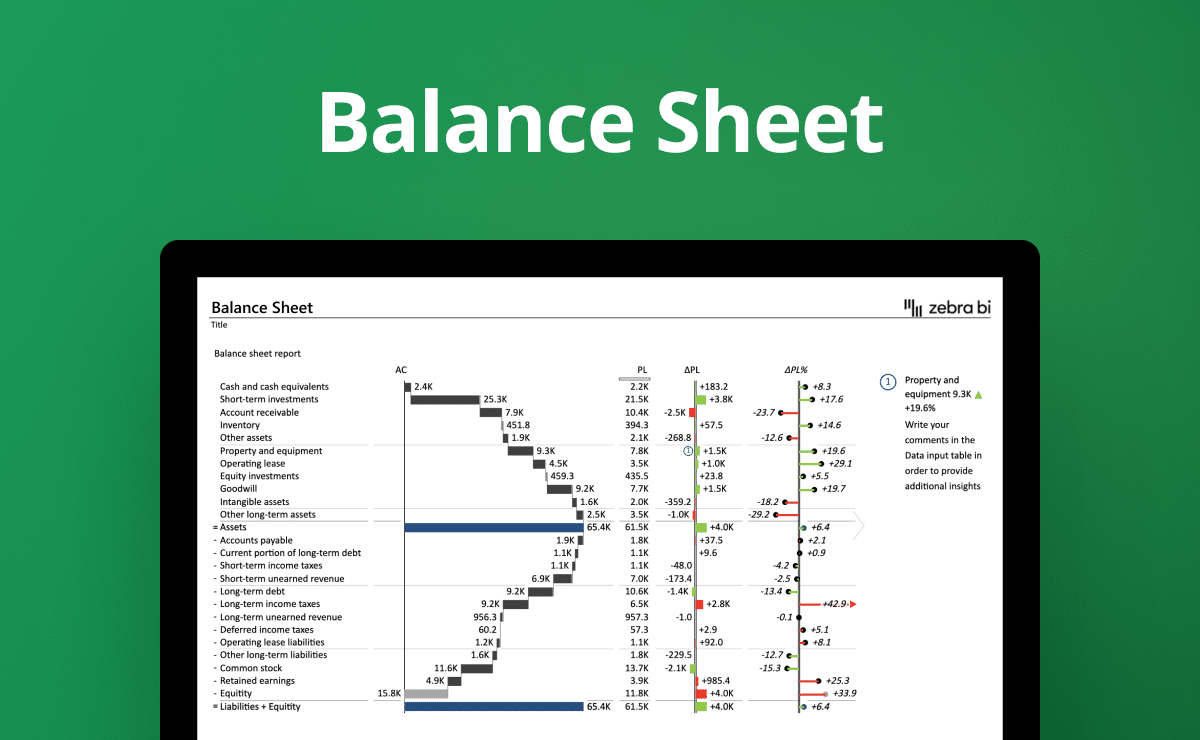
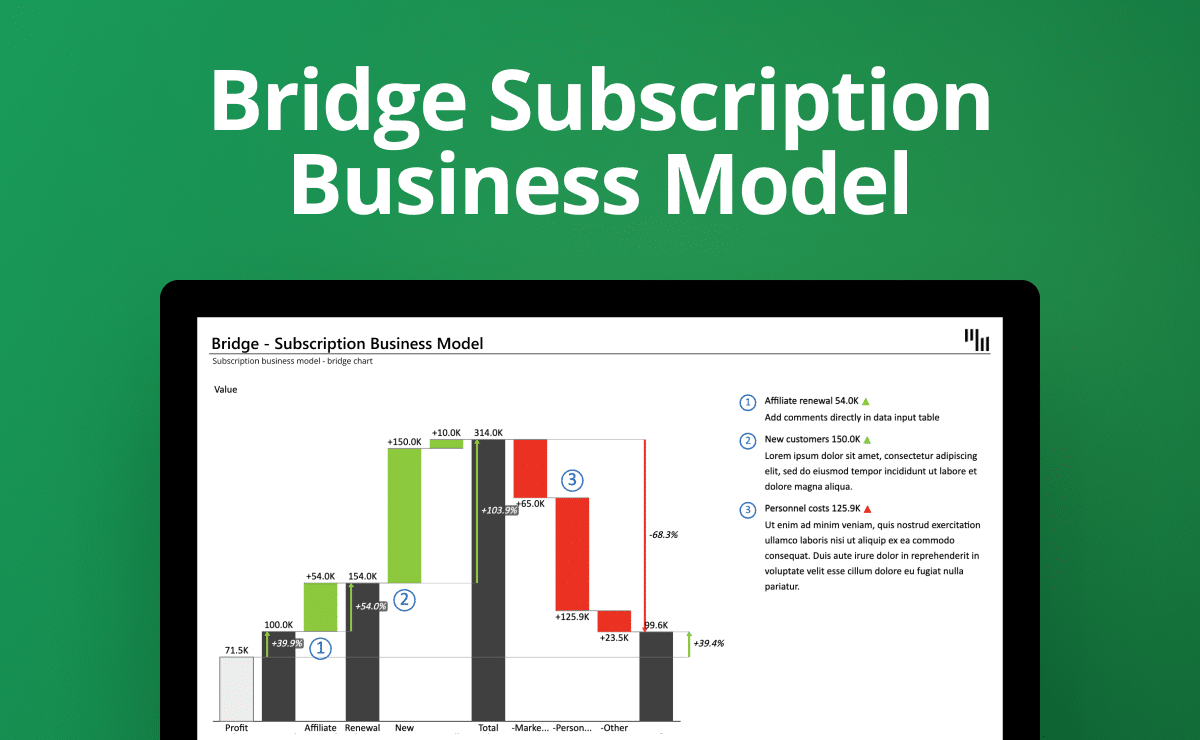
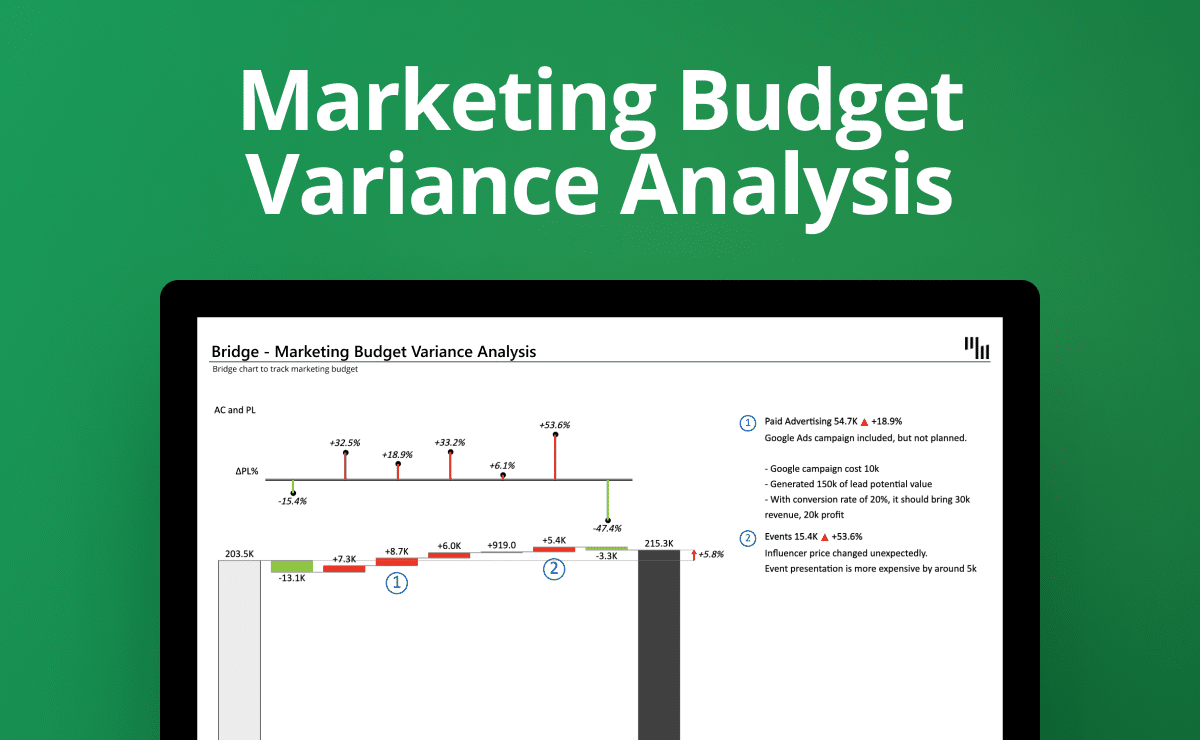
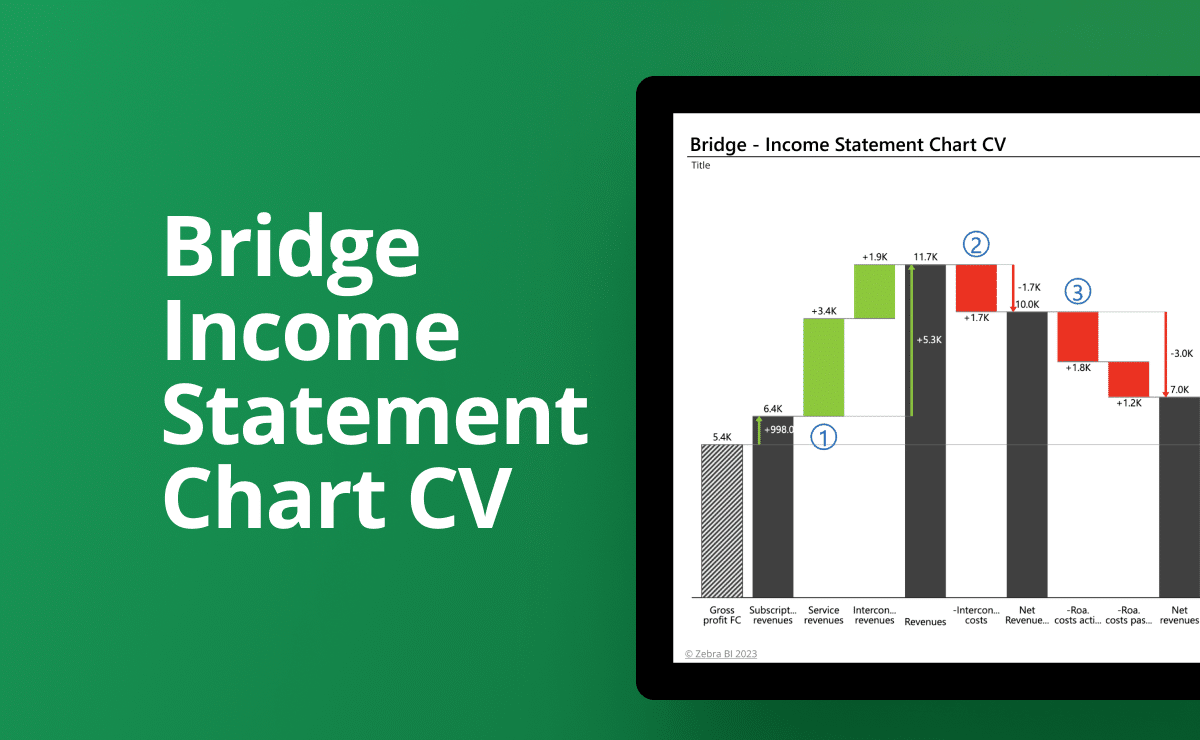
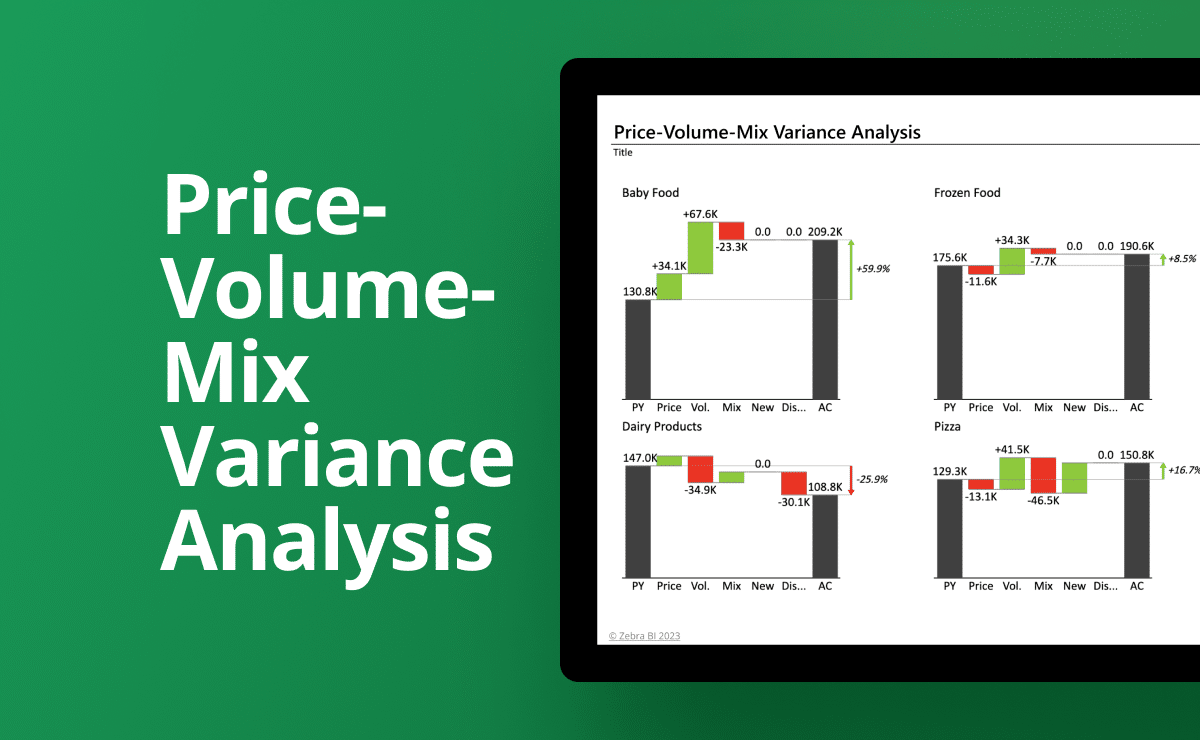
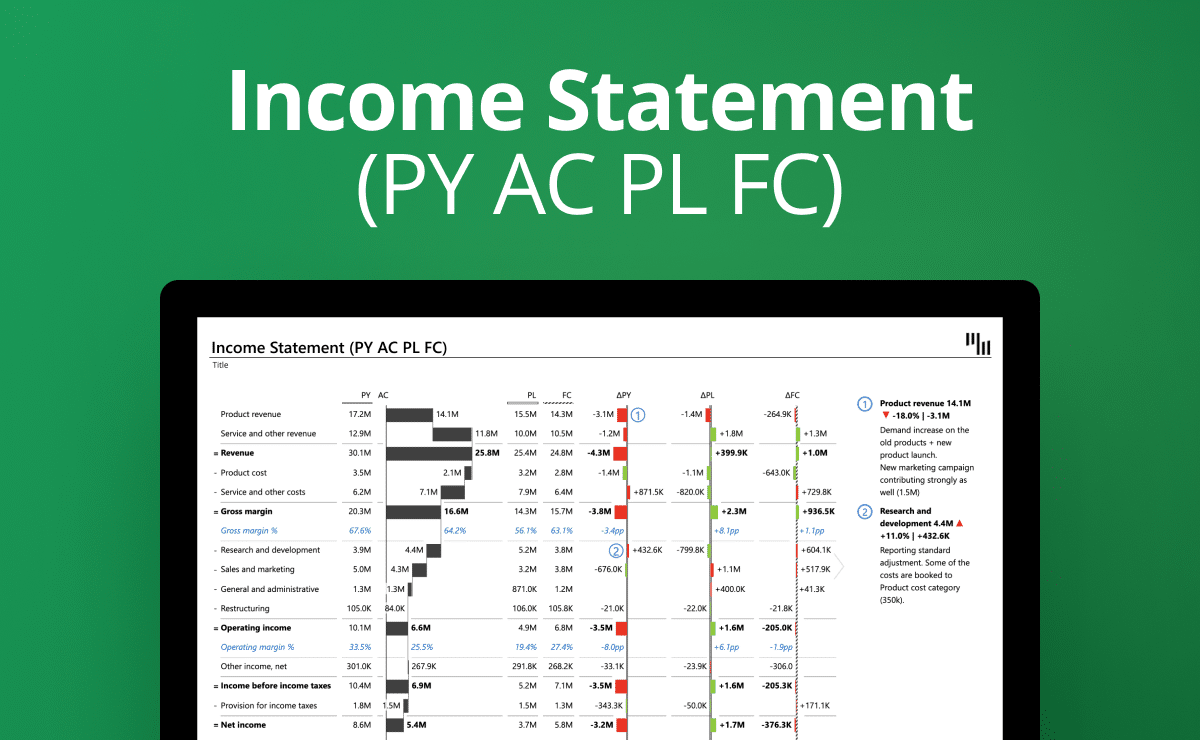
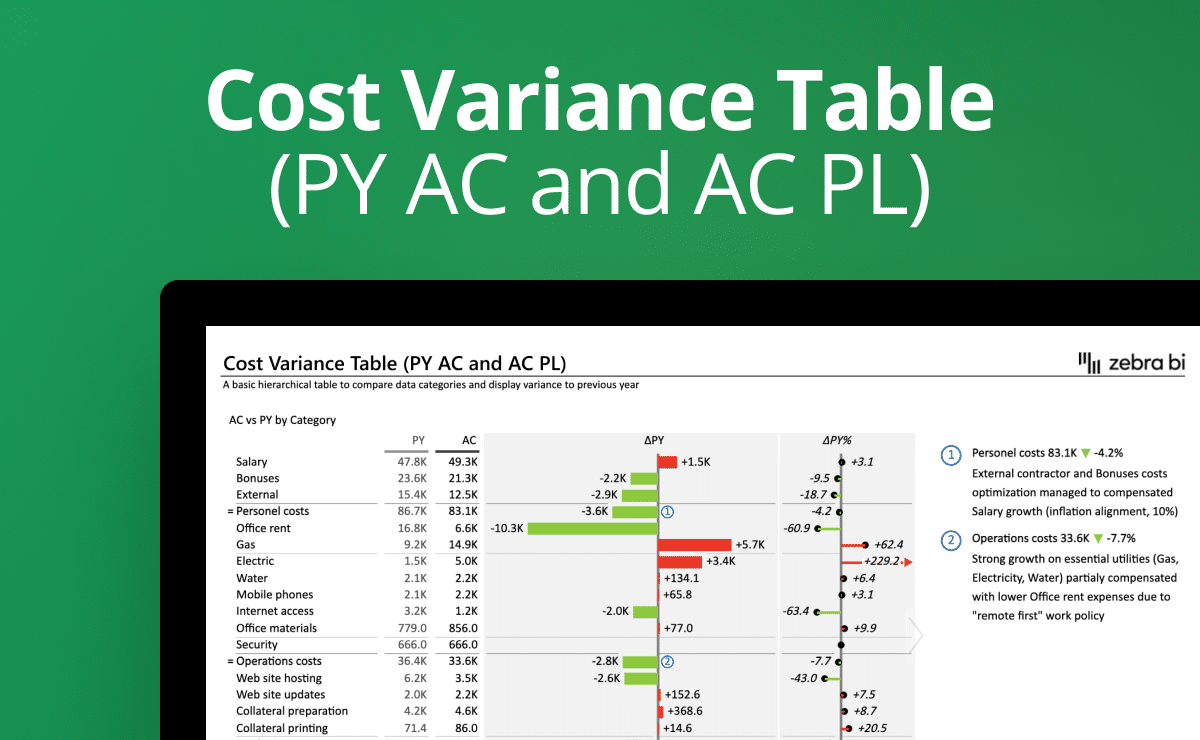
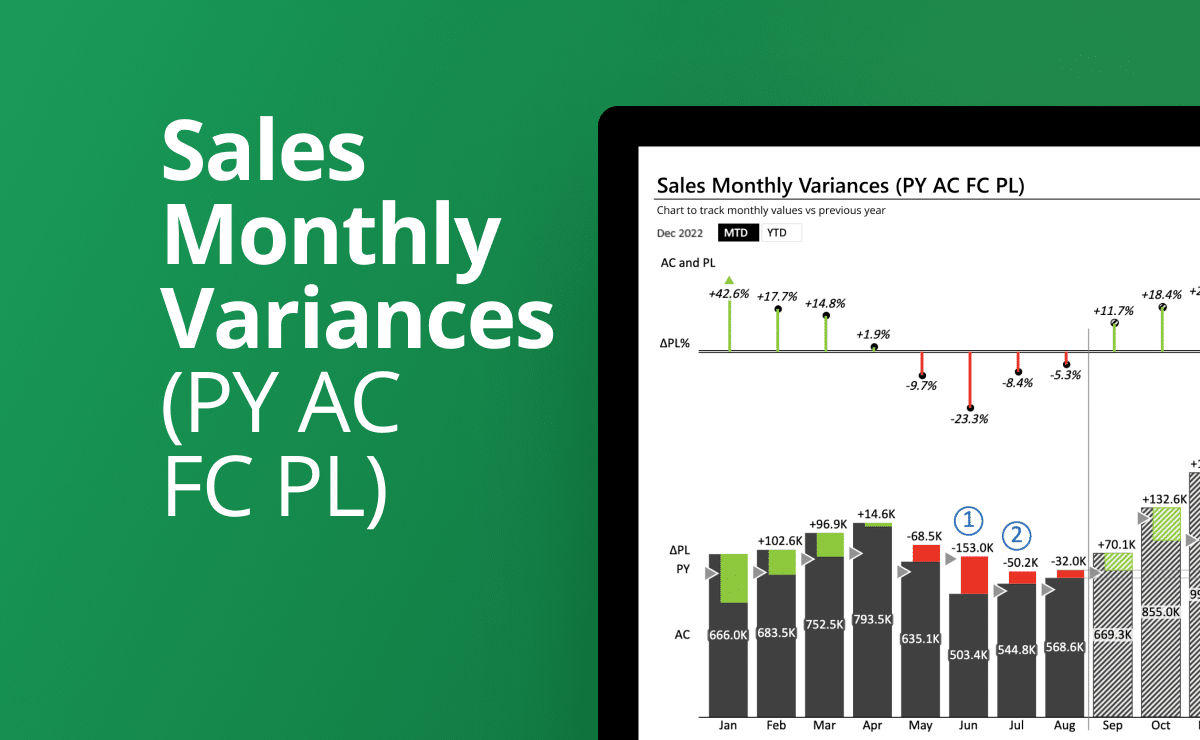
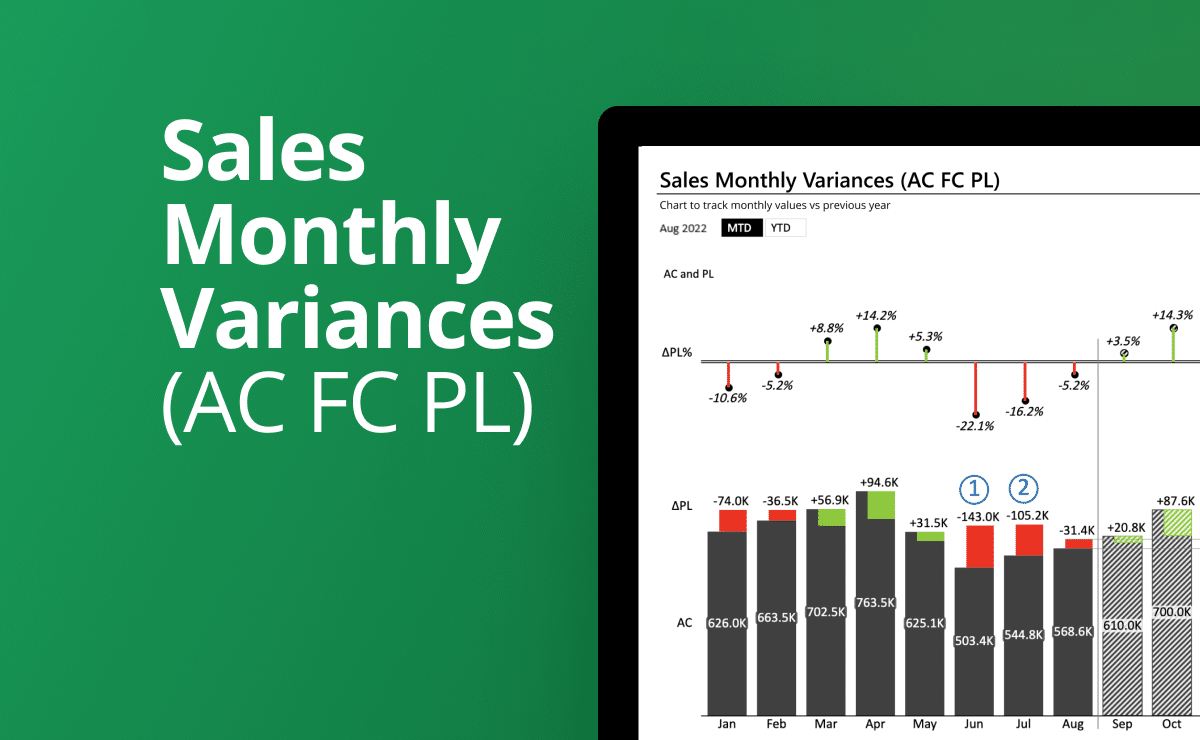
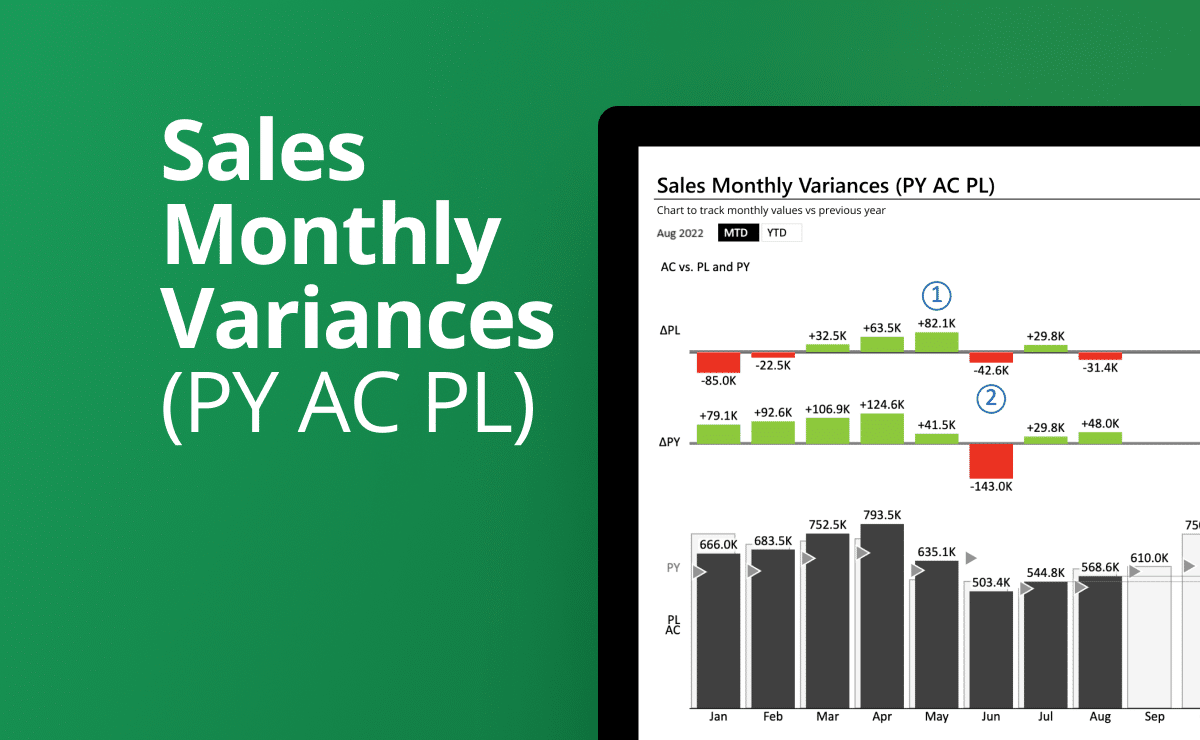
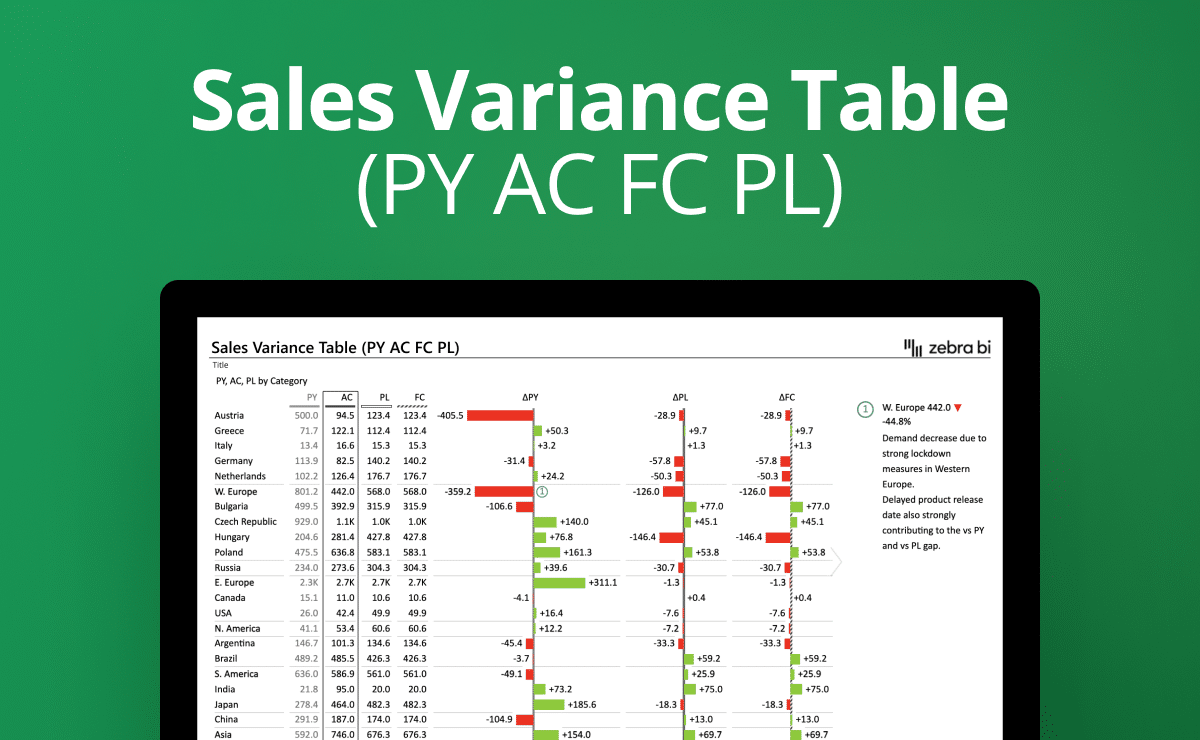
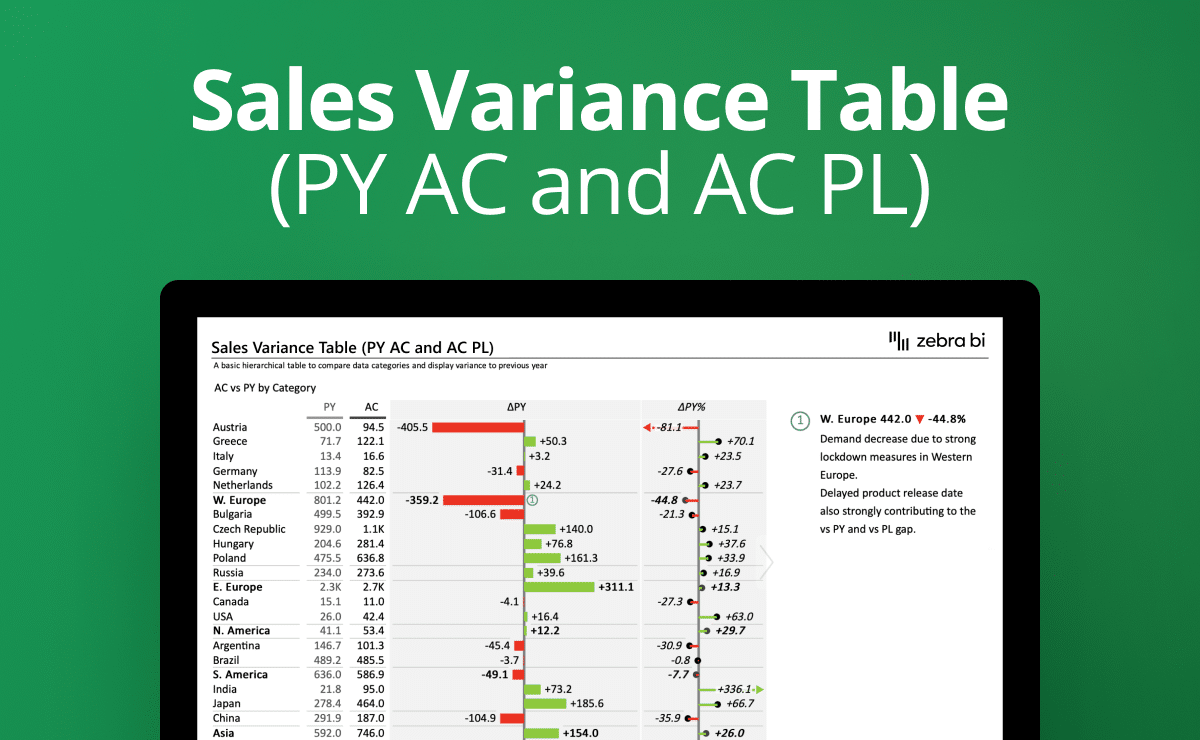
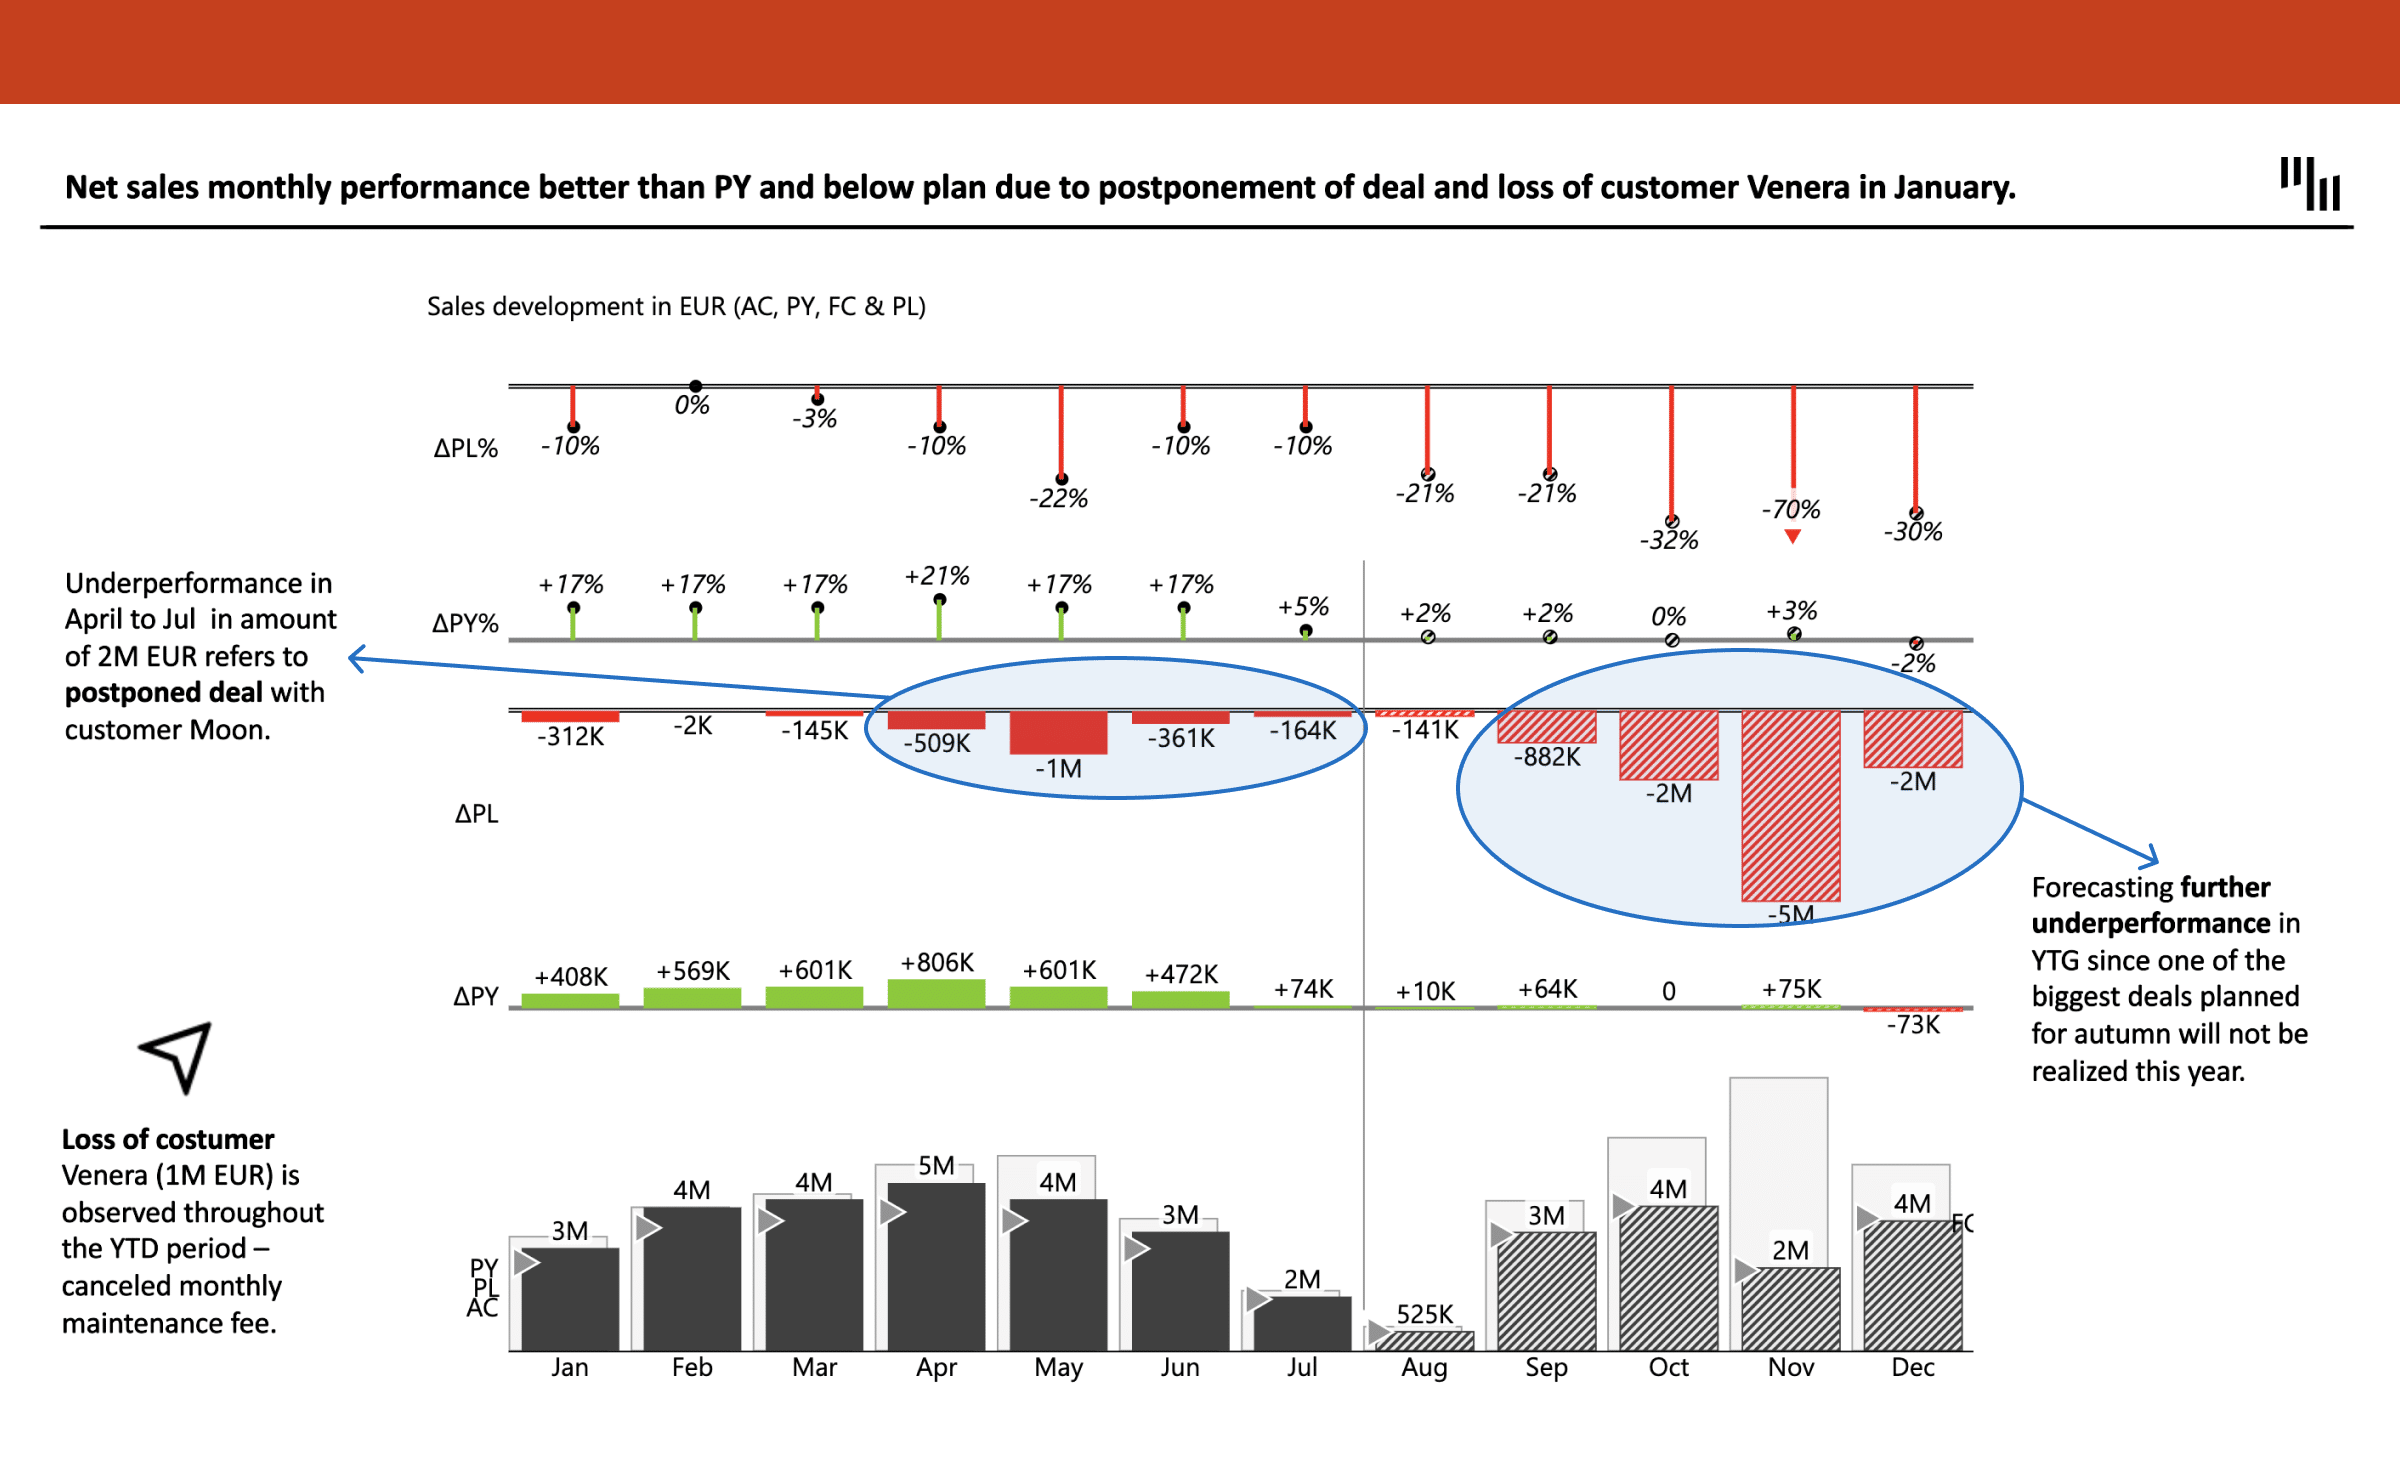
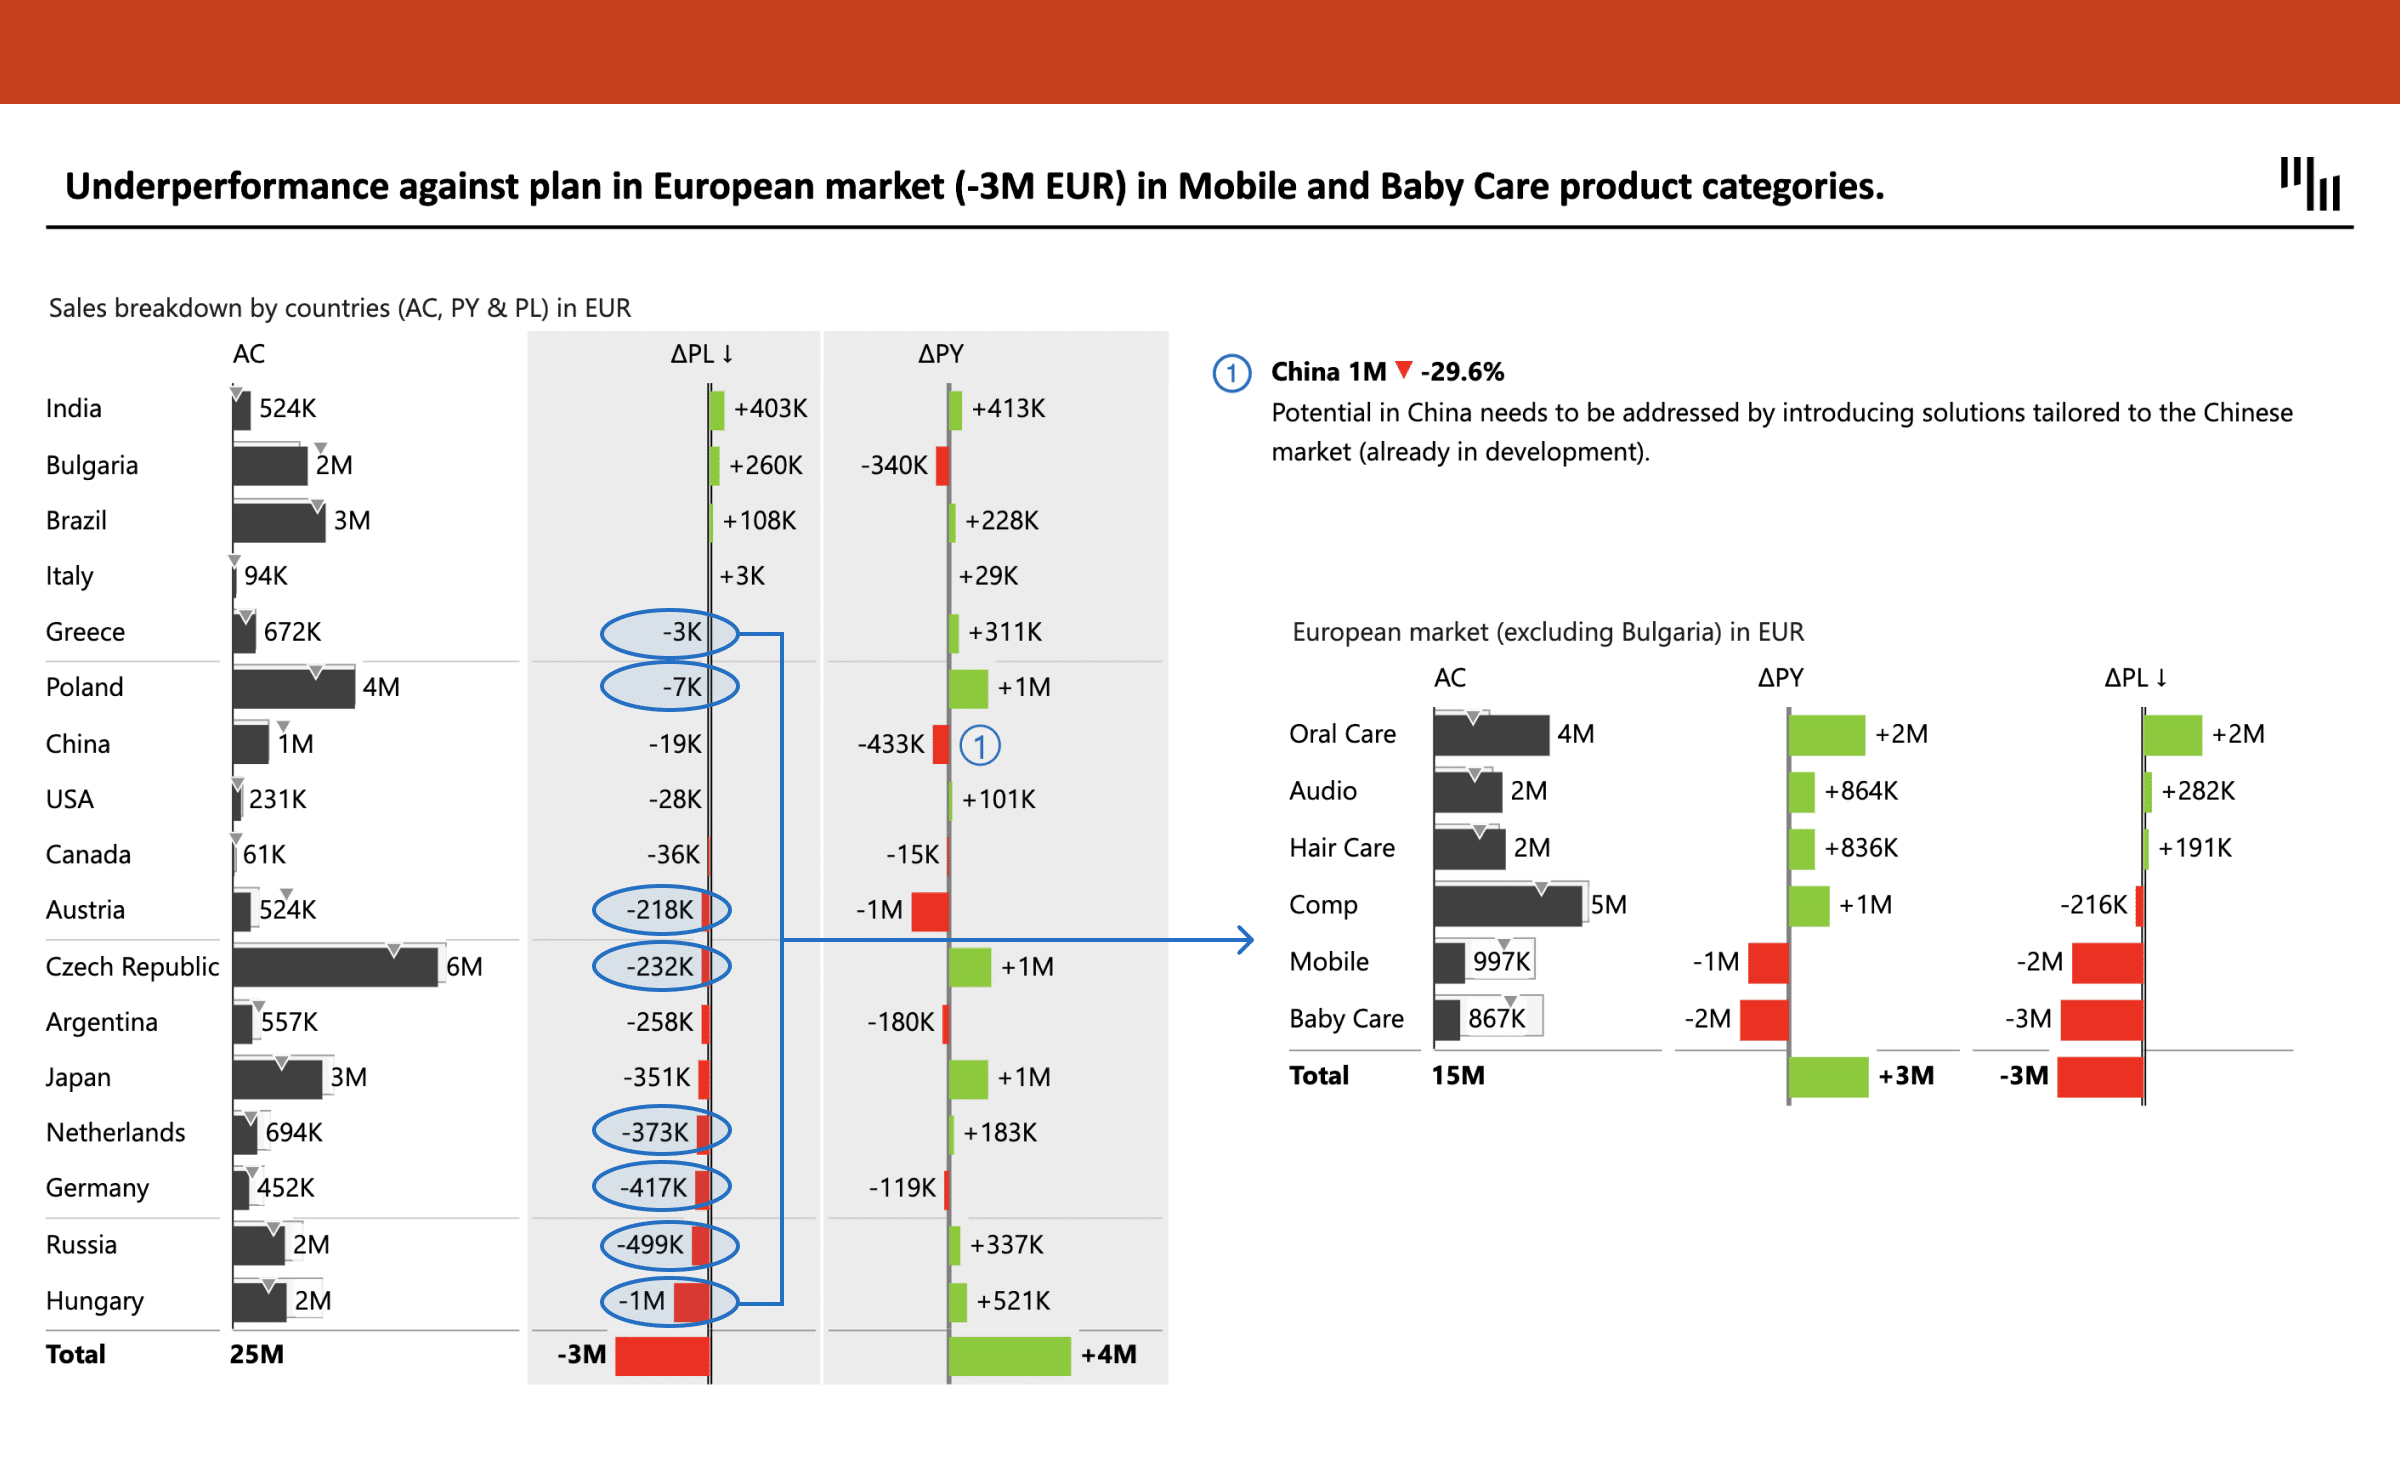
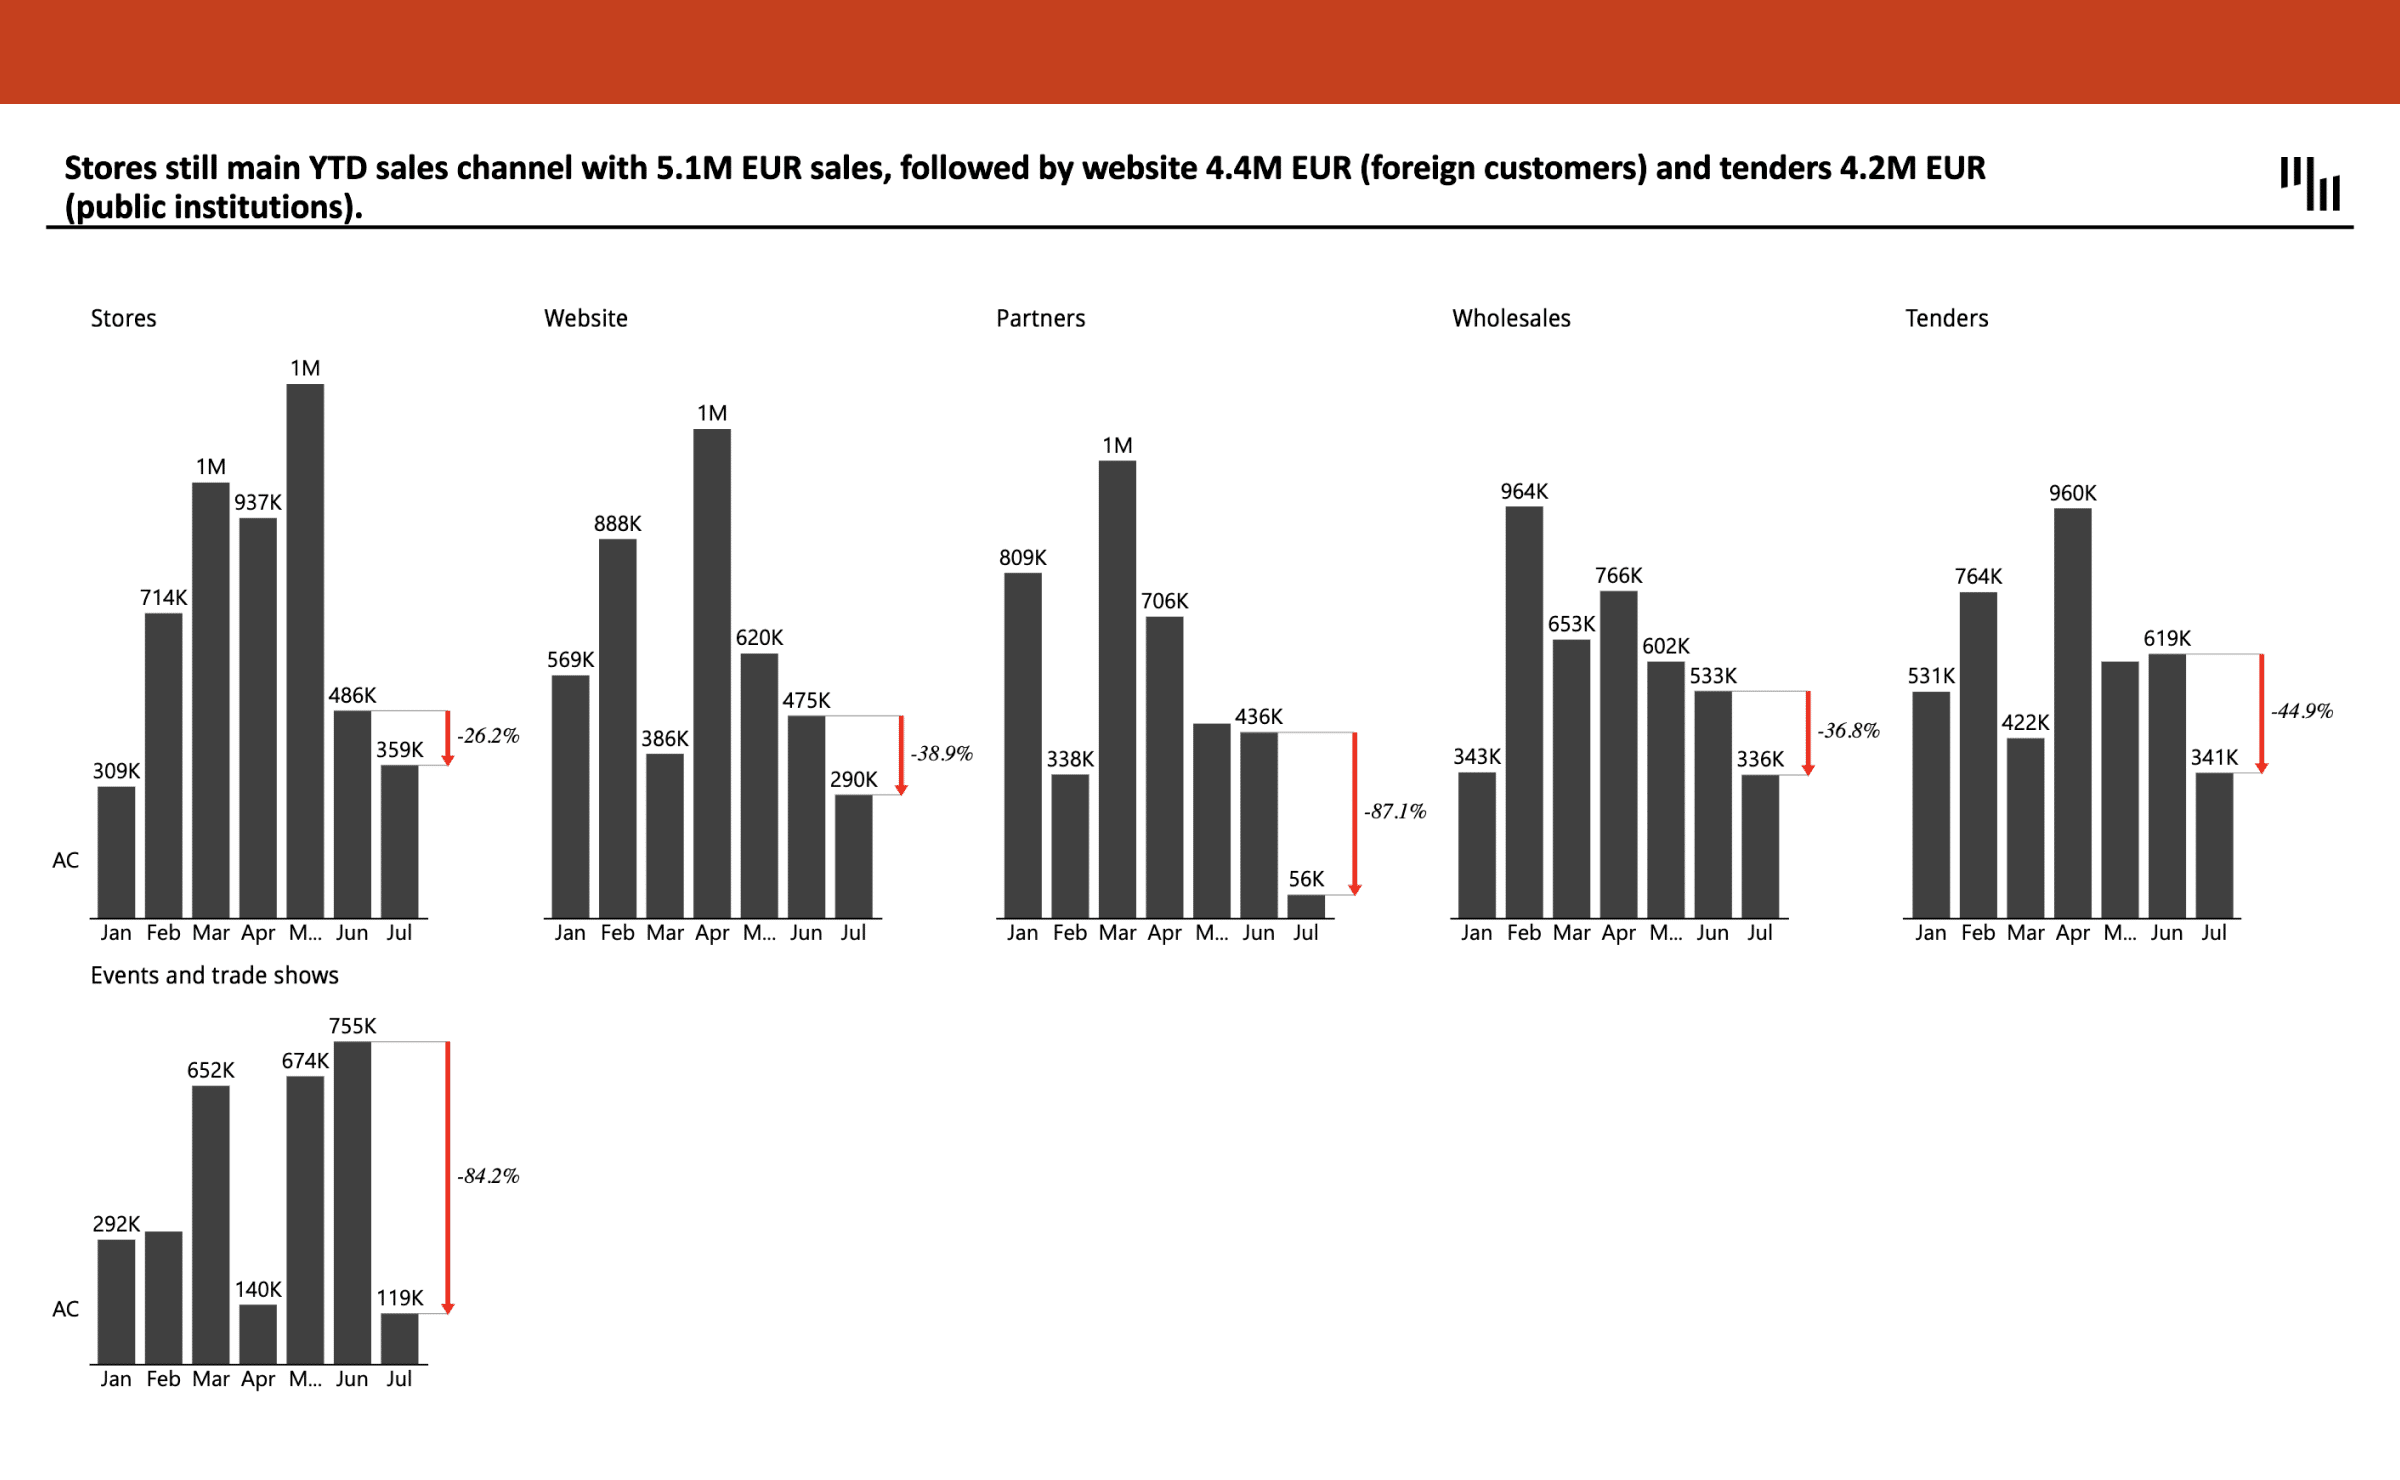
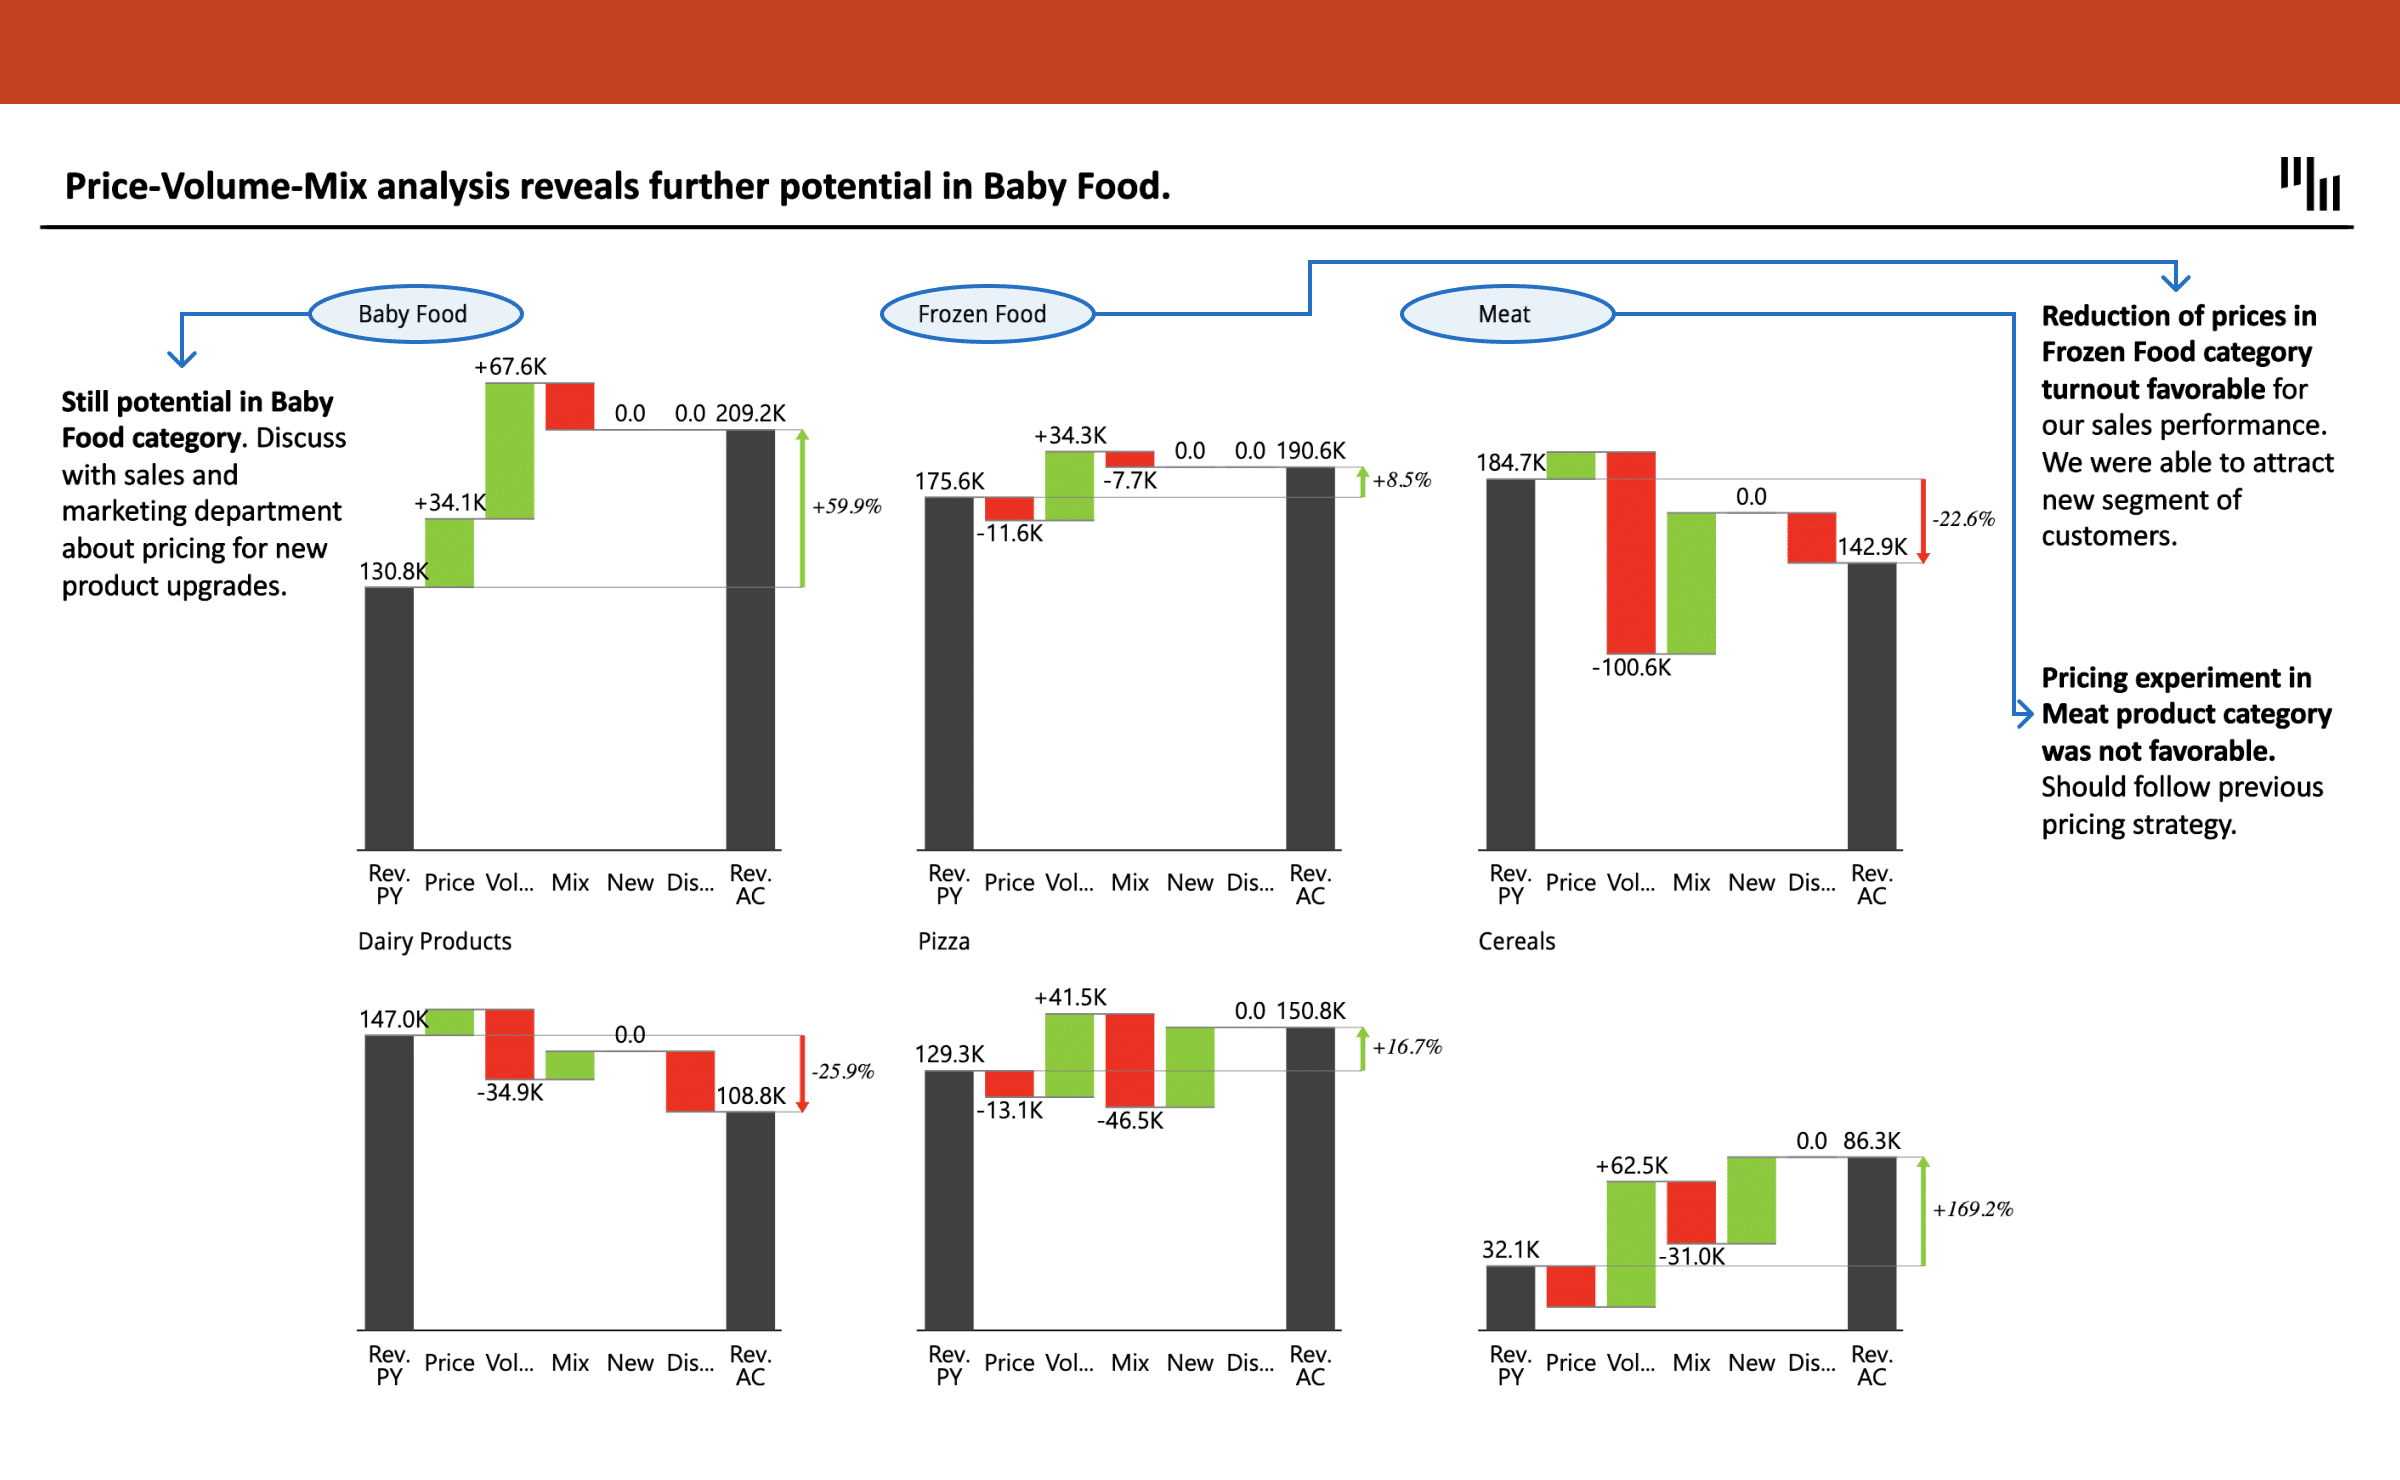
Harness the power of sales report PowerPoint charts to present your key sales drivers, monthly sales development, and sales breakdowns by markets and channels. Dive into the depths of your data using waterfall charts for detailed Price-Volume-Mix analyses. The advanced charts and tables, combined with automatic variance calculations, will help you turn your numbers into insights with zero effort. With comparisons to plan and previous year, you'll be able to show your numbers in context, promoting a rich narrative that drives growth.

Deliver actionable insights for every sales beat

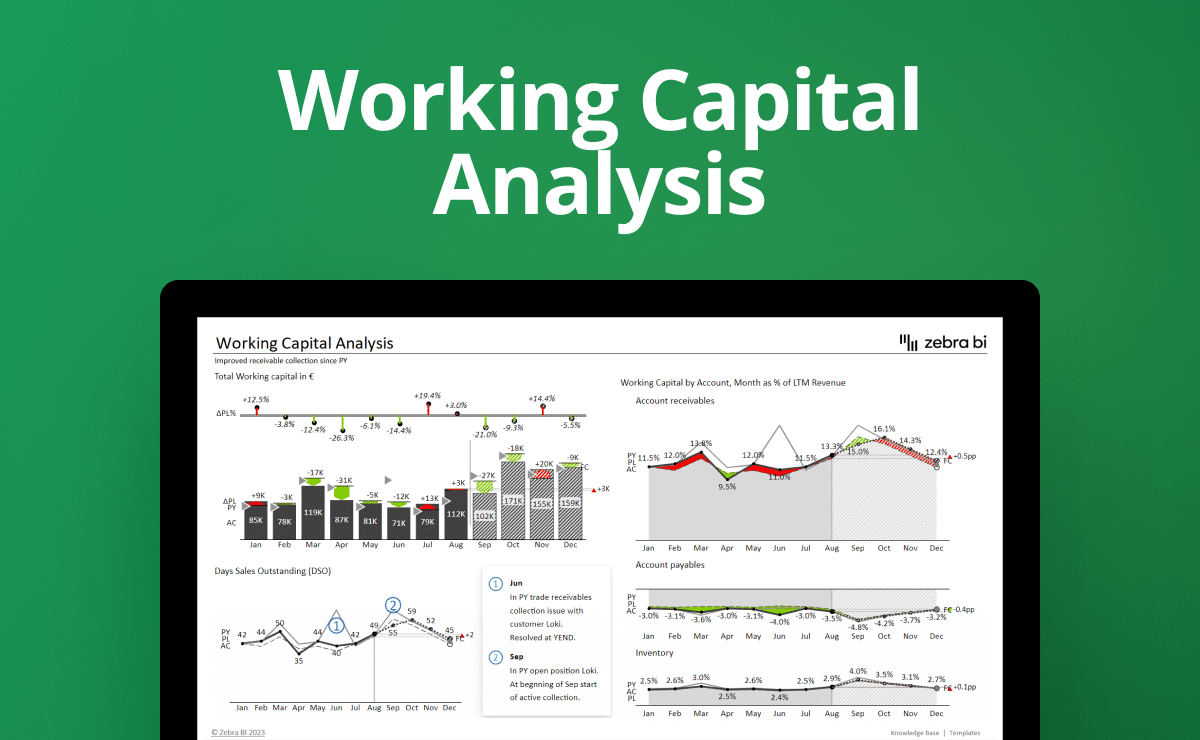
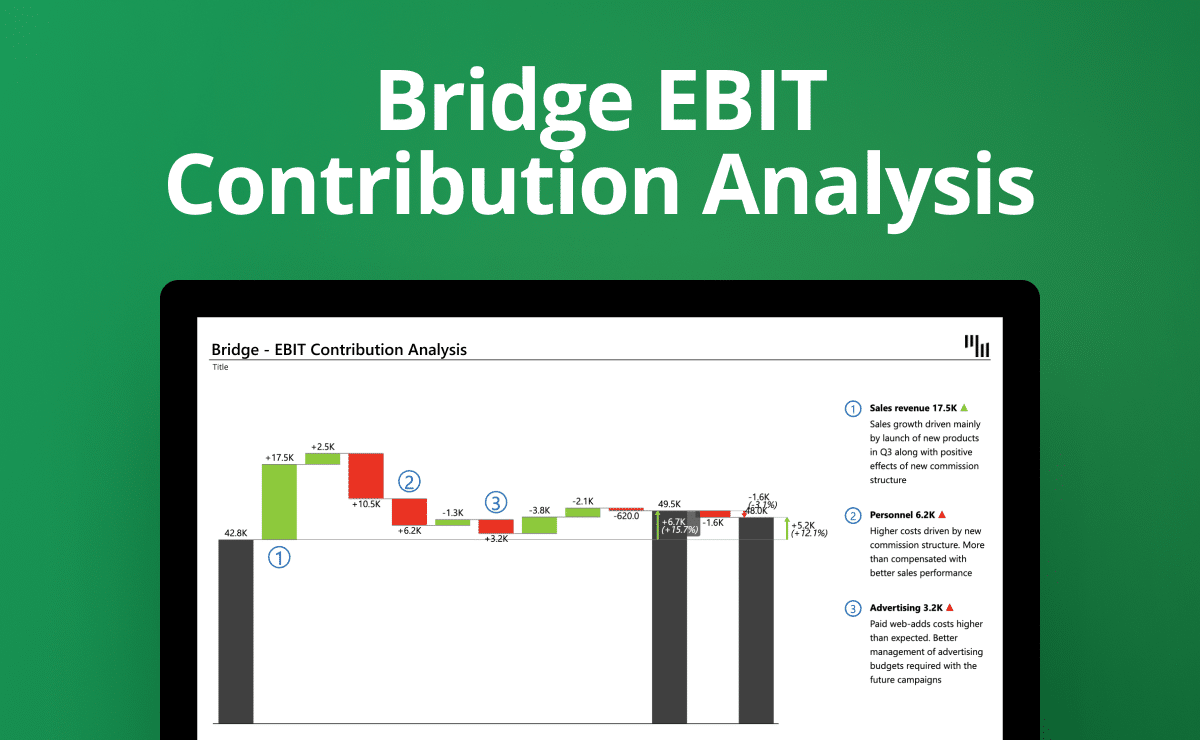
Be it for a weekly huddle or a monthly/quarterly review, Zebra BI's sales report PowerPoint charts enable you to create insight-packed presentations in just a few clicks. They feature a trends-over-time display and automatic variance calculations which help turn complex sales data into compelling stories. With the built-in comment feature, you can give context to your numbers ahead of time but also mid-meeting. This way, team insights become part of the narrative, fostering a more collaborative approach to your presentations.

Choose tailor-made storytelling, crafted for impact

Rather than just pre-designed slides, our sales report PowerPoint charts are a canvas for your unique narrative. Customize input display to spotlight your vital KPIs and metrics. Utilize the hide-columns and highlighting features to emphasize key data points, or apply custom formatting to align with your brand identity. With this slide deck, your sales report is not just another data dump. It's a story tailored to your needs, ready to resonate with your audience and drive decisive action.

Try it with your data

Create stunning sales presentations that your stakeholders can understand at a single glance. Download this free sales report slide deck for PowerPoint, enter your own data and voila, you're ready to go!
Features used
Comparison to plan and previous year
Advanced charts & tables (including waterfall charts and small multiples)
Automatic variance calculations
Trends over time
Dynamic comments
The option of hiding columns
Highlighting
Custom formatting
Creating impactful sales report presentations has never been easier. Feel free to explore the advanced charting options to get inspired & try it with your data.
Download this template

More professionally-designed templates to use

Contribution Margin Analysis Excel Template
Gross Sales vs Net Sales Excel Report Template
Basic
Financial Forecasting and Planning: Profit & Loss Overview Excel Template
Adjusted EBITDA template and adjusted income statement example created with Zebra BI for Excel
Basic
Adjusted EBITDA Template & Adjusted Income Statement Example for Excel
Basic
Long-Term Assets and CapEx Report Excel Template
Basic
Cash Flow Statement from Pivot Table (Hierarchical)
Intermediate
Break-Even Analysis Template for Excel
Intermediate
Working Capital Analysis Template in Excel
Intermediate
Sales variance analysis report templates for Excel
income statement template excel afi
Intermediate
Basic
Income statement templates for Excel
Advanced
Consolidated financials dashboard in Excel
Intermediate
Sales variance report with multiple levels
Intermediate
Sales overview report in Excel
Advanced
Sales dashboard in Excel
Intermediate
Revenue-cost-profit analysis
Intermediate
Inventory report
Intermediate
Quarterly income statement
Basic
Income statement with multiple levels
Basic
Balance sheet template for Excel
Basic
Subscription business model analysis in Excel
Basic
Marketing budget variance analysis in Excel
Basic
Income statement (bridge chart) in Excel
Intermediate
Price-Volume-Mix variance analysis in Excel
Basic
EBIT contribution analysis in Excel
Basic
Cash Flow Statement template
Basic
Income statement in Excel (PY-AC-PL-FC)
Basic
Income statement in Excel (PY-AC-PL)
Basic
Income Statement in Excel (PY-AC) and (AC-PL)
Basic
Cost Variance Table in Excel (PY-AC-FC-PL)
Basic
Cost Variance Table in Excel (PY-AC-PL)
Basic
Cost Variance Table in Excel (PY-AC and AC-PL)
Intermediate
Monthly Sales Variances in Excel (PY-AC-FC-PL)
Intermediate
Monthly Sales Variances in Excel (AC-FC-PL)
Intermediate
Monthly Sales Variances in Excel (AC-PY-PL)
Intermediate
Monthly Sales Variances in Excel (PY-AC and AC-PL)
Basic
Sales Variance Table in Excel (PY-AC-FC-PL)
Basic
Sales Variance Table in Excel (PY-AC-PL)
Basic
Sales variance table in Excel (PY vs. AC and AC vs. PL)