AI in financial reporting: dashboards vs AI, and why the answer is both
PRO Trial
The short version: It isn't dashboards or AI. Keep governed dashboards for the numbers that must read the same every time, the monthly close, the board pack. Use AI for self-service and ad hoc questions that used to sit in a queue. Both run on one clean data model. Here is what that looked like when we tested both, live, on the real financials of 100 public companies.
AI in financial reporting means using AI to read, analyze, and explain financial data: pulling the numbers, computing the metrics, writing the narrative, and answering questions in plain language. For finance teams the real question isn't whether to adopt it. It's where AI fits next to the dashboards you already run
Right now, in finance teams everywhere, the same argument is playing out. You've spent years building out Power BI. The dashboards work. Then an AI tool answers, in plain language and in seconds, what used to take a built report, and someone asks the obvious question: do we still need the dashboards, or do we move to AI?
It's the wrong question, and getting it wrong is expensive. Rip out reporting that works and you've traded reliability for novelty. Bet the monthly close on a chatbot and you're trusting numbers it might have invented. Get it right, though, and you hand your analysts back the week they lose to formatting, without giving up the numbers your board depends on.
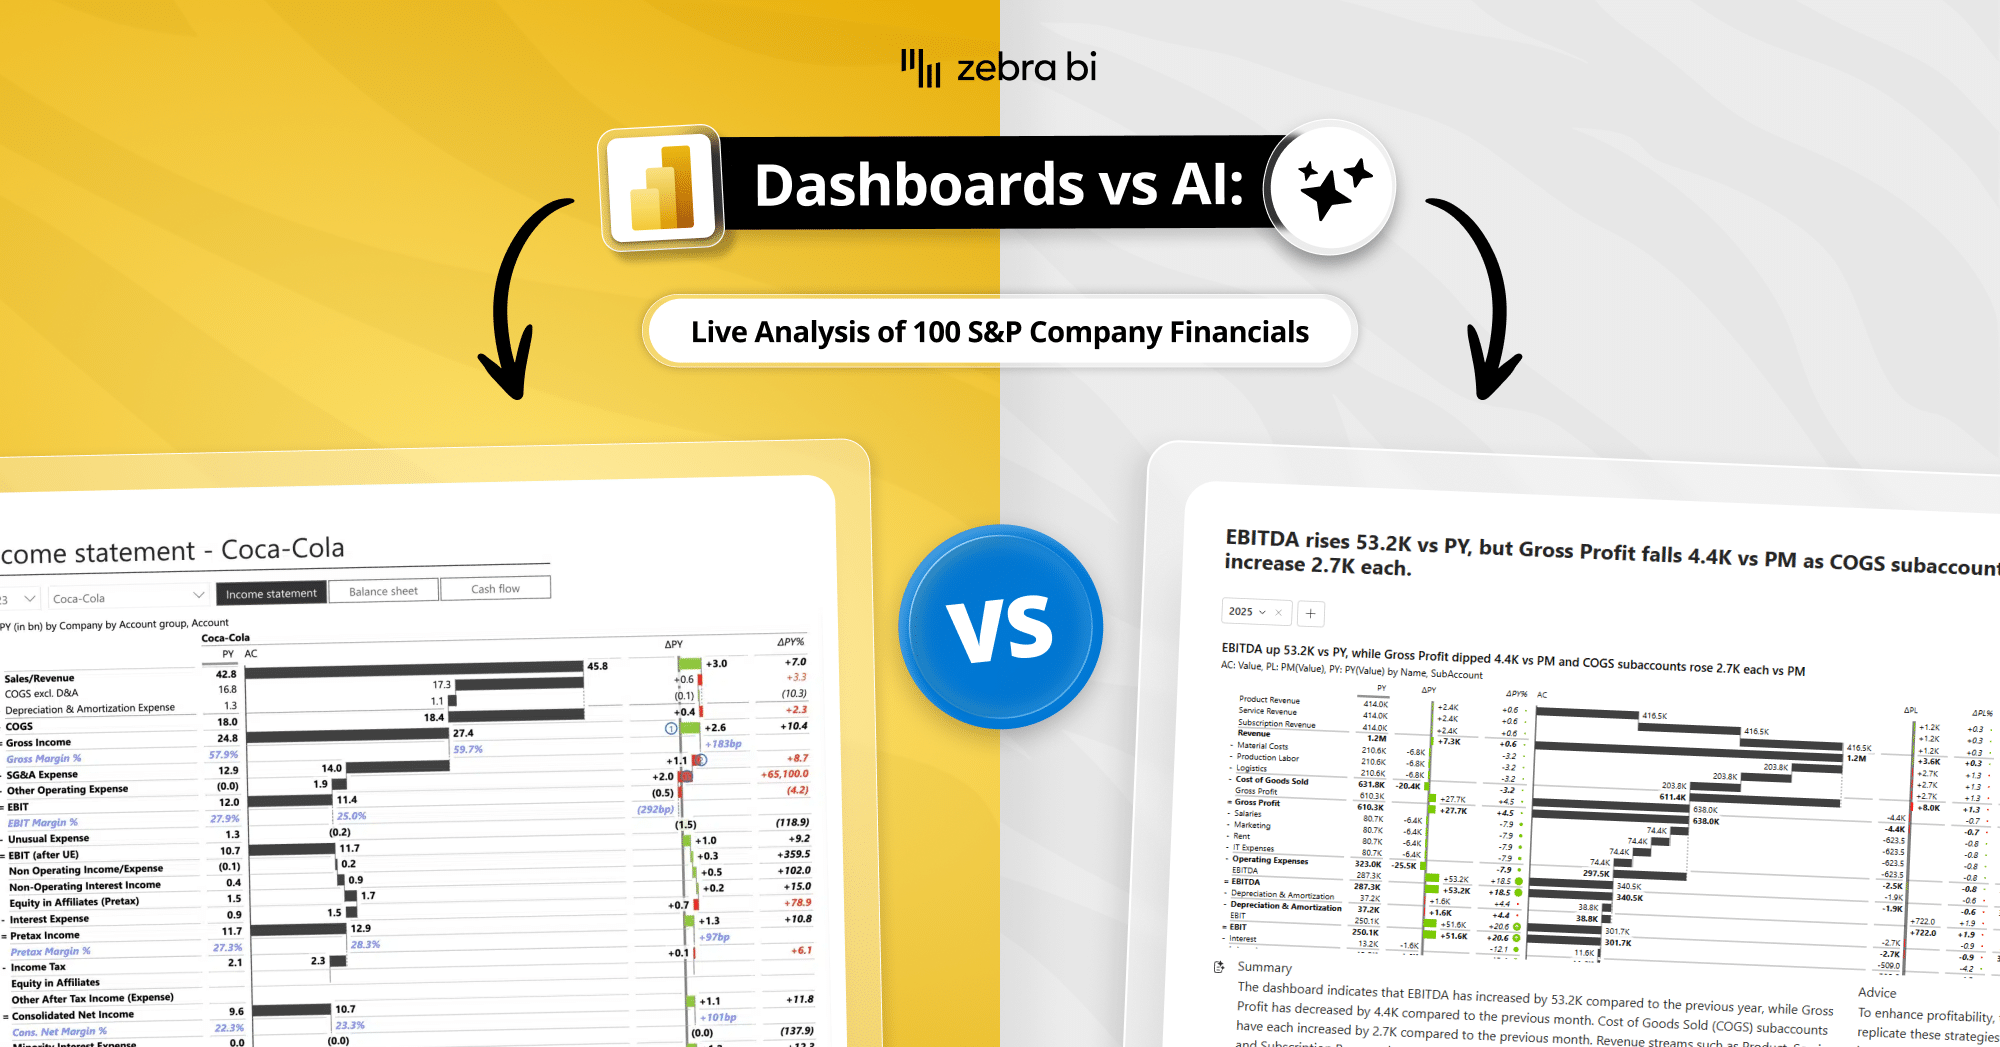
So we ran the test, live and unscripted. Mark built a P&L in Power BI the way most finance teams do. Andrej rebuilt the same analysis with AI, right beside it. In Andrej's words on the day: "This is all live. This is not a marketing video." That was the point, to stress-test both on real numbers instead of arguing about them.
What happened in the room
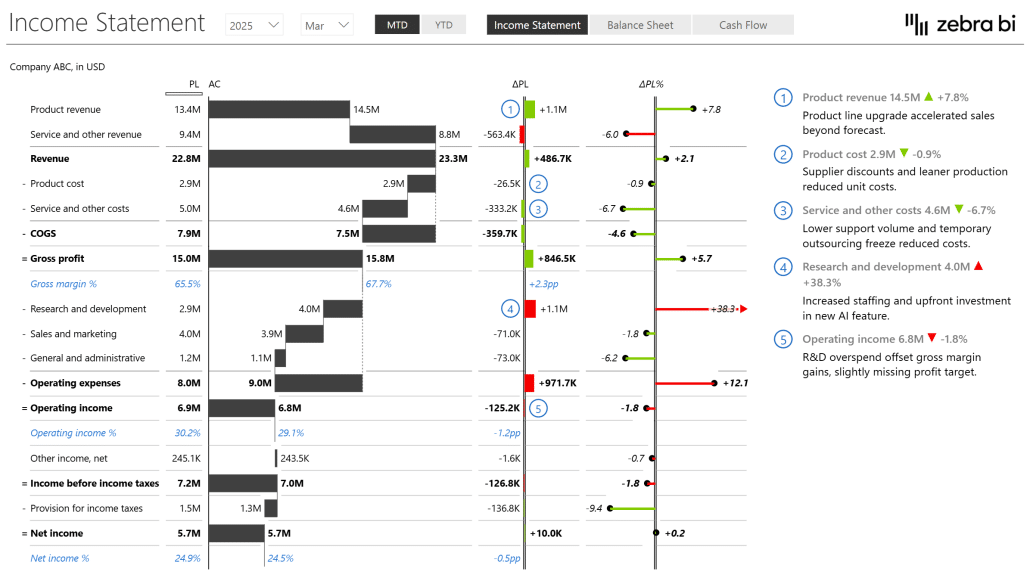
Mark built the P&L (profit and loss statement) the way most finance teams do: a clean, IBCS-standard report in Power BI, waterfall automatic variances, and the structure mapped once and reused. Real work, done well.
Then Andrej pointed AI at the same data model. It read the model, built an executive-ready P&L, and wrote the narrative in seconds. "It's so fast," he said, "I can't even read it."
Then it stopped waiting to be asked. It calculated EBITDA margins that weren't in the data. It ranked the company against its industry. It added a competitor comparison nobody requested. "Looks like you got more than you asked for," Mark said. When Andrej asked for a trend and the AI guessed the exact company he had in mind, he stopped competing with it: "It was smarter than me."
The reassuring part is that it wasn't magic. Andrej fed it typos and broken English and still got the right answer back. He's even lost his old habits: "After a year working with AI, I forgot my DAX. I forgot my Power Query." And the one risk you can't wave away in finance, that AI invents numbers, showed up too. Keeping it honest is the next section.
So the takeaway wasn't "AI wins." It was sharper, and more useful, than that.
Dashboards vs AI, across the three jobs of reporting
Same data, two approaches, scored on the three things every reporting team actually does:
| Job | Dashboards (Power BI + Zebra BI) | AI (Zebra AI) |
|---|---|---|
| Creating reports | Built once, governed, repeatable. The production backbone. | 90% of a working report in seconds. The last 10% is still manual. |
| Understanding insights | Variance, hierarchy, and commentary built into the visuals. | Writes the narrative and new metrics on the fly, then explains them. |
| Ad-hoc analysis | A new metric or view needs a designer or an IT ticket. | Wins. Ask in plain language, get a new view in seconds. |
| Consistency | The same numbers every time, for thousands of users. | Best for exploration, not the report of record. |
| Who can do it | Builders, with DAX (Power BI's formula language) and modeling skills. | Business users, no DAX needed. |
The honest read: on building reports, AI is already up there. On ad-hoc analysis it runs away with it, that was always the job dashboards did worst. So nobody is tearing out Power BI. In Andrej's words, every client is doing the same thing, adding AI on top. The governed reports stay put; the and the exploration move to AI.
And to head off the obvious objection: this is not Power BI versus anything. Power BI runs your dashboards, Zebra BI makes them decision-ready with IBCS standards built in, the rules that keep a chart readable across every team, and Zebra AI is the separate layer that plugs into your data. Same Microsoft stack, different jobs.
How to decide what goes where
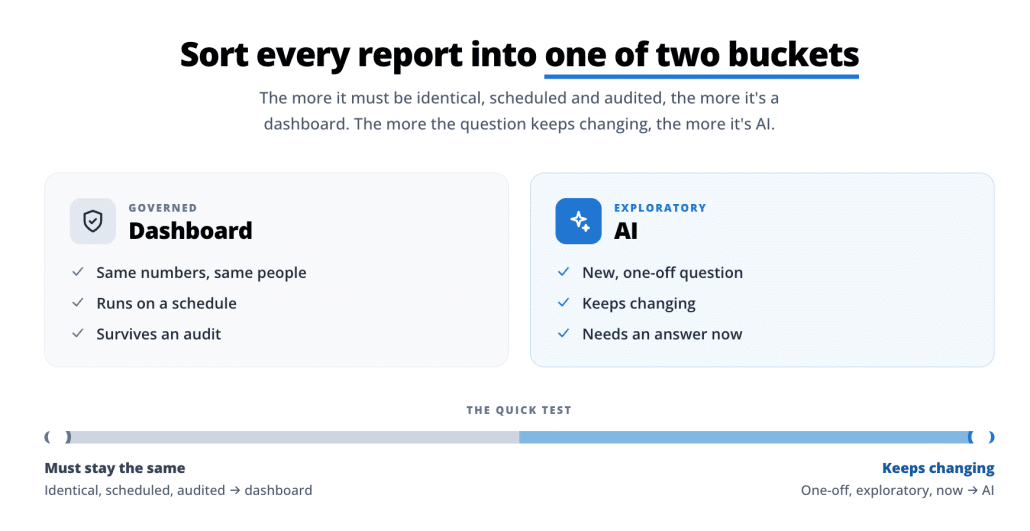
Sort each report into one of two buckets:
- Governed dashboard: the same numbers, for the same people, on a schedule, and it has to survive an audit. The close, the board pack, the scorecards.
- AI: the new, one-off, exploratory question a business user needs answered now.
The test takes a second: the more a report has to be identical, scheduled, and audited, the more it belongs in a dashboard; the more the question changes, the more it belongs with AI. One caveat on where to start. If Excel is still your source of truth, get one governed report right before you point AI at anything, because AI on a messy model just produces confident nonsense faster.
The one thing that makes or breaks it: your model
The part that caught the builders off guard: AI didn't trip up because it wasn't smart. It tripped up wherever the model was messy. Andrej connected to Mark's clean star schema, and it worked on the first try.
Which means your modeling work just got more valuable, not less. Before you point AI at anything, get these right:
- Clean, human-readable account names.
- A proper star schema and a narrow fact table.
- Complete metadata.
- Account mapping with a report-type column, so one model serves the income statement, balance sheet, and cash flow.
Do that once and it pays off twice: steadier dashboards, and sharper AI.d it pays off twice: steadier dashboards and faster, more accurate AI.
Accuracy, and why the human still matters
The real objection to AI in finance is hallucination. You can't run a board pack on a number a model invented. The fix is architecture: Zebra AI pairs the language model with deterministic tools, variance analysis and a code interpreter that compute the figures exactly, so the numbers are calculated, not guessed. (For the security team: it runs in your browser, inside Microsoft Fabric on your tenant, or as a managed app on your own cloud.)
And the human keeps the part that matters most. AI writes the "what." People own the "why," the reason revenue dipped, the pricing call behind a margin swing, the context that never lived in the data. That, as Mark said, is where the analyst stays essential. AI just hands back the week that used to disappear into formatting.
See the numbers before you trust them
What "good" looks like: the Four-Question Test
A report earns its place only if it answers the four questions a leader asks in a meeting: is performance good or bad, by how much, why, and what now. Most reports stop at the first.
In the demo, both the dashboard and the AI passed it on a real P&L. EBIT margin had dropped from 21.4% to 16.5%, down 4.9 points (good or bad, and by how much). The account hierarchy traced it to a single unusual expense (why). The commentary layer captured the action (what now). Closing that gap to "what now" is the last mile, and it is the entire point.

You don't have to take our word for it. More than 3,000 companies build their reporting on Zebra BI, including Microsoft, Coca-Cola, Nestlé, and Nike. KPN, the Dutch telco, built some of the best self-service dashboards we've seen in Power BI on that same foundation, exactly the model that lets AI run on top.
The ability to explore data more deeply has helped us draw better business decisions, while saving significant reporting time.
Frequently asked questions
Can AI replace dashboards for financial reporting?
Not entirely, and you wouldn't want it to. The governed reports that must read the same every time, the close, the board pack, belong in dashboards. AI is the better fit for self-service and ad-hoc analysis. Most teams run both.
Can AI replace dashboards for financial reporting?
Not entirely, and you wouldn't want it to. The governed reports that must read the same every time, the close, the board pack, belong in dashboards. AI is the better fit for self-service and ad-hoc analysis. Most teams run both.
Will AI replace FP&A analysts?
No. AI takes over the crunching: building the report, calculating the metrics, drafting the narrative. What it can't do is own the context, why a number moved and what to do about it. The role shifts from building reports to interpreting them.
Which AI is best for financial reporting?
It depends on the job. Governed, recurring reports belong in a dashboard. For self-service analysis, the best fit is an AI that connects to your governed model, computes the numbers with deterministic tools instead of guessing, and renders finance-ready visuals with commentary. The strongest setup pairs both on one clean model.
How is this different from Power BI Copilot?
Copilot helps you build and query inside Power BI. A finance-tuned AI layer goes broader: it connects to your model, computes the numbers deterministically, and produces finance-ready visuals and narrative. The two work together, not against each other.
Do you need a clean data model to use AI?
Do you need a clean data model to use AI? Yes. AI is only as good as the model under it. Clean names, a proper star schema, and complete metadata are what make AI fast and accurate.
How does AI avoid making up numbers?
The reliable approach doesn't let the language model do the math. It pairs the model with deterministic tools and a code interpreter that calculate the figures exactly. The model interprets the question; the tools do the arithmetic.
Where to start
Don't pick one. Sort your reporting into governed and exploratory, get a clean model underneath both, and add AI where the questions keep changing.
The fastest way to see the difference is to watch the head to head on real data: watch the Dashboards vs AI session. When you're ready to try the AI half on your own numbers, start with Zebra AI for free and run it through the Four-Question Test.