Webinar recording
Dashboards vs AI: Live Analysis of 100 S&P Company Financials

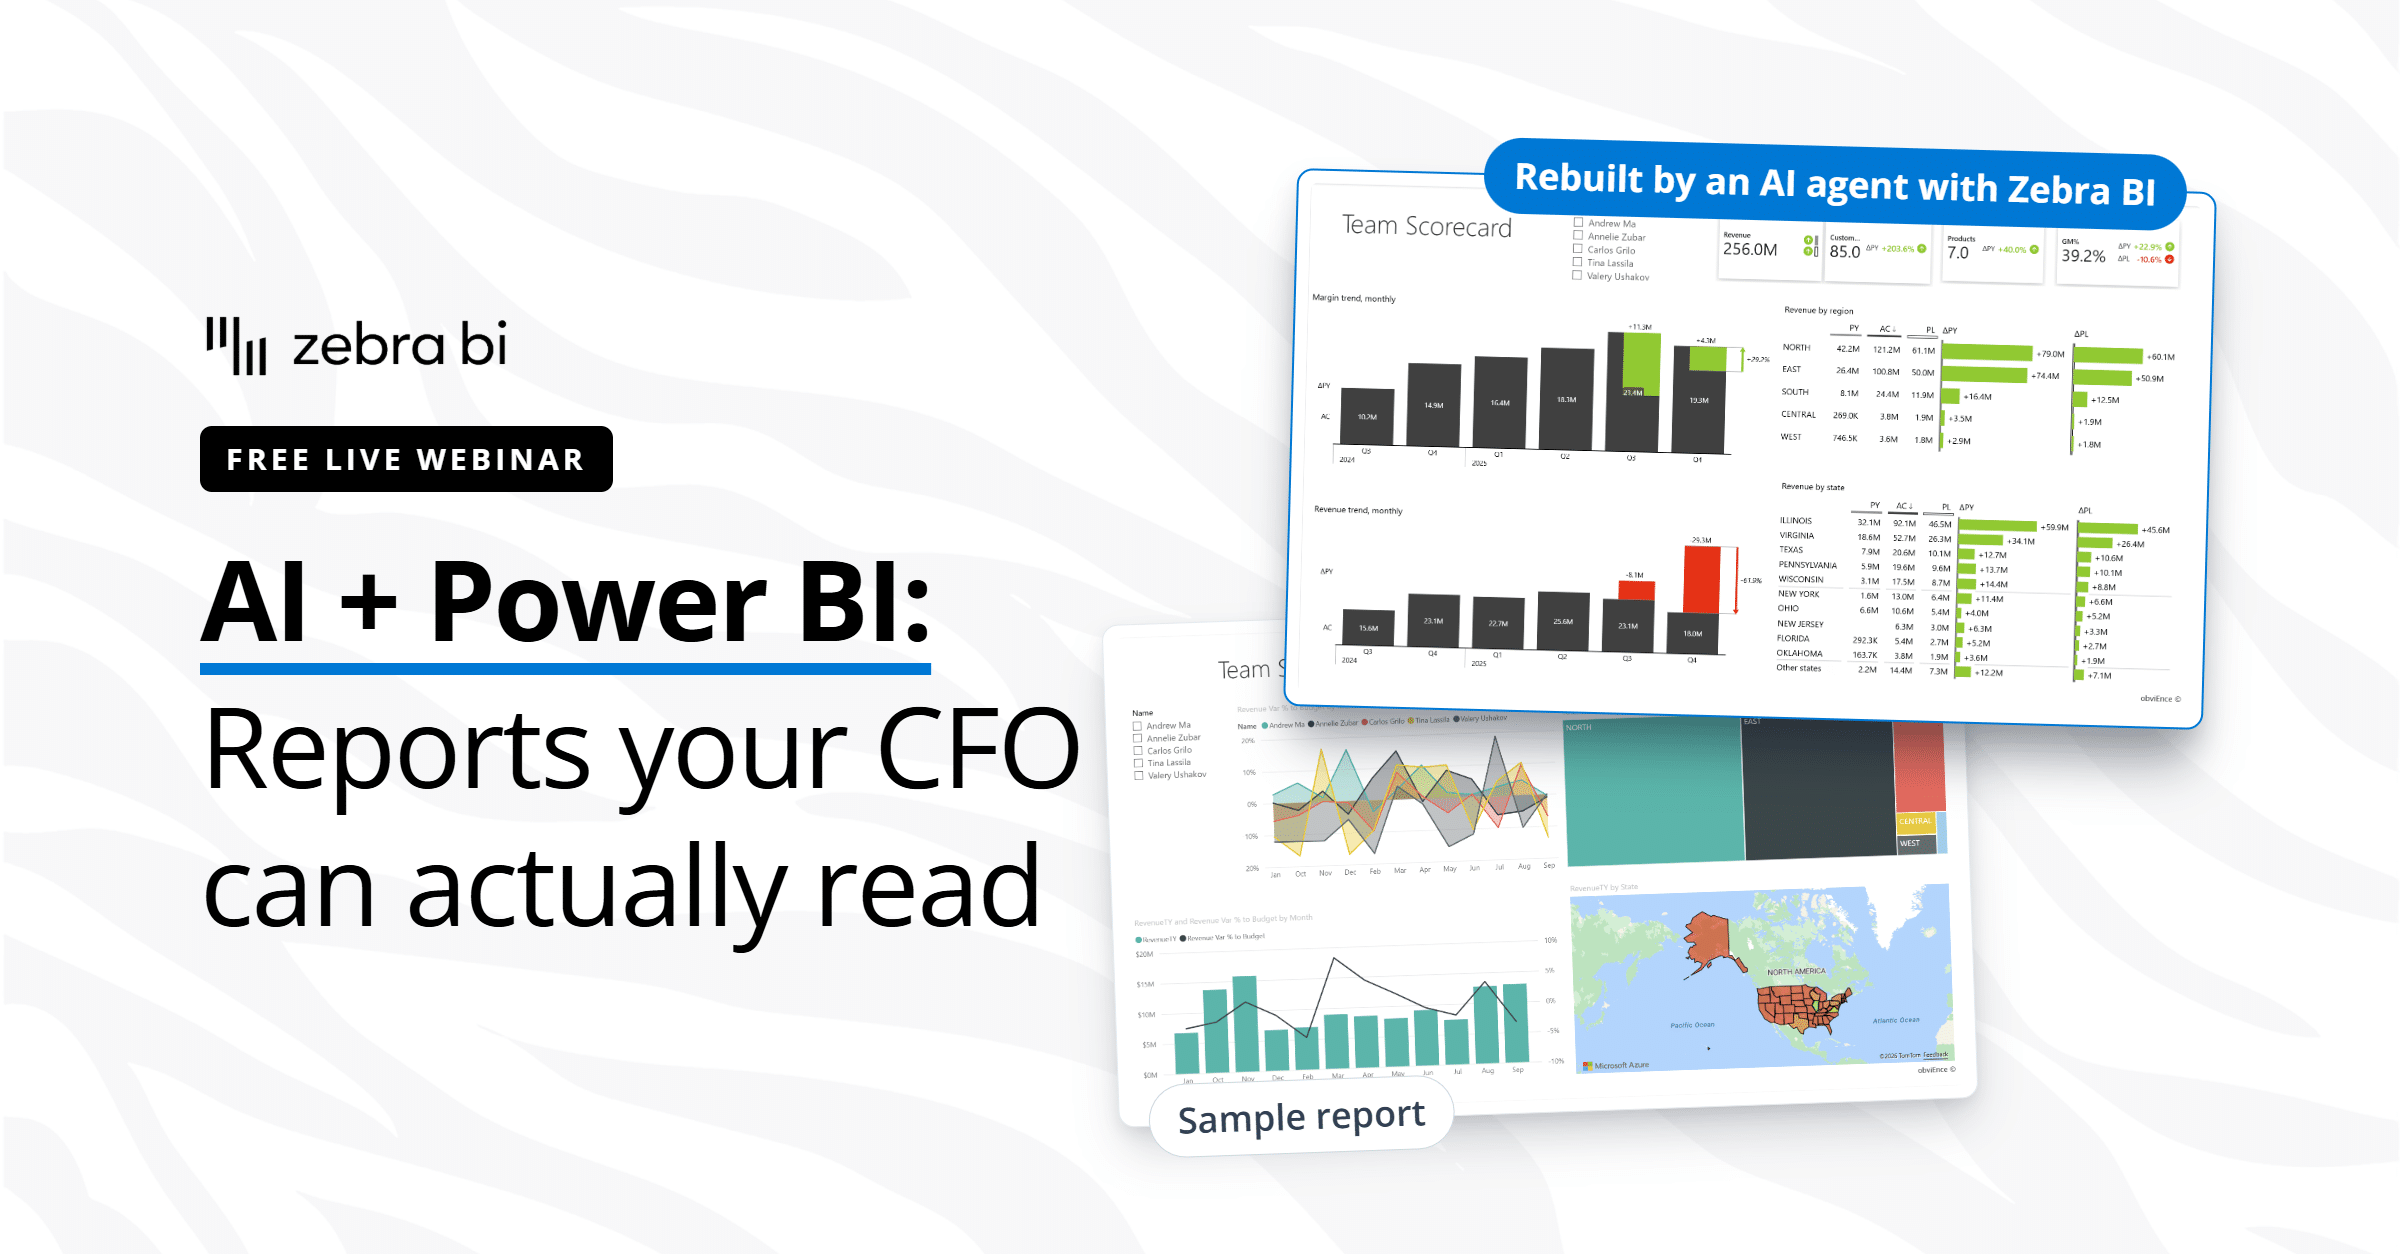
Watch the webinar recording and see a live, unscripted head-to-head: 100 company P&Ls from Colgate Palmolive, Microsoft, Procter & Gamble, Johnson & Johnson, Nvidia and more, built and analyzed in real time using Zebra BI and Zebra AI.

Finance teams have been asking whether dashboards are obsolete. This recording skips the debate. Watch Zebra BI structure 100 P&Ls with no manual formatting, then watch Zebra AI calculate KPIs on the fly, benchmark competitors, and surface insights from a single prompt. Both tools, same dataset. You'll see exactly what each one does best.

What's included

Full video recording
PBIX example used in the webinar
Enjoy & thank you for watching! Don't hesitate to reach out if you have any questions — write to us at support@zebrabi.com!

Presenters

Andrej Lapajne

Founder, Zebra BI

Mark Leskovšek

BI Solutions Director, Zebra BI

Watch the Video

Example files
Download our example files and try it on your own with ease.
Access the materials
0:00 - Introduction: Dashboards vs AI
1:44 - The Dataset: 100 Companies, 10 Industries, 5 Years of Public Financial Data
3:24 - Data Modeling: Account Mapping & Star Schema in Power BI
6:44 - How We Scraped 100 Company Financials with Power Query
14:11 - Live Demo: Building a P&L with Zebra BI
18:29 - Live Demo: Zebra AI Connects to the Same Semantic Model
24:58 - Benchmarking & KPI Calculation On the Fly in Zebra AI
28:44 - Replicating in Power BI: Trends, Benchmarks & Commentary
46:19 - Ad Hoc Analysis
1:00:27 - Wrap-Up: Dashboards and AI, Better Together
1:05:55 - Q&A
Share this

Ready to start uncovering actionable insights from your data?

Explore Zebra BI for Office and Power BI, or start a trial instantly and test our tools on your data. You can also contact us to help you build your first test report and create a custom package for your business.

More Trending Webinars

November 6, 2025
Zebra BI Partner Pulse Webinar
A new webinar series for Zebra BI partners — get the latest updates, explore new tools, and stay closely connected with the Zebra BI team.
Watch now
Upcoming
September 15, 2026
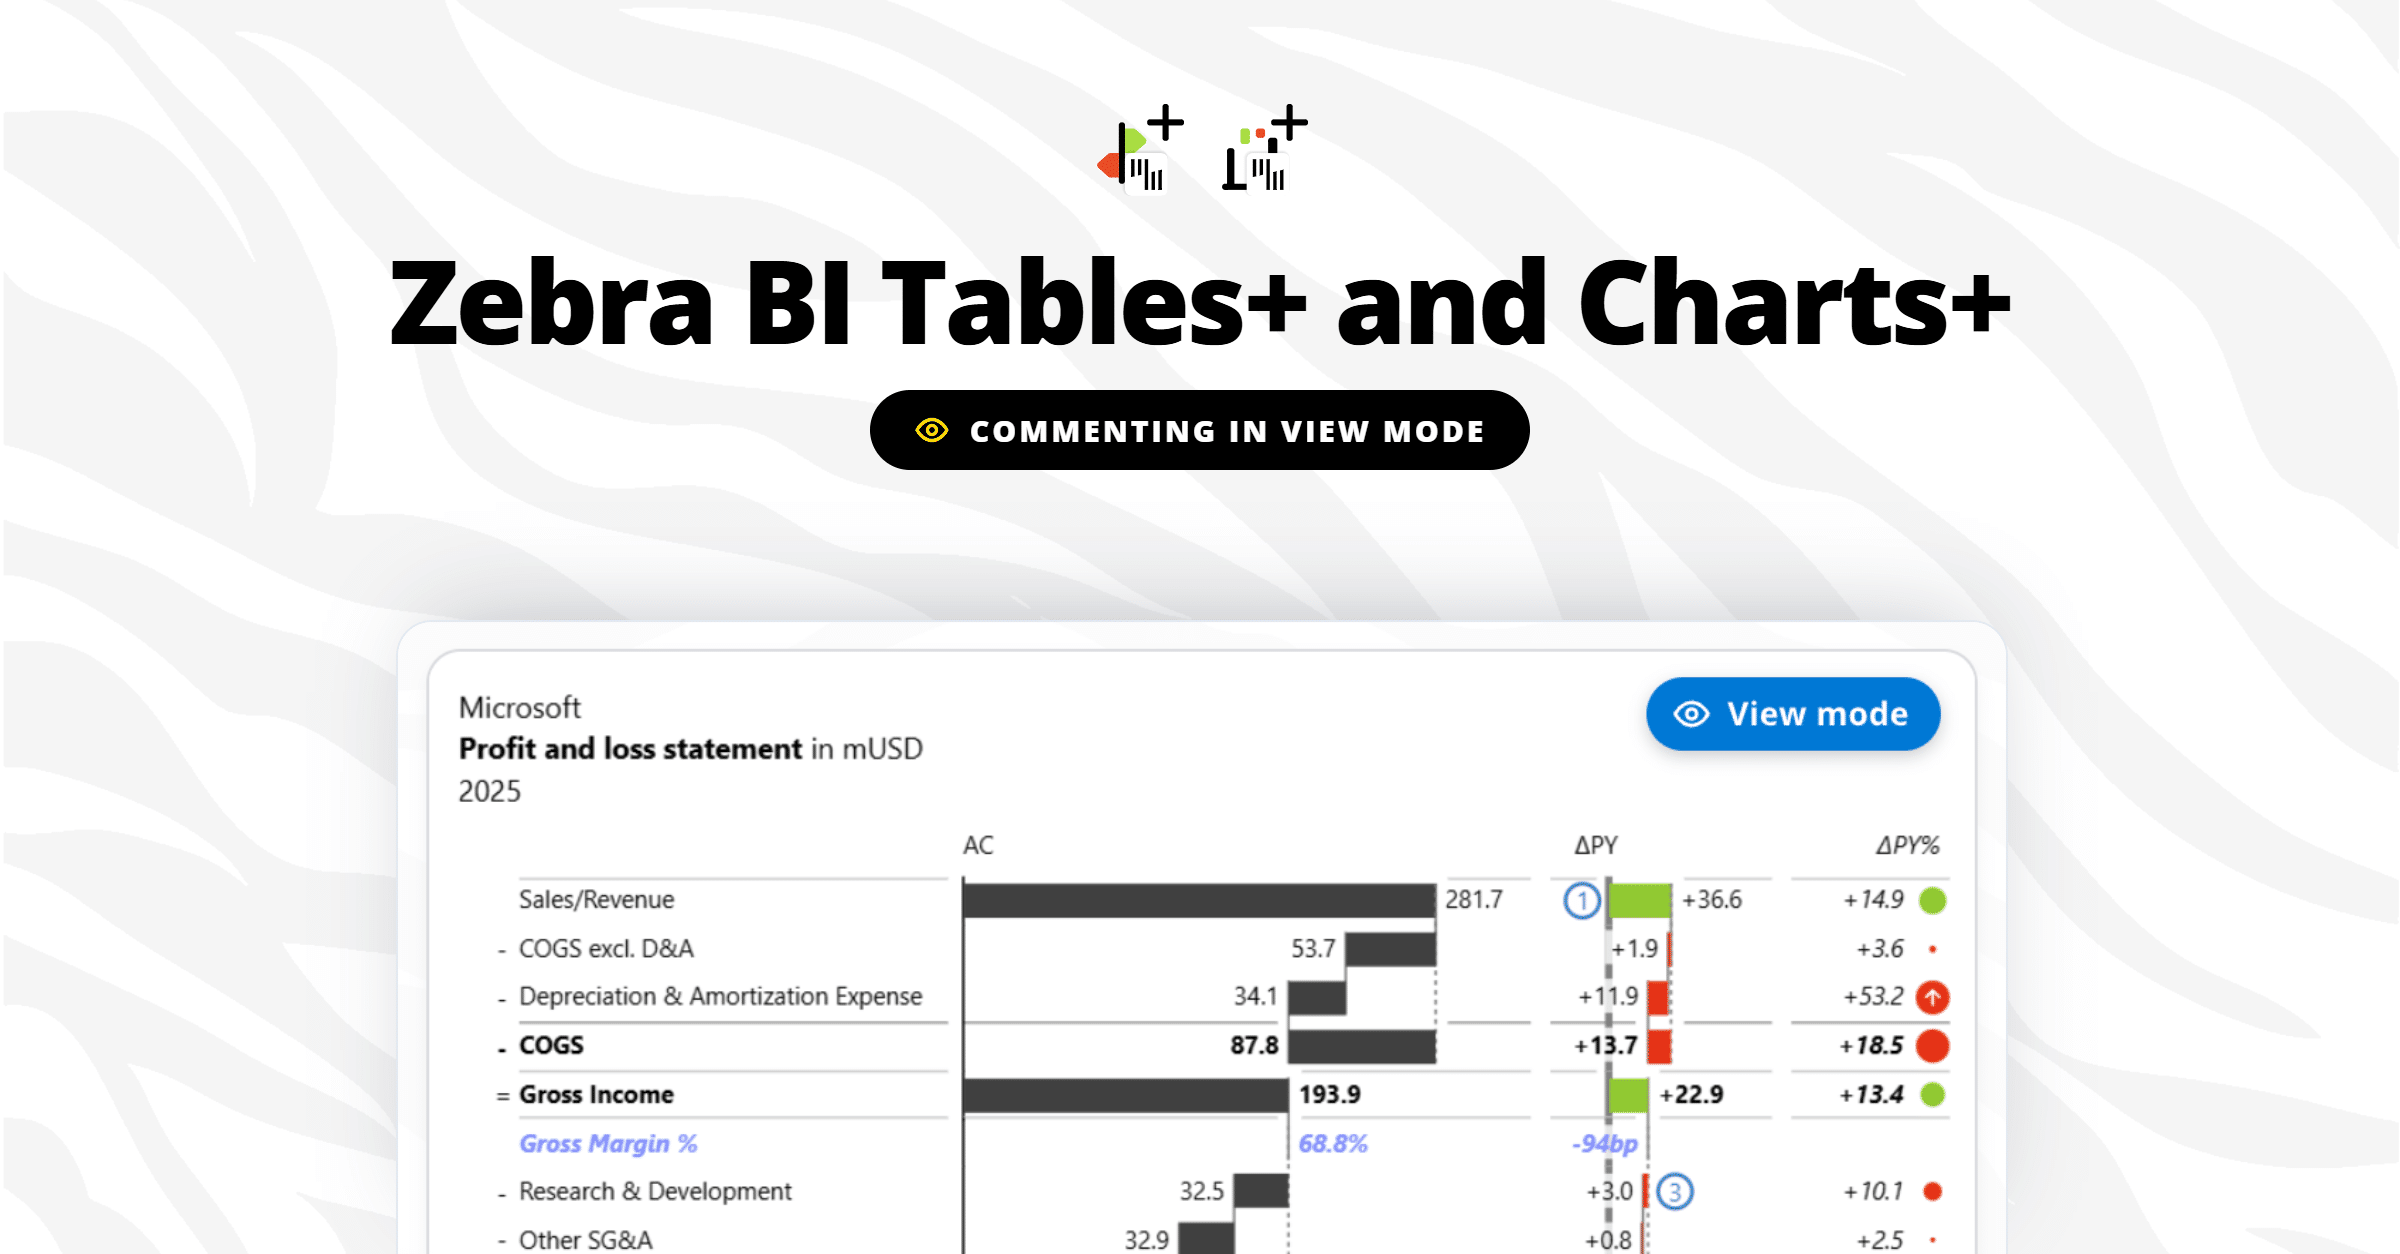
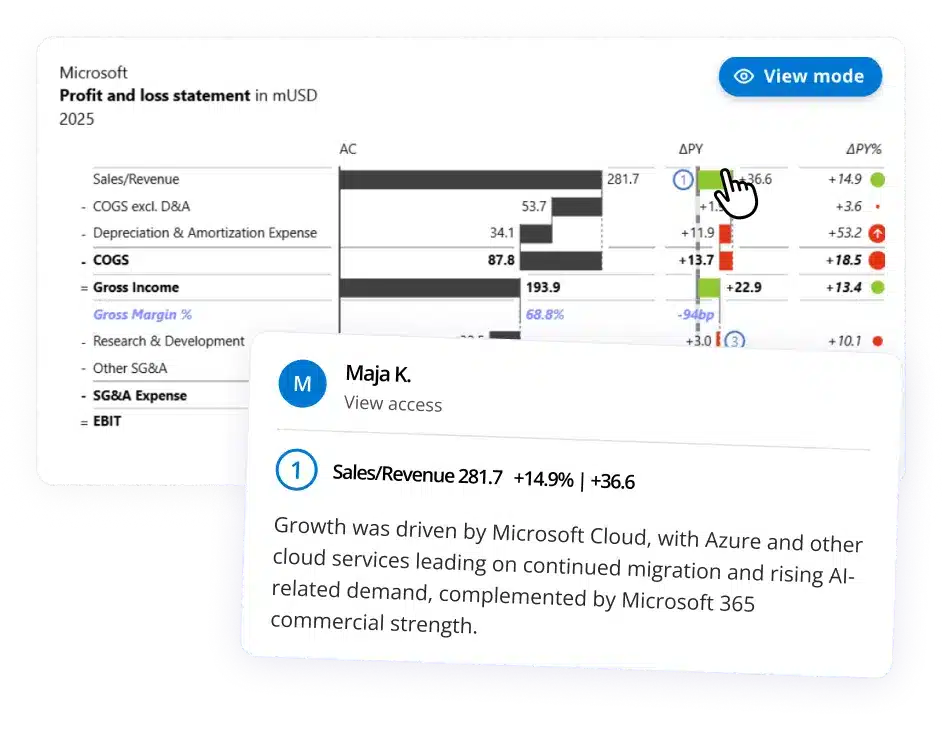
Introducing viewer commenting in Power BI: Zebra BI Tables+ & Charts+
Report viewers can finally comment right on the data, in view mode, with no Power BI edit access. Andrej Lapajne and Mark Leskovšek launch Zebra BI Tables+ and Charts+ live on a real report, then take your questions.
Register
March 26, 2026
How teams cross the Last Mile
Your reports are ready. Decisions aren't. Learn how to close the Last Mile - live Power BI build, real client case, actionable framework. Free, 60 min.
Watch now
April 23, 2026
Power BI reporting that actually works: 3 real teams, real results
Your reports are ready. Decisions aren't. Learn how to close the Last Mile - live Power BI build, real client case, actionable framework. Free, 60 min.
Watch now
March 5, 2026
Why BI fails in the Last Mile - How top teams turn reports into decisions
Your dashboards look great. Decisions still lag. Find out why - and what top teams do differently to close the gap between insight and action.
Watch now
Browse All Resources