Happy Valentine's Day! But hey, where is the romance?
It is Valentine's Day today, so we created a quick analysis with our Zebra BI to see if data on Valentine's Day spending and gifts conveys any important messages. It turns out it does.
More spending, less time for romance?
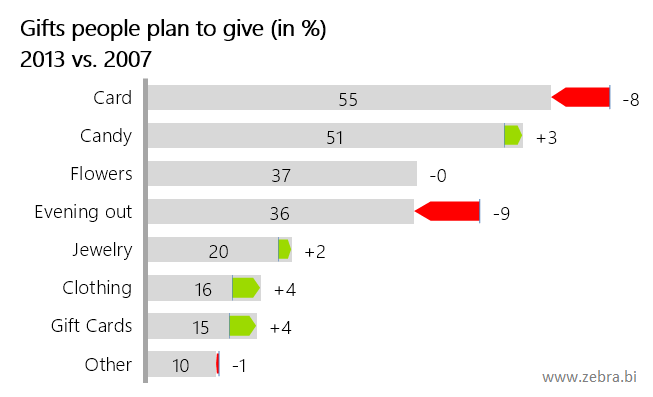
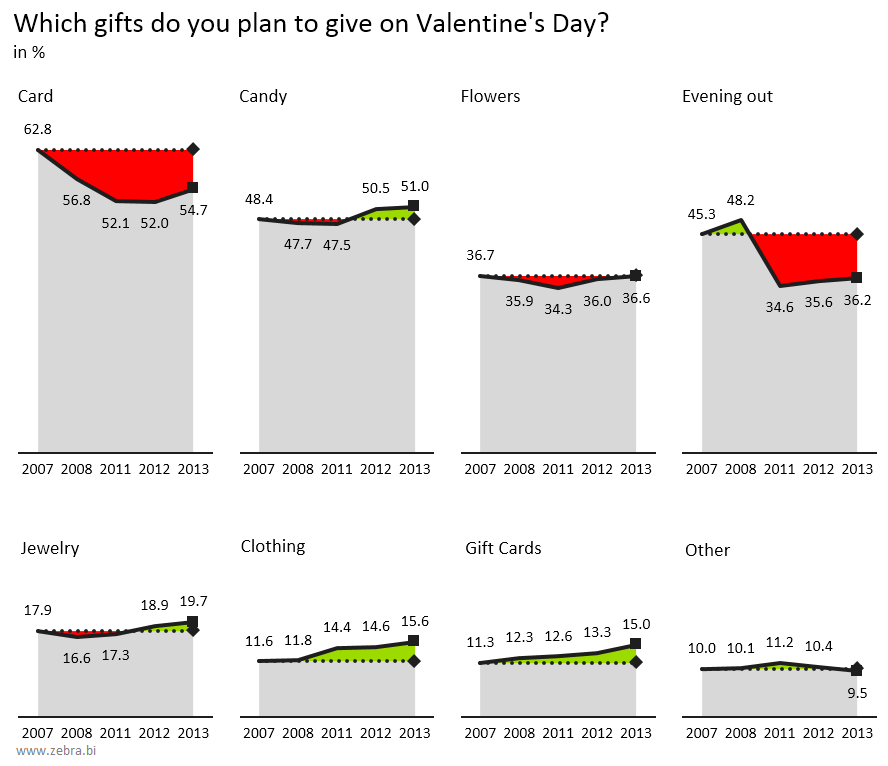
According to the data from BIGinsight, people give 8% fewer Valentine's cards and take their partners for an evening out 9% less than in 2007. On the other hand, we buy more candy, more jewellery, more clothing and give 4% more gift cards for shopping. Hey, where's the romance gone?
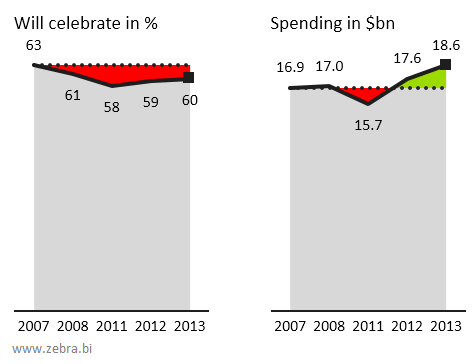
The next analysis reveals how the financial crisis influenced Valentine's day spending and also the time we plan to spend for the celebration of Valentine's Day with our loved ones. The spending went down significantly from 2007 to 2011, but it rapidly grows since then. More surprising is the fact that even while the spending is growing, the percent of people who intend to celebrate Valentine's day with their loved ones has not really recovered. So the advertisers did a good job, but we have not... It should be quite the opposite, don't you agree?
Less for our partners, more for pets
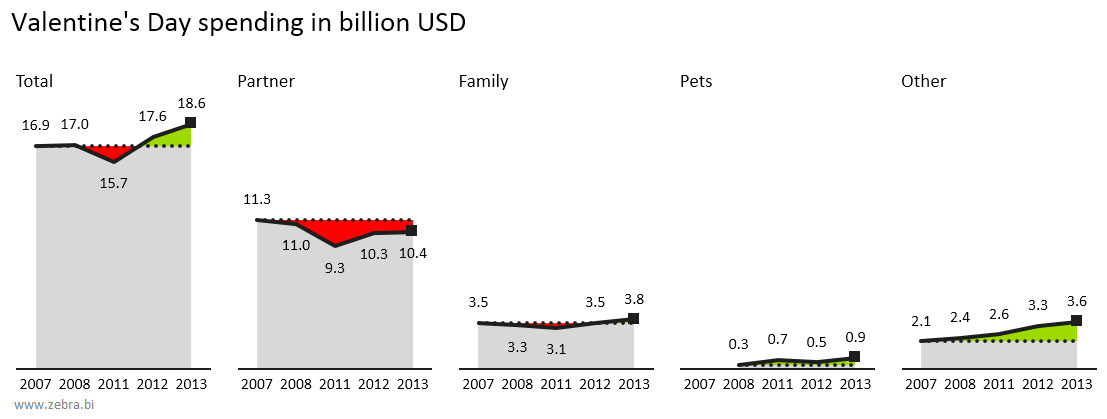
If we compare the spending by categories we can conclude that compared to 2007 we now spend less for our significant others and spouses and more for our pets. Well... good for the pets. The trend of spending for partners directly correlates to the percentage of people planning to celebrate Valentine's Day on the analysis above. I would guess it is still a little hard to celebrate this day with the pets:
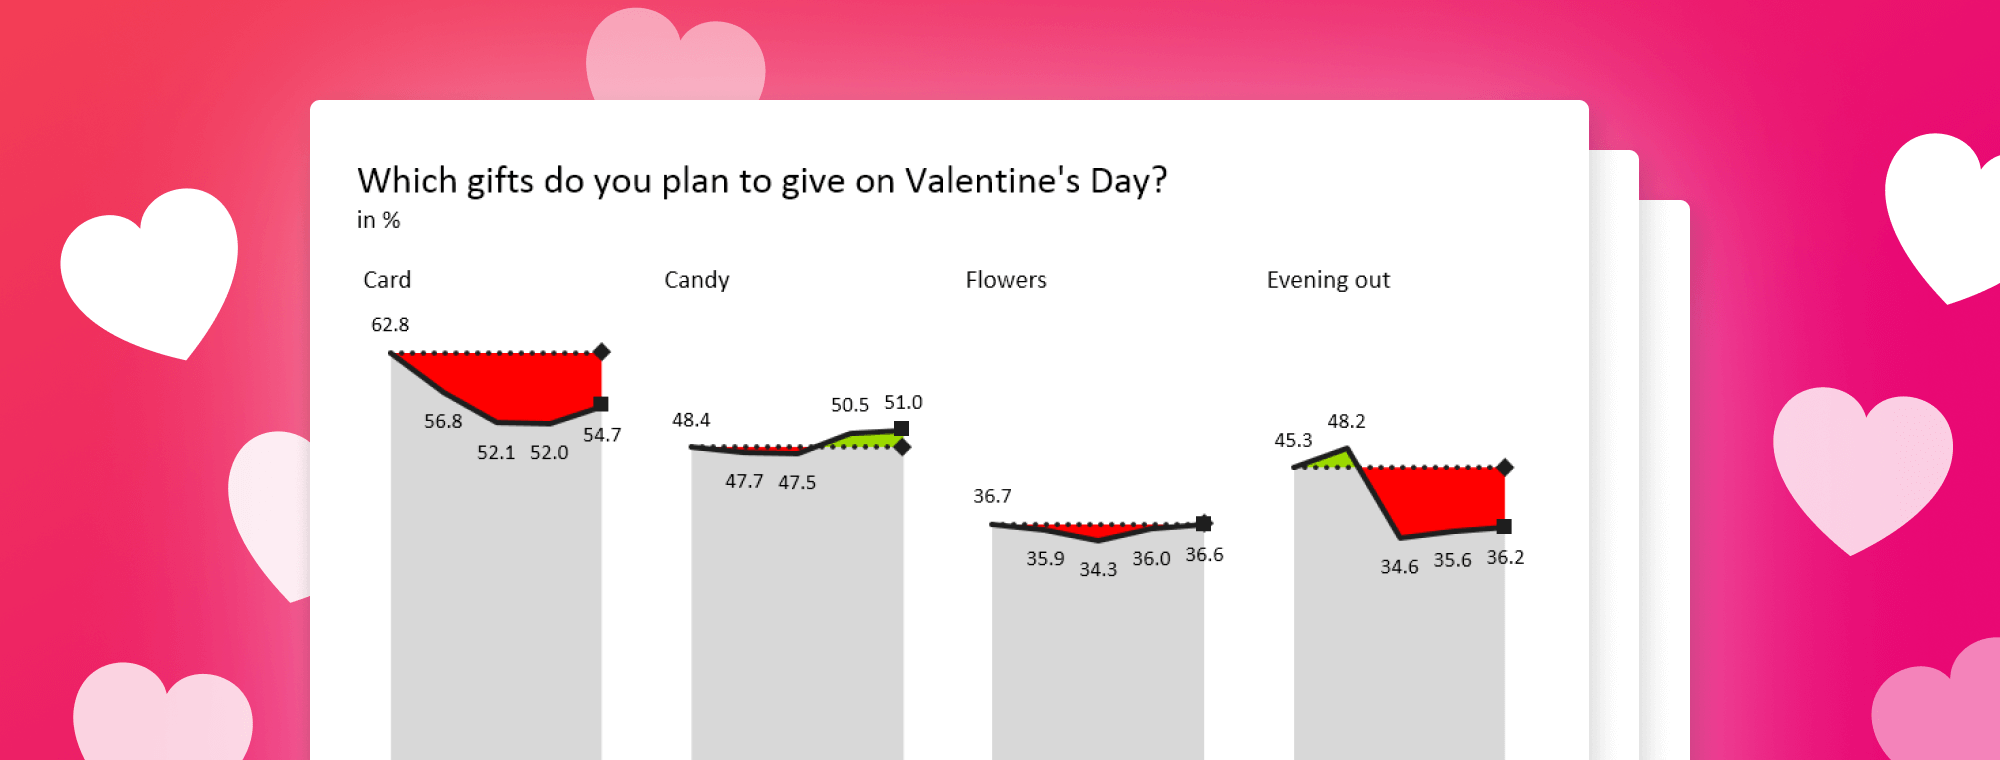
Finally, let us see how our habits changed during the years 2007 to 2013. It is obvious that the crisis affected the spending, especially for going out in the evening. However, people do buy more candy, more jewellery, more clothes and give more gift cards for shopping:
Now I know what I will do today: write a lovely message on a card for my wife and take her out in the evening.
Happy Valentine's!
P.S. In all the charts above the time series is not equidistant, which produces a "lie factor". Unfortunately the years 2009 and 2010 are missing in the source data. It would be more correct to show this trend break in the above charts, but then I would miss the date with my wife. So I will leave this improvement for the next year...