How to Perform Pricing Analysis in Excel
If you’re a business owner, you know that pricing is one of the most crucial components of your business. It has a significant impact on your bottom line and can make or break your profitability. Therefore, it’s essential to have a solid pricing strategy for your products or services. One of the best tools for conducting comprehensive pricing analysis is Microsoft Excel. Excel is widely used and offers many features that help organize and analyze data. In this article, we’ll discuss how you can use Excel to perform pricing analysis for your business.
Introduction to Pricing Analysis
Pricing analysis is the process of analyzing and evaluating the effectiveness of your pricing strategies. It involves conducting detailed research to determine your customers’ willingness to pay, understanding your competitors’ pricing structures, and analyzing your own pricing strategies.
One of the key benefits of pricing analysis is that it helps businesses to optimize their pricing strategies. By understanding what customers are willing to pay, businesses can set prices that are both competitive and profitable. Additionally, pricing analysis can help businesses identify areas where they may be able to increase prices without negatively impacting sales.
Another important aspect of pricing analysis is the ability to identify pricing trends over time. By tracking changes in pricing over time, businesses can gain insights into how their pricing strategies impact sales and profitability. This information can be used to make informed decisions about future pricing strategies and to adjust pricing as needed to stay competitive in the market.
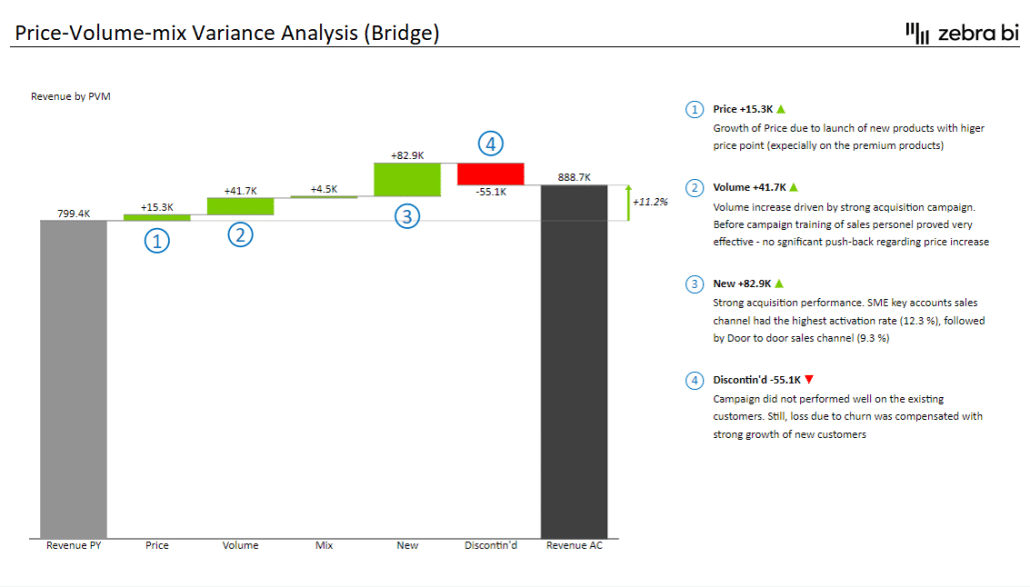
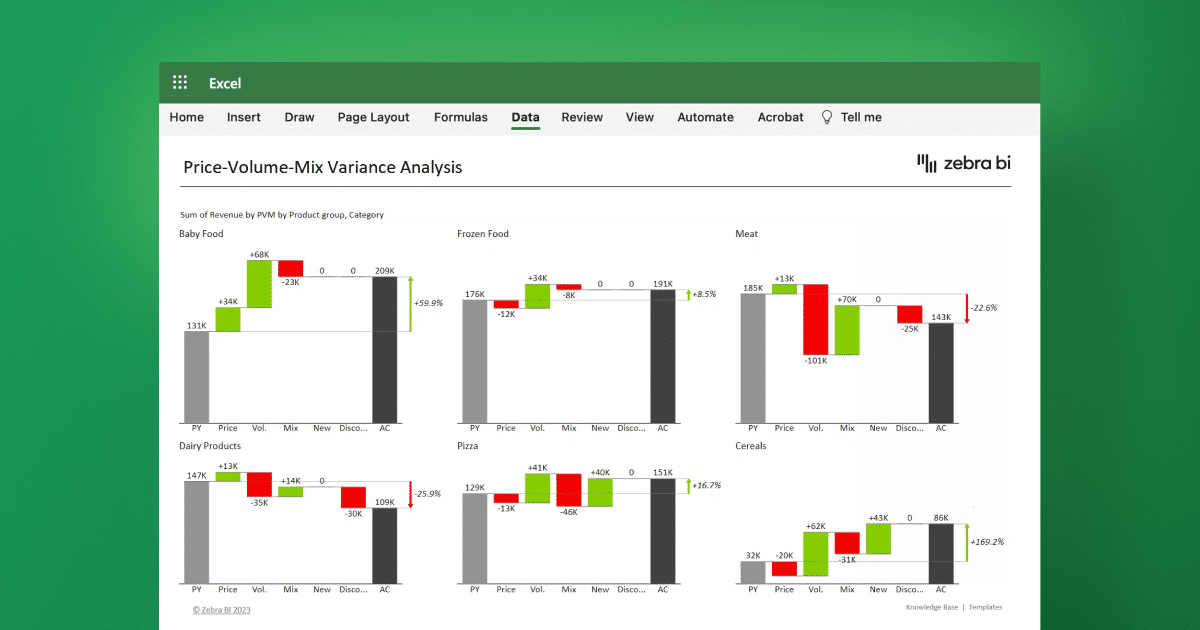
Learn more about pricing analysis and how to calculate price, volume, and mix effect on your sales: Price Volume Mix Analysis: Here's how to do it in Excel
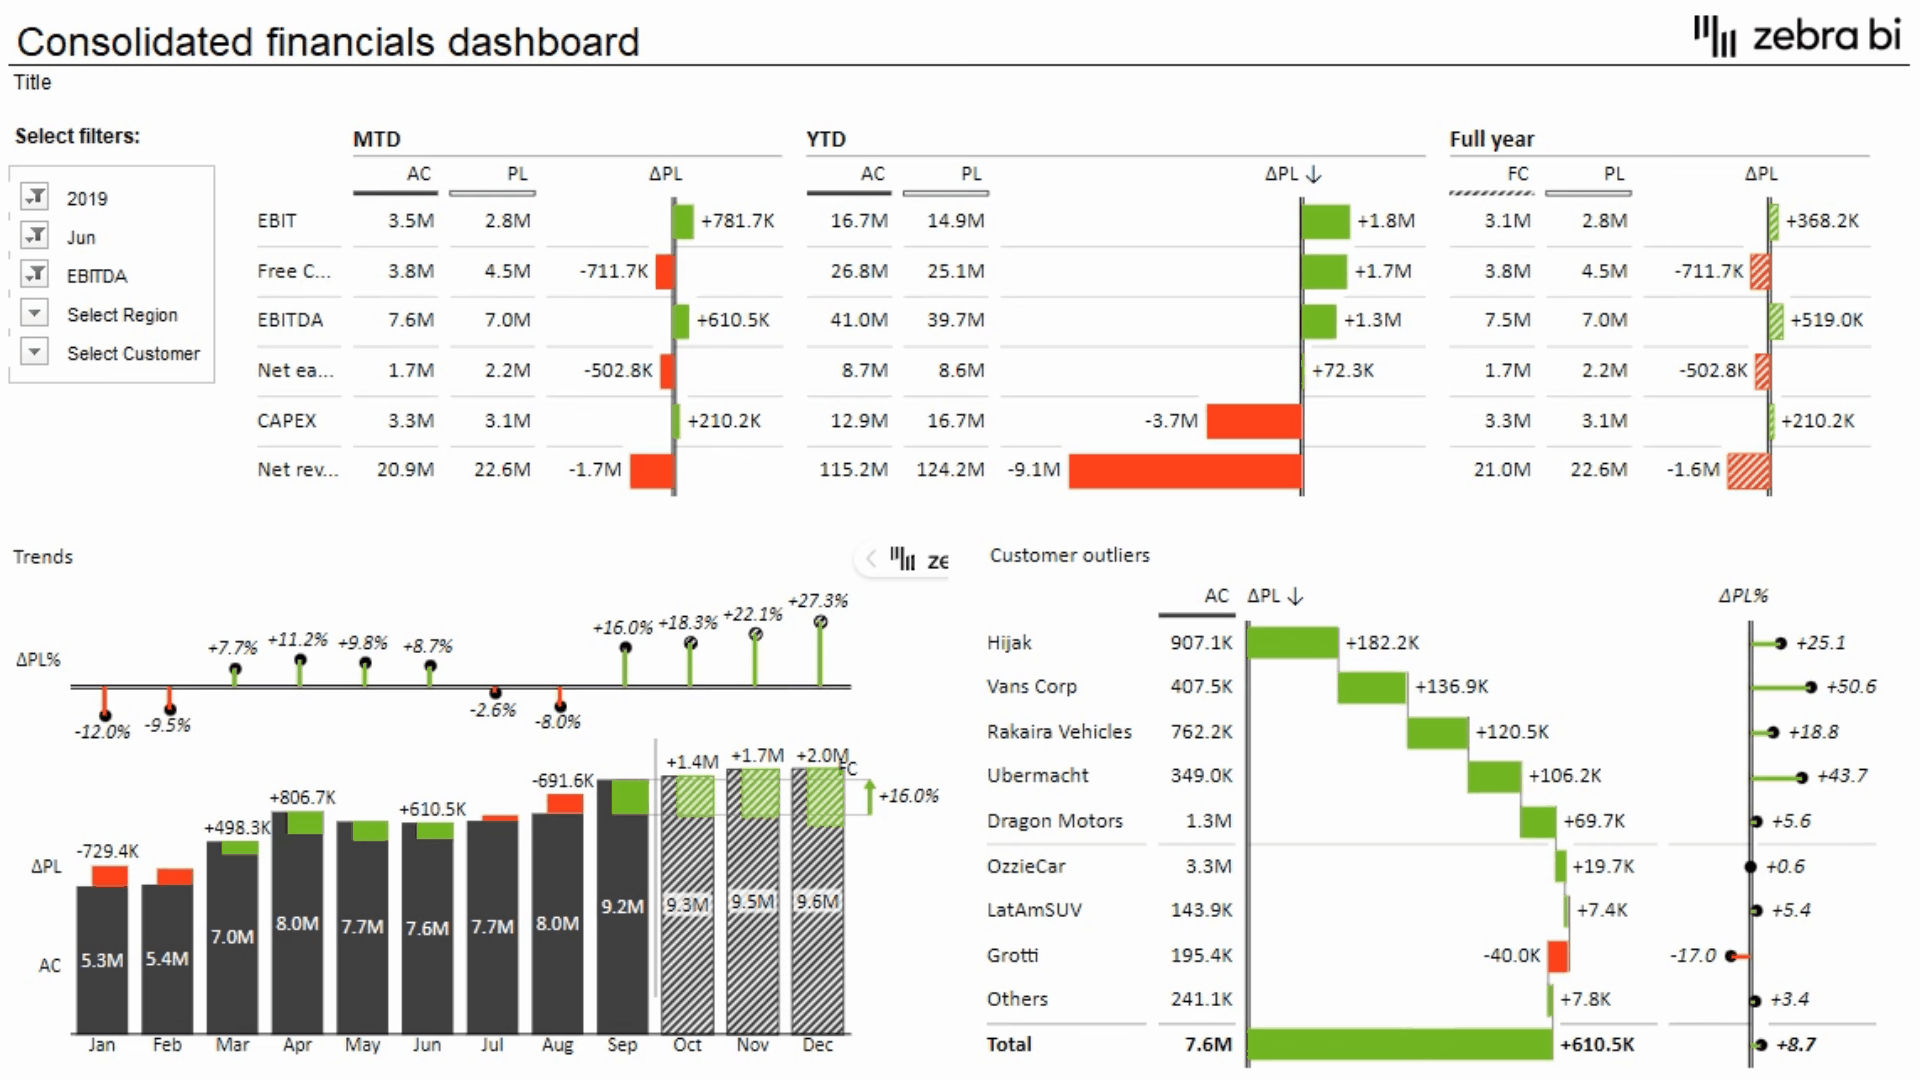
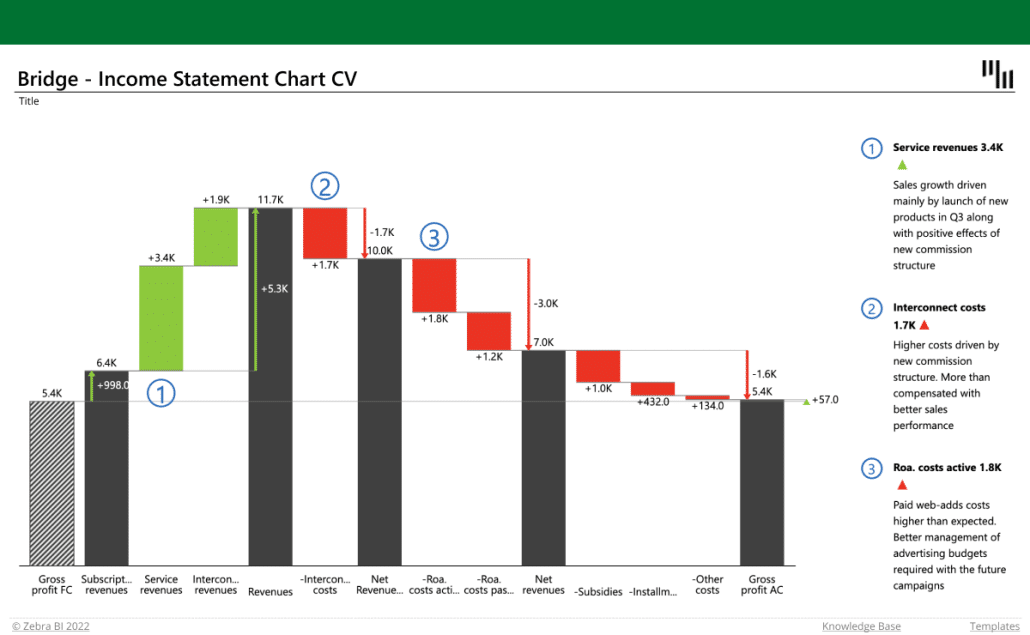
When transferring the message of your pricing (Price-Volume-Mix) analysis, the most effective way is the waterfall chart.
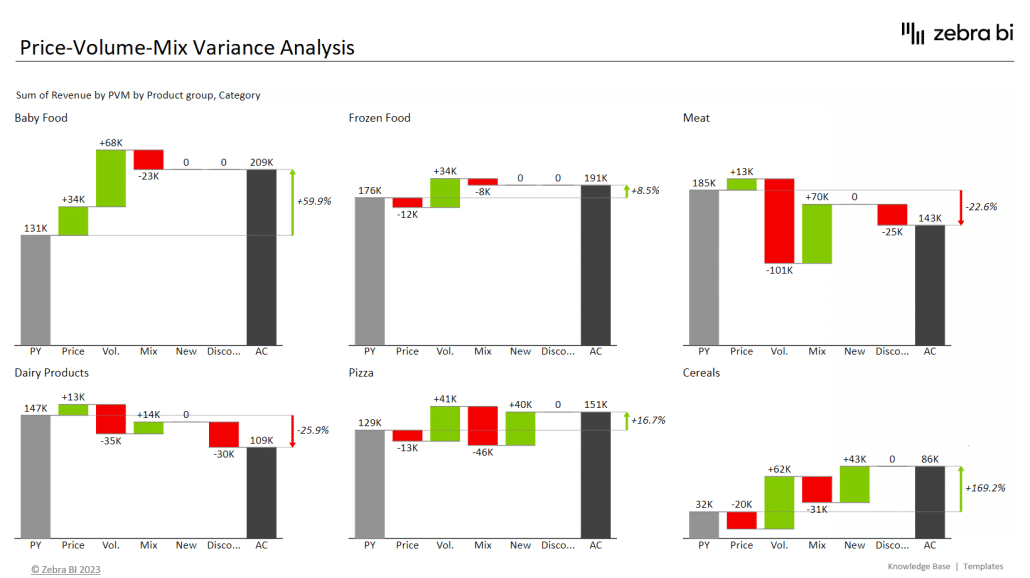
The Zebra BI Waterfall Chart explains the movement for each group very clearly.
- Are the prices going down, or are we selling more?
- What is happening with our product mix, and are we pushing more profitable products?
- What is pushing a certain product category forward?
These are the types of questions you can now answer with ease. Actually, everyone looking at the results can.
Understanding the Importance of Pricing in Business
Pricing is essential in business because it determines your profit margins, affects sales volume, and impacts your market position. If you set prices too high, you risk losing potential customers to your competitors. If you set prices too low, you may not make enough profit to keep your business going. Therefore, it’s crucial to have a solid pricing strategy that aligns with your business goals.
When setting prices, one important factor is the value your product or service provides to your customers. If your product or service offers unique features or benefits that are not available from your competitors, you may be able to charge a premium price. On the other hand, if your product or service is similar to what is already available in the market, you may need to price it competitively to attract customers.
The Role of Excel in Pricing Analysis
Excel is an invaluable tool for pricing analysis because it helps you easily organize, manipulate, and analyze large data sets. Some of the features that Excel offers for pricing analysis include pivot tables, data sorting, filtering, and charts. Excel’s user-friendly interface and advanced functions allow businesses to perform detailed pricing analyses quickly and accurately.
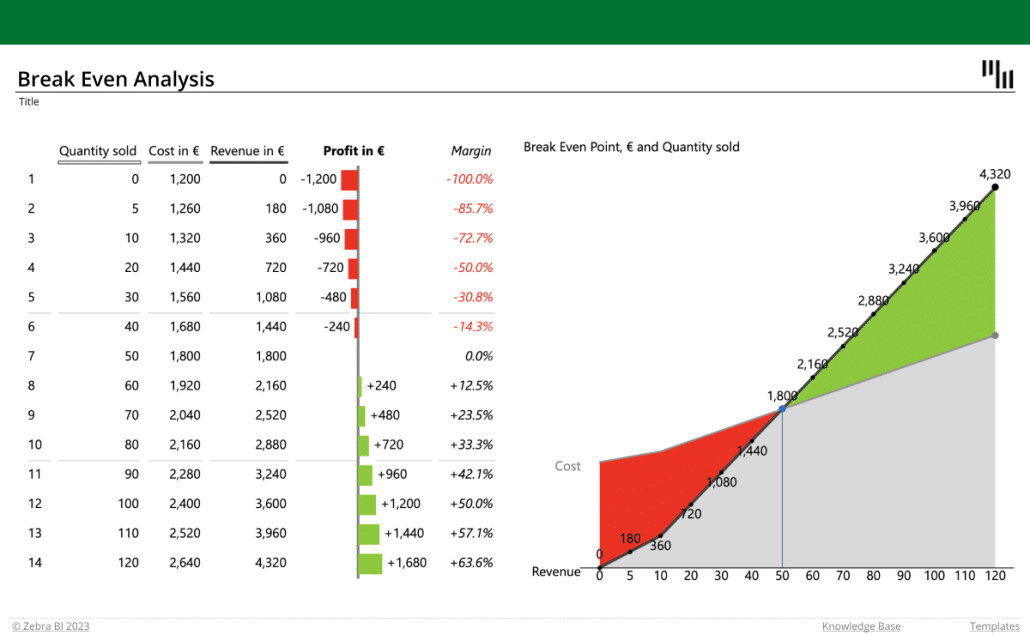
Another advantage of using Excel for pricing analysis is its ability to handle complex calculations. Excel’s built-in formulas and functions allow businesses to perform various pricing calculations, such as markup, margin, and break-even analysis. These calculations can be performed quickly and accurately, saving businesses time and reducing the risk of errors.
Furthermore, Excel’s flexibility allows businesses to customize their pricing analysis to fit their specific needs. Businesses can create their own pricing models and formulas and easily adjust them as needed. This allows businesses to stay competitive in their industry by adapting to changes in the market and adjusting their pricing strategies accordingly.
How to Set up Your Pricing Analysis in Excel
The first step in conducting pricing analysis in Excel is to set up your spreadsheet. Start by creating a table that includes all the relevant data, such as product pricing, sales volume, and your competitors’ pricing. You can also include data such as customer demographics, market trends, and seasonality. Your table should be clean and easy to read, so use formatting tools such as borders and font sizes to make it visually appealing.
Once you have set up your table, it's time to analyze the data. One useful tool in Excel for pricing analysis is the scatter plot. This allows you to visualize the relationship between your product pricing and sales volume, as well as your competitors' pricing. You can also use Excel's built-in functions, such as the average and standard deviation, to calculate key metrics and identify trends.
Another important aspect of pricing analysis is understanding your target market. By segmenting your customers based on demographics, such as age, gender, and income, you can better understand their purchasing behavior and tailor your pricing strategy accordingly. Excel's pivot tables and charts can be useful for analyzing customer data and identifying patterns.
Gathering and Organizing Data for Effective Analysis
The next step is to gather and organize data for effective analysis. This includes customer surveys, market research, and data from your own sales. You can also import data from external sources such as online databases and competitor websites. Once you have all the data, organize it in a logical manner within your Excel sheet.
It is important to ensure that the data you gather is accurate and relevant to your analysis. This means double-checking your sources and verifying the data before inputting it into your Excel sheet. Additionally, consider the timeframe of the data you are gathering and whether it is still relevant to your current analysis. By taking these steps, you can ensure that your analysis is based on reliable and up-to-date information.
Creating Formulas and Charts for Pricing Analysis
One of the biggest advantages of using Excel for pricing analysis is the ability to use formulas and charts to analyze data. Use formulas such as average, standard deviation, and regression to calculate key pricing metrics such as profit margins and customer lifetime value. You can also use charts to visualize data trends, making it easier to identify patterns and gain insights into pricing strategies.
Additionally, Excel allows you to create interactive dashboards that can display real-time pricing data. This can be especially useful for businesses that need to make quick pricing decisions based on market changes or competitor activity. With the ability to customize charts and graphs, you can create a dashboard that displays the most important pricing metrics for your business, allowing you to make informed decisions and stay ahead of the competition.
Identifying Key Pricing Metrics and KPIs
When conducting pricing analysis, it’s essential to identify key pricing metrics and KPIs (Key Performance Indicators) to monitor. Some of these metrics include profit margins, customer lifetime value, and product revenue. KPIs may include customer acquisition costs, retention, and sales conversion rates. Identifying these metrics and KPIs early on will help you focus on the areas that need improvement and develop better pricing strategies for your business.
Another important pricing metric to consider is price elasticity, which measures how sensitive customers are to changes in price. This can help you determine the optimal price point for your products or services. Additionally, analyzing competitor pricing can provide valuable insights into market trends and help you stay competitive.
It’s also important to regularly review and adjust your pricing metrics and KPIs as your business evolves. As you introduce new products or services or as market conditions change, your pricing strategies may need to be adjusted accordingly. By regularly monitoring and analyzing your pricing metrics and KPIs, you can ensure that your pricing strategies are always optimized for success.
Analyzing Data Trends to Optimize Pricing Strategies
Once you have all the data and have identified key metrics and KPIs, it’s time to analyze the trends to optimize your pricing strategies. Use your charts and formulas to identify patterns in customer behavior, such as buying cycles and purchase tendencies. You can also run pricing experiments to test different pricing strategies and see which ones yield the best results. By continuously analyzing data trends and experimenting with new pricing strategies, you can optimize your pricing and improve your overall profitability.
Another important factor to consider when analyzing data trends for pricing optimization is the competitive landscape. It’s important to keep an eye on your competitors’ pricing strategies and adjust your own accordingly. By monitoring their pricing and promotions, you can identify opportunities to differentiate your own pricing and stand out in the market.
Additionally, it’s important to consider the impact of external factors on your pricing strategies. For example, changes in the economy, consumer behavior, or industry trends can all have an impact on your pricing decisions. By staying up-to-date on these external factors and adjusting your pricing strategies accordingly, you can ensure that your pricing remains competitive and profitable.
Best Practices for Conducting Pricing Analysis in Excel
When conducting pricing analysis in Excel, there are several best practices to follow. These include creating a data backup, using naming conventions for your sheets, and keeping your formulas consistent. It’s also important to clearly document your analysis so it’s easy to follow and review for future reference.
Common Mistakes to Avoid When Performing Pricing Analysis
While Excel is an excellent tool for pricing analysis, certain mistakes can affect the accuracy of your analysis. These mistakes include using incomplete data or not organizing your data in a logical manner. Another mistake is not understanding the limitations of Excel and relying solely on its functions instead of considering external factors such as market trends.
Advanced Techniques for More Accurate Analysis Results
Excel offers some advanced techniques that can help make your pricing analysis more accurate. These techniques include using VLOOKUP and MATCH functions, creating pivot tables, and applying conditional formatting. You can also use Excel add-ins and plugins to enhance your analysis. For example, Solver is an add-in that can help you optimize your pricing strategies by finding the best combination of variables to achieve your business goals.
Zebra BI visuals (Tables and Charts) allow for the design of a clear and concise presentation of analysis results. IBCS-compliant visuals with automatically calculated, formatted, and scaled variances that will improve your process from data to insight and accurate actions.
To further increase the engagement and understanding of your report, you should include comments with comments markers:
Using Excel Add-Ins and Plugins to Enhance Your Pricing Analysis
Excel add-ins and plugins can significantly enhance your pricing analysis. Some popular add-ins and plugins include Solver, Data Analysis Toolpak, and Power Query. Solver helps you find optimal solutions to complex problems, while Data Analysis Toolpak provides advanced statistical analysis tools. Power Query helps you clean and transform large data sets, making them easier to analyze and use in your pricing analysis.
Real-World Examples of Successful Pricing Strategies Using Excel Analysis
Many businesses have successfully used Excel to develop and implement pricing strategies that have yielded significant results. For example, American Express used pricing analysis in Excel to identify discrepancies in its pricing models and make the necessary adjustments, resulting in a 9% increase in profit margins. Another example is Frito-Lay, which used Excel to analyze customer behavior and optimize its pricing strategies, resulting in a 5% increase in sales.
Conclusion: The Benefits of Using Excel for Your Pricing Analysis Needs
In conclusion, using Excel for pricing analysis offers many benefits for businesses. Excel allows you to organize and analyze large data sets, identify key metrics and KPIs, visualize data trends, and optimize pricing strategies. By continuously analyzing and experimenting with your pricing strategies, you can improve your overall profitability and gain a competitive edge in your market.