Back to Templates for PowerPoint
Last update:

Market Analysis PowerPoint Charts

Create a highly insightful presentation in seconds with these advanced, interactive market analysis PowerPoint charts. Use them to deliver an actionable data story that provides a better look at your market and competitors & helps you make the right decisions faster.
Overview
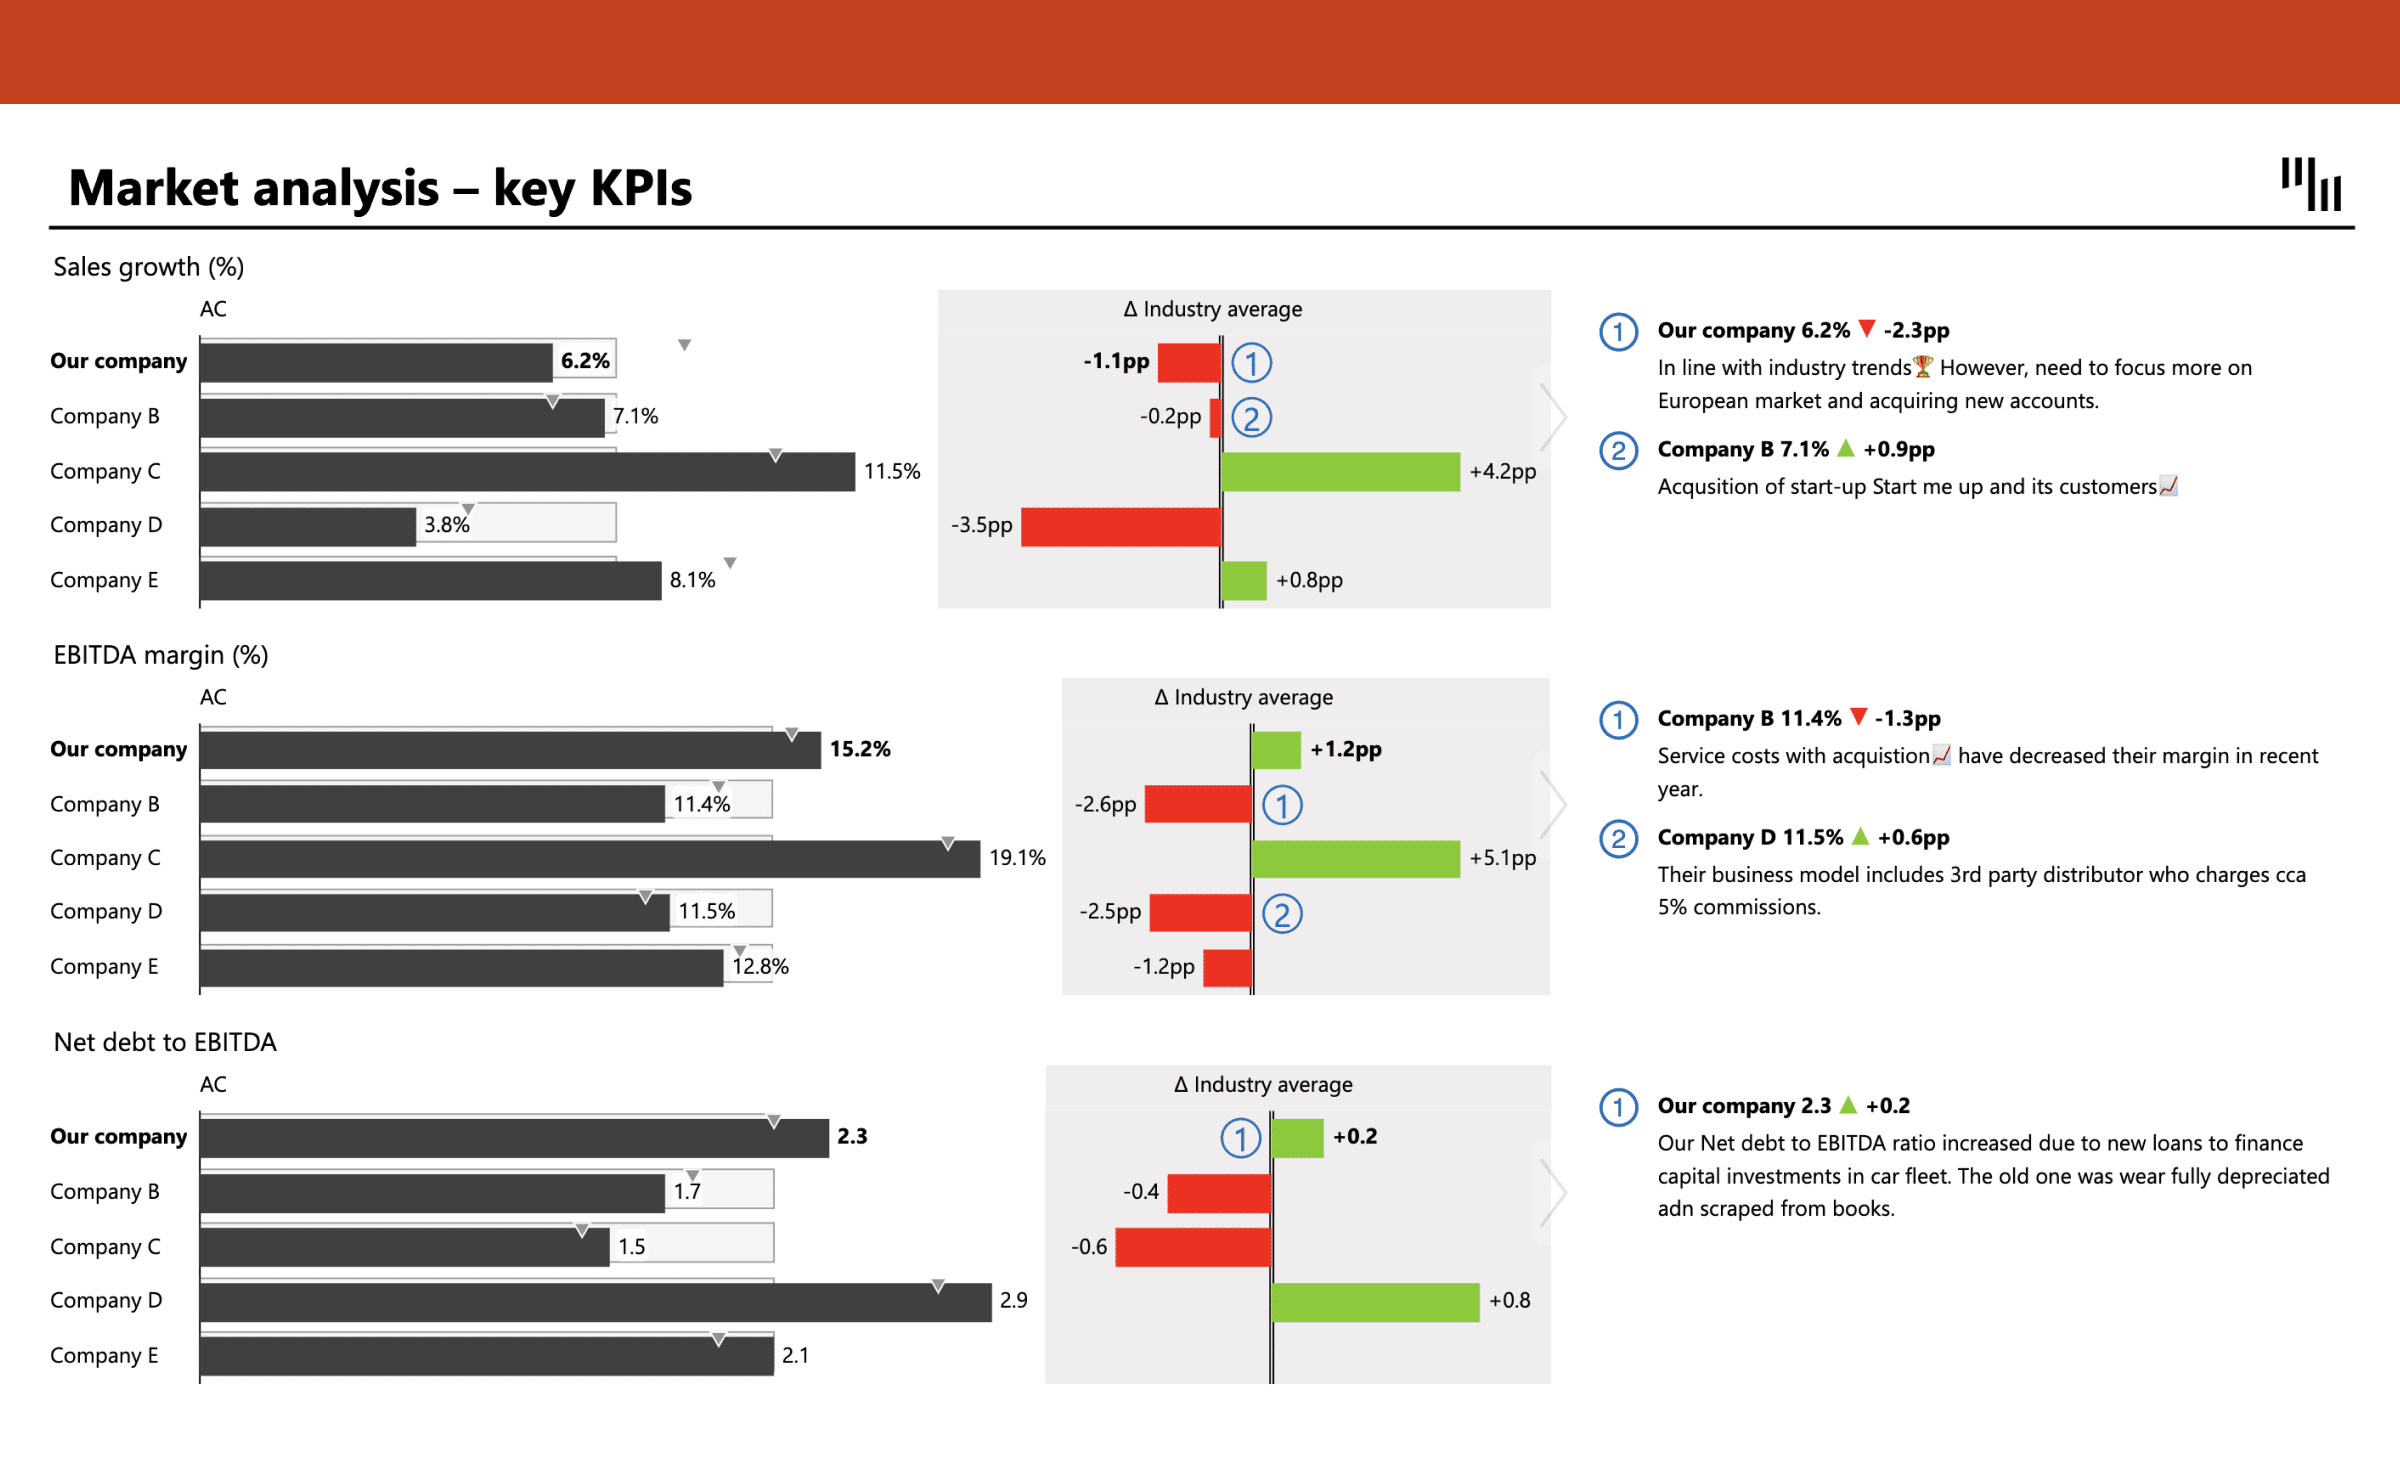
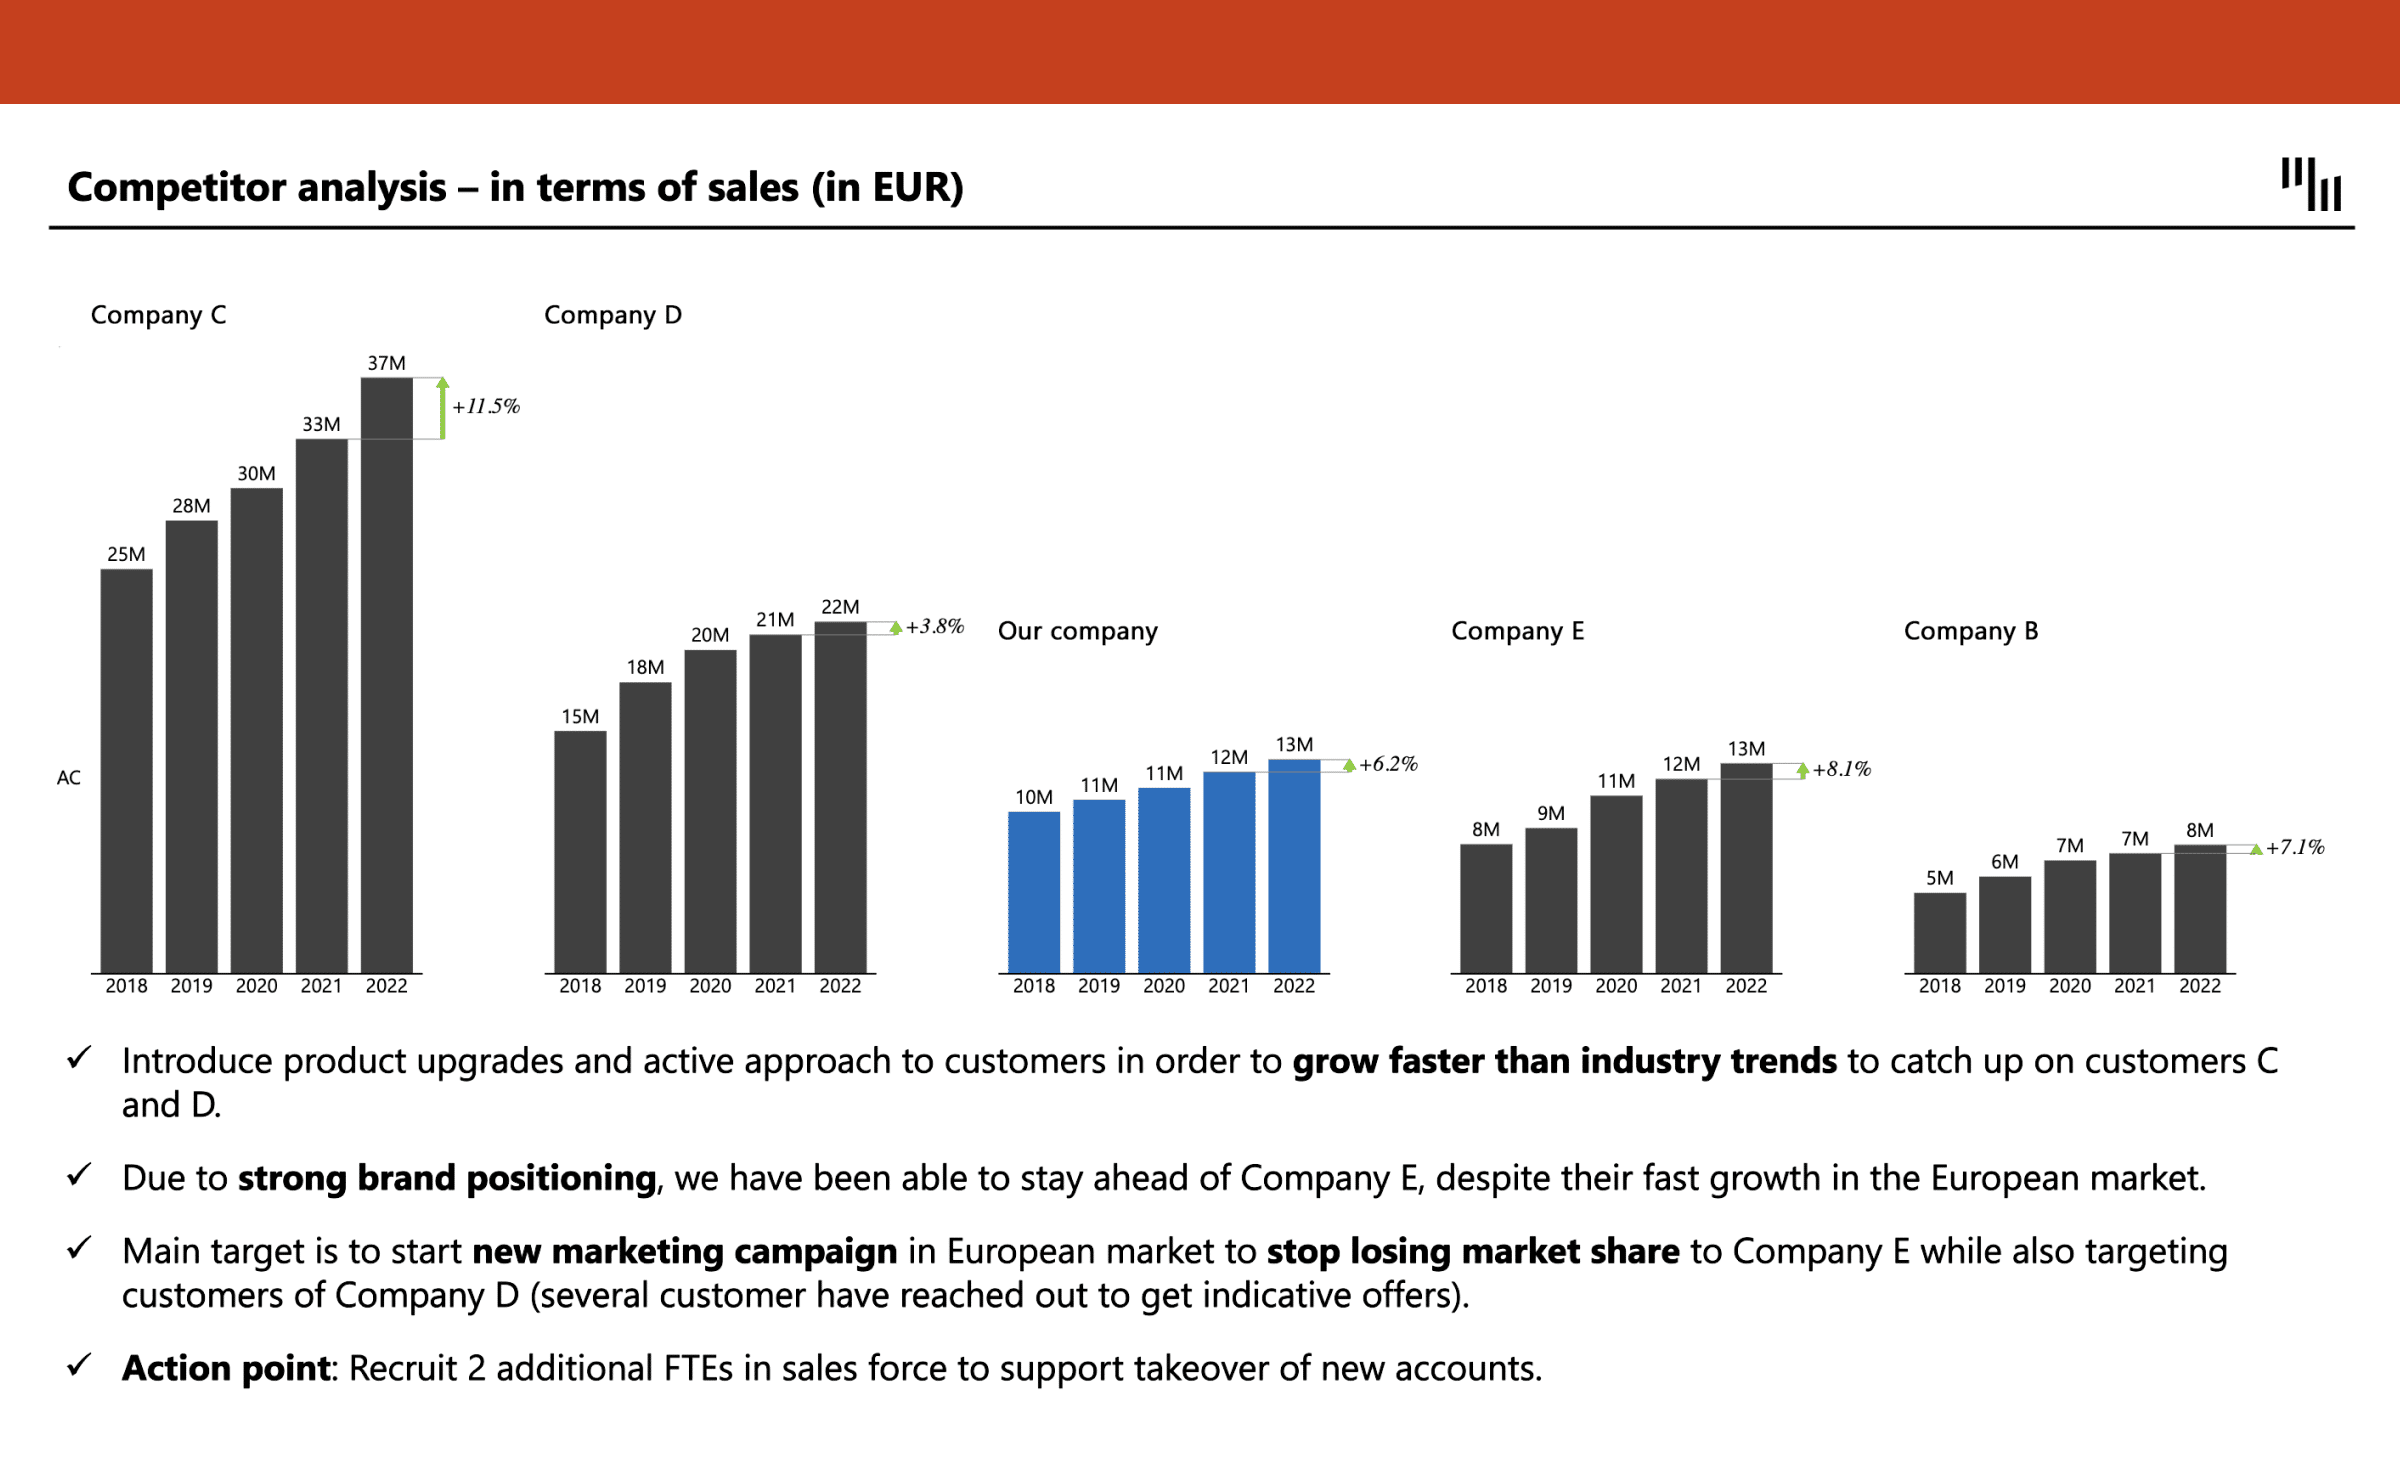
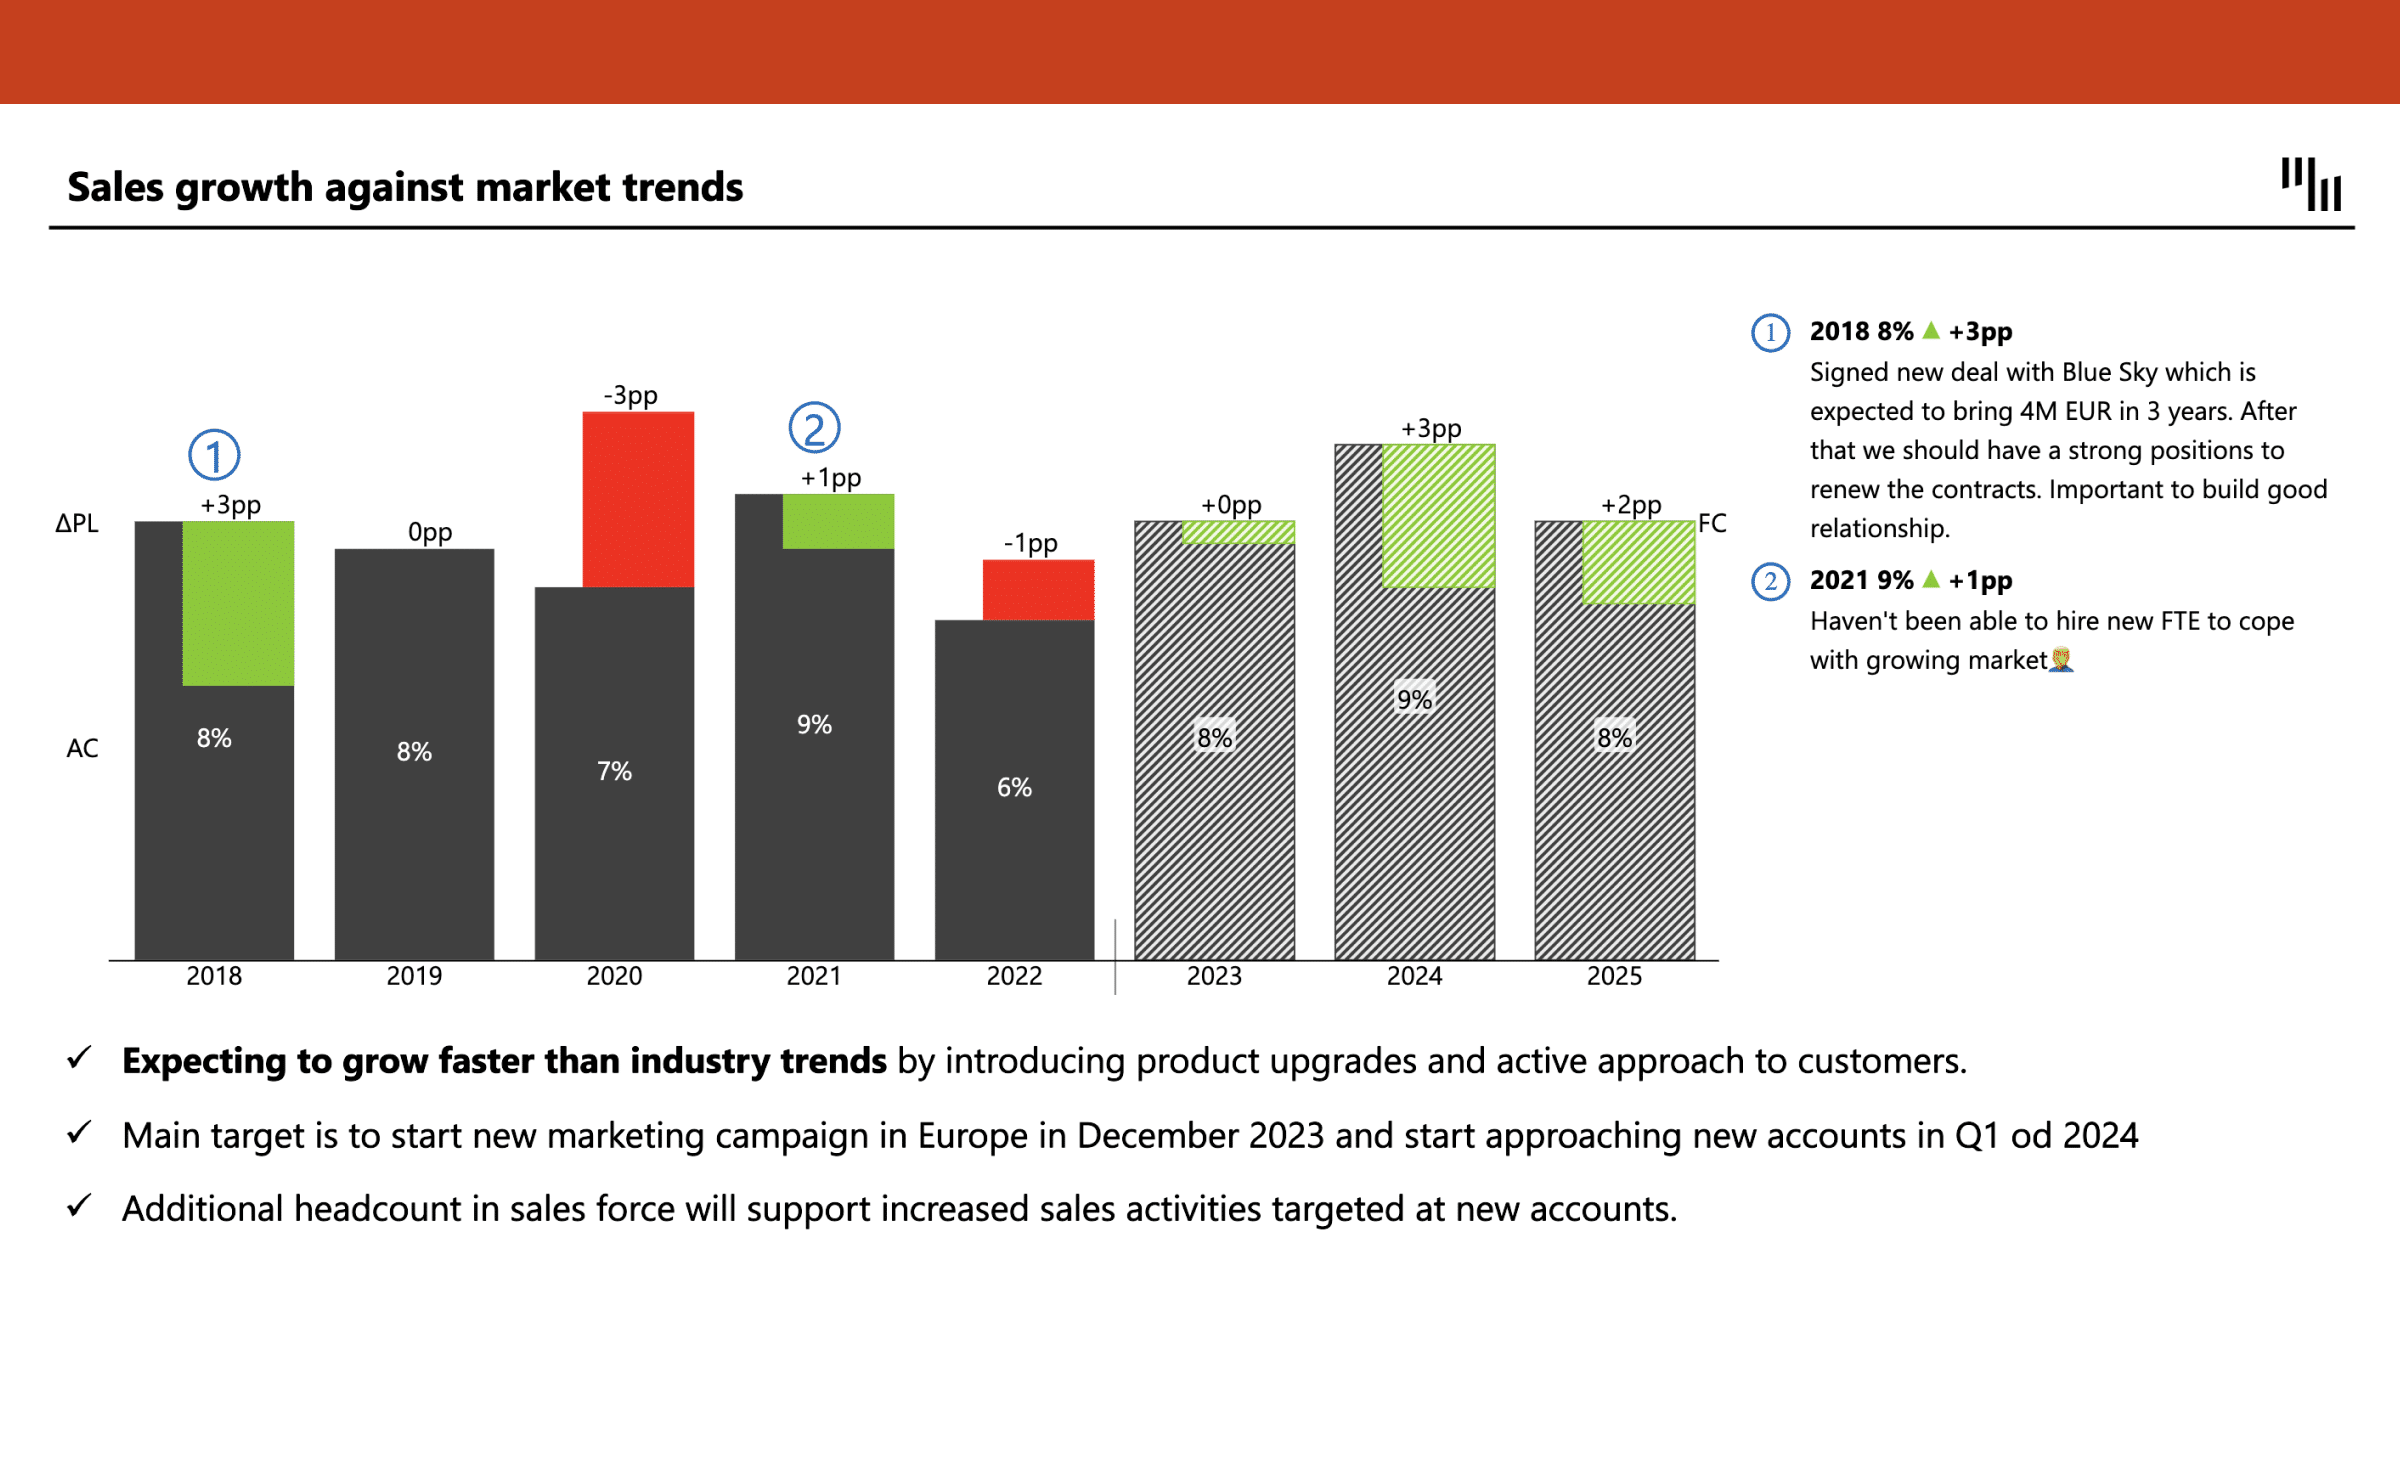
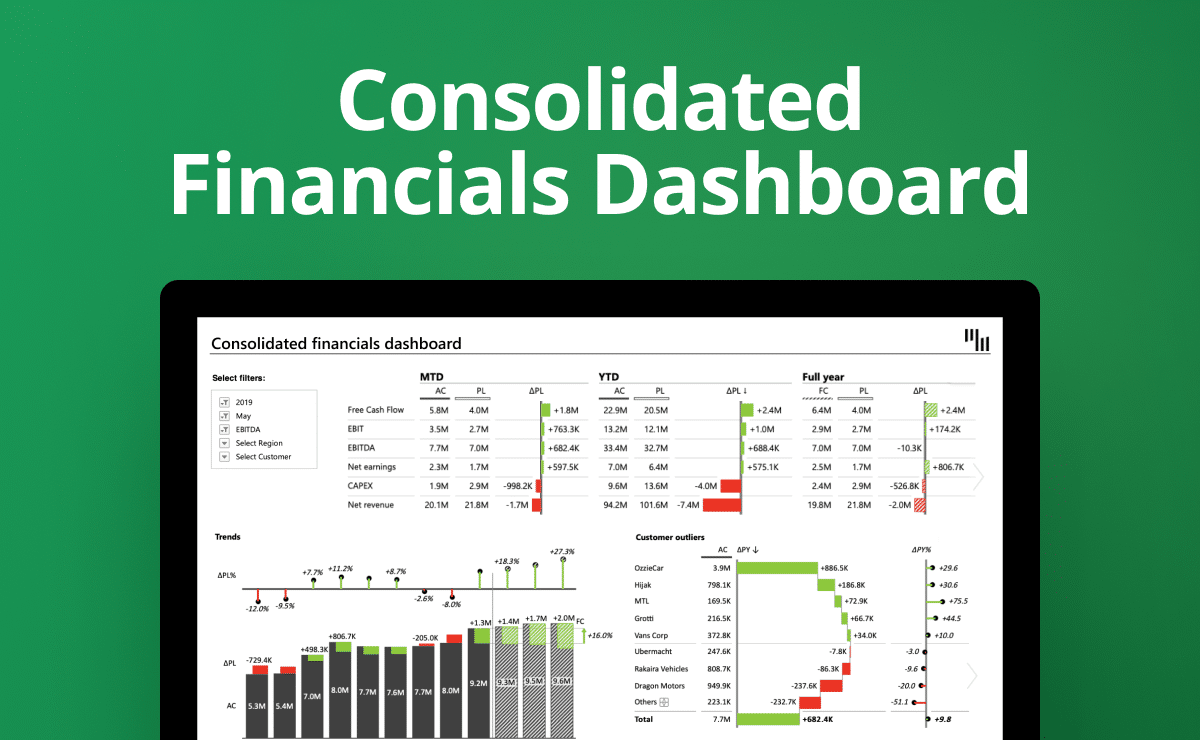
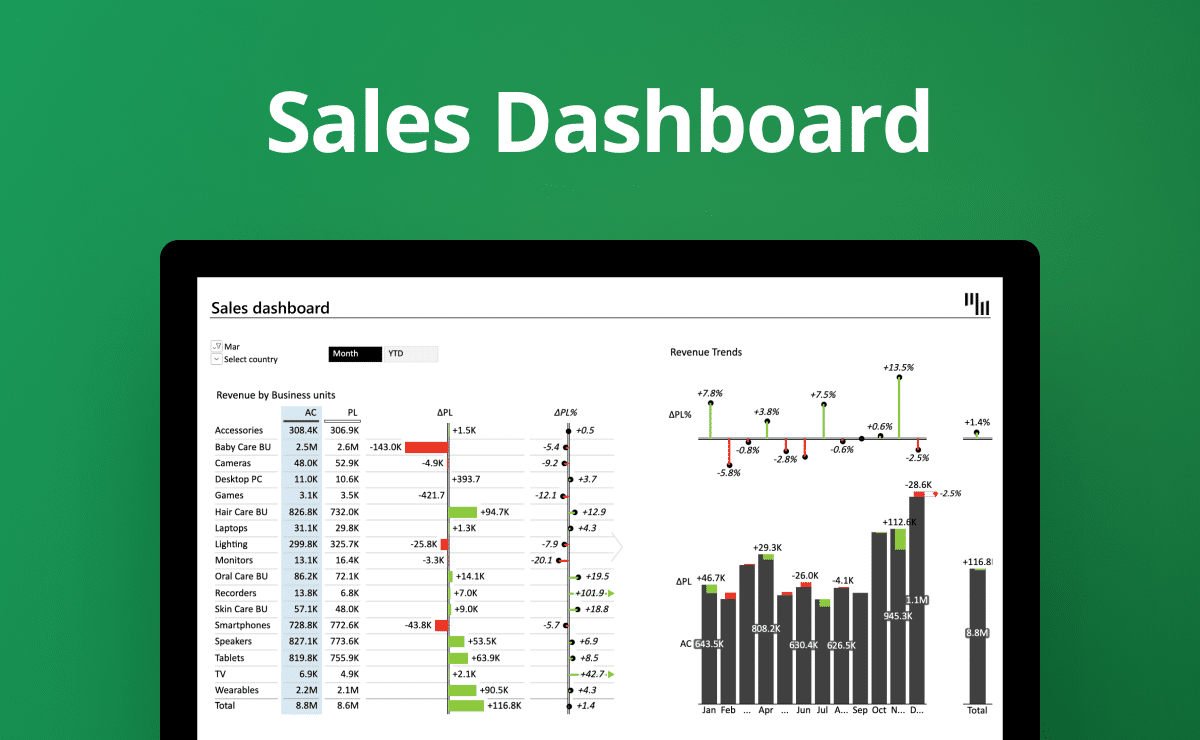
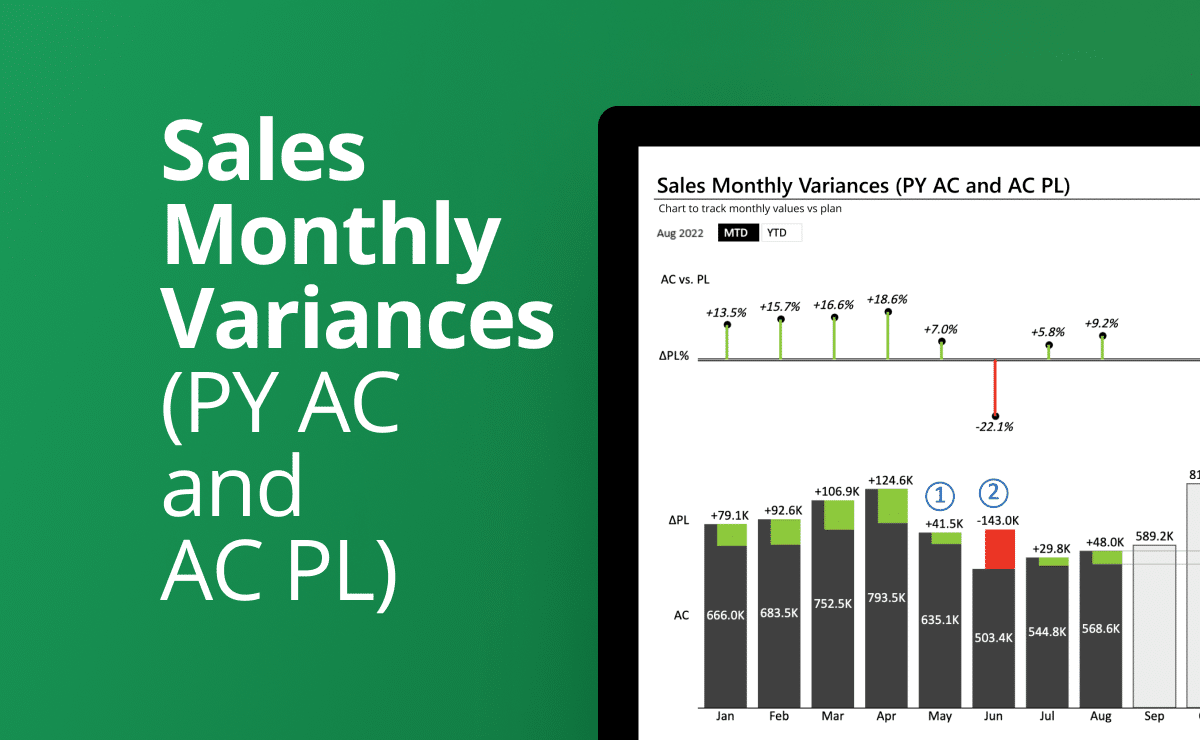
Zebra BI's market analysis PowerPoint charts are your new go-to tool for understanding your market and competitors but also tracking your sales growth against market trends. See how you stack up against industry averages and deliver an impactful data story with our easy-to-use and insightful PowerPoint slides. Have your stakeholders grasp your insights at a single glance to help them make smarter strategic decisions faster.

Visualize your market opportunities with zero effort

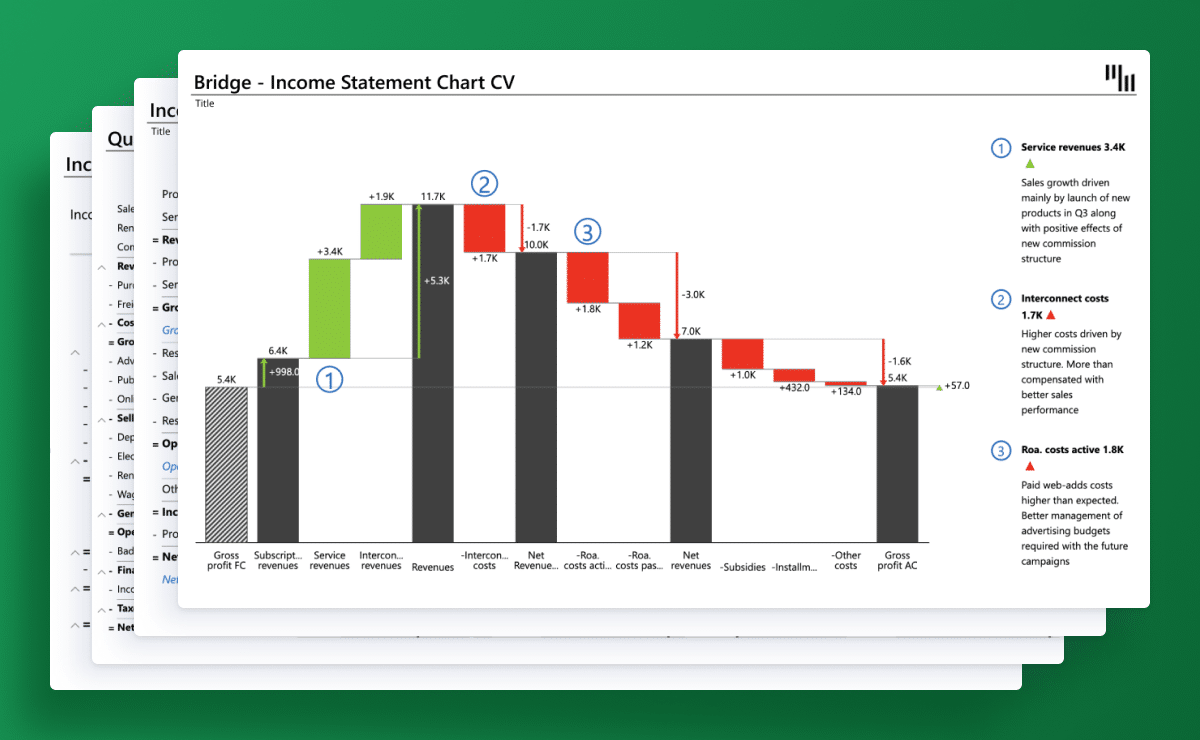
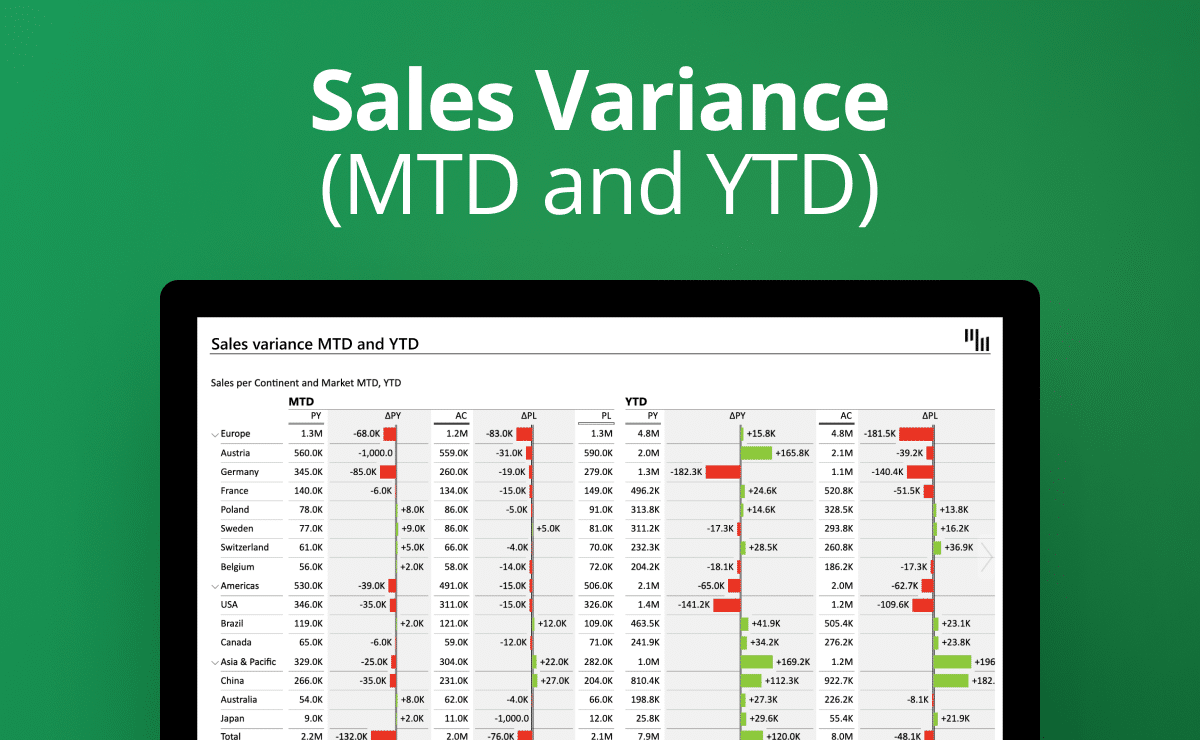
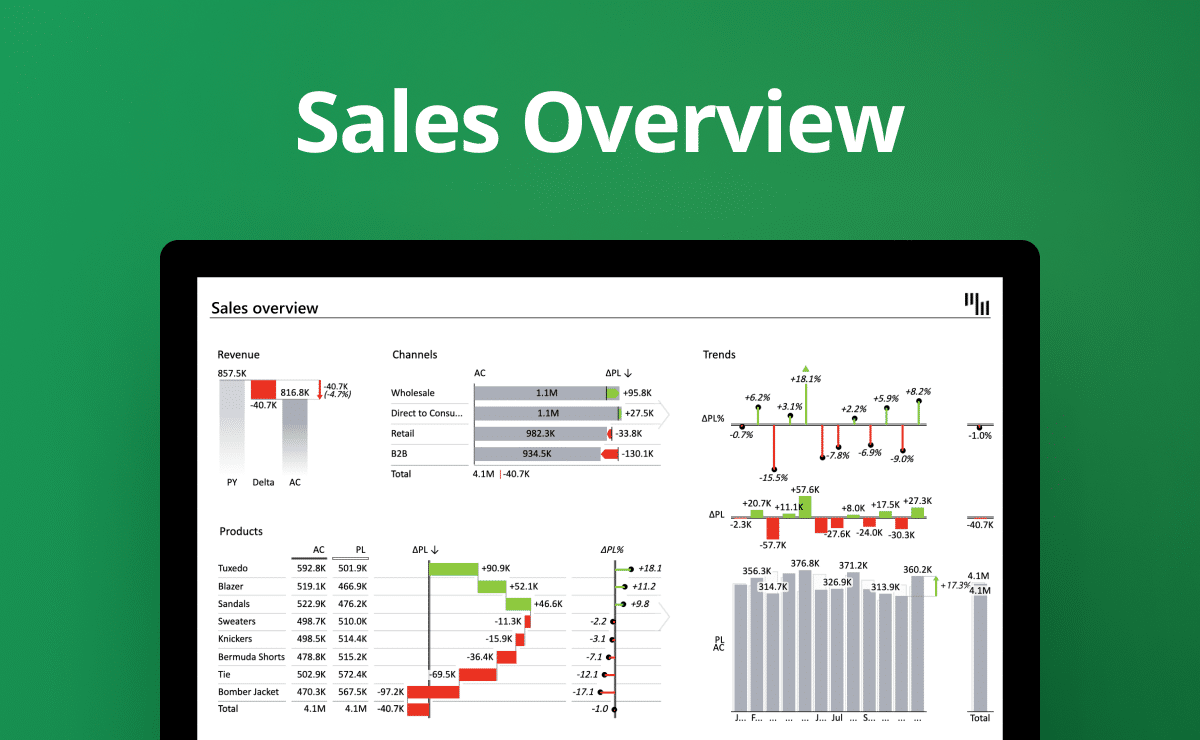
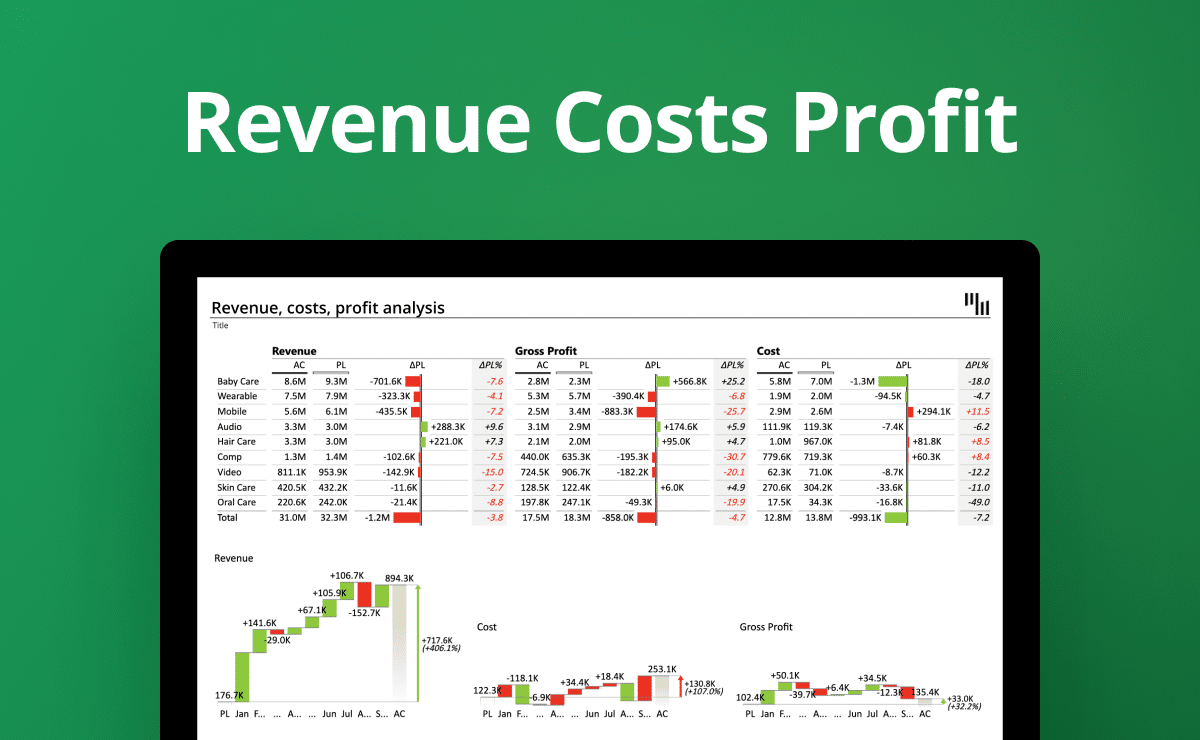
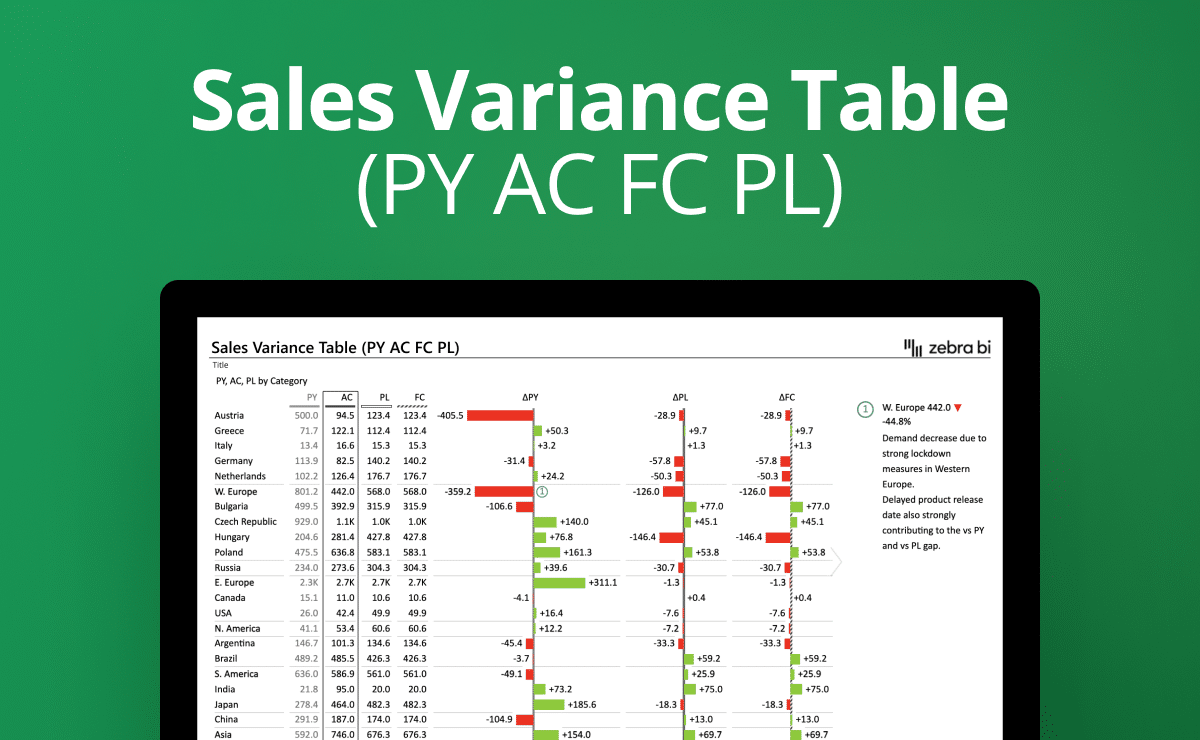
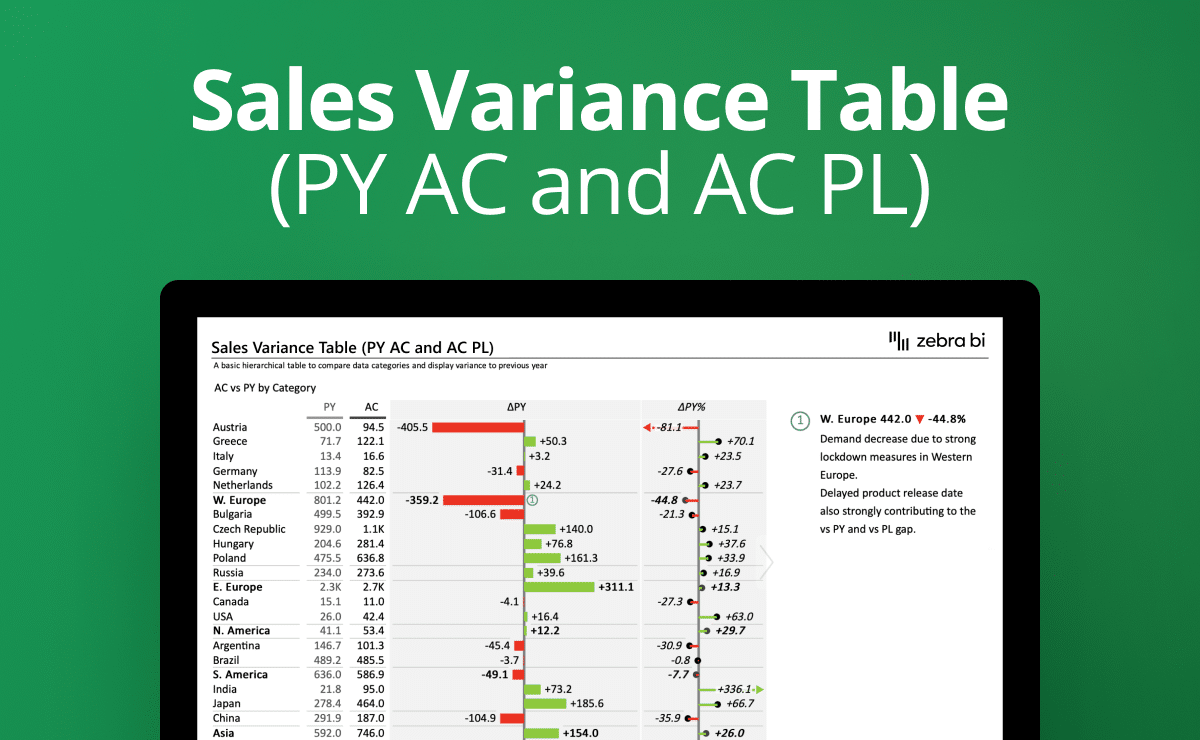
Spotting market opportunities and understanding customer behavior are key to staying ahead in business. Our market analysis PowerPoint charts ease the task by allowing you to just input your data & have it visualized automatically in the form of advanced charts and tables packed with actionable insights. They also feature automatic variance calculations, so you no longer have to calculate them manually. See trends over time, understand shifts in behavior, and deliver an insightful story with your data. Last but not least, you can also add dynamic comments to elaborate on the crucial parts.

Present your strong points & weaknesses in an easily consumable way

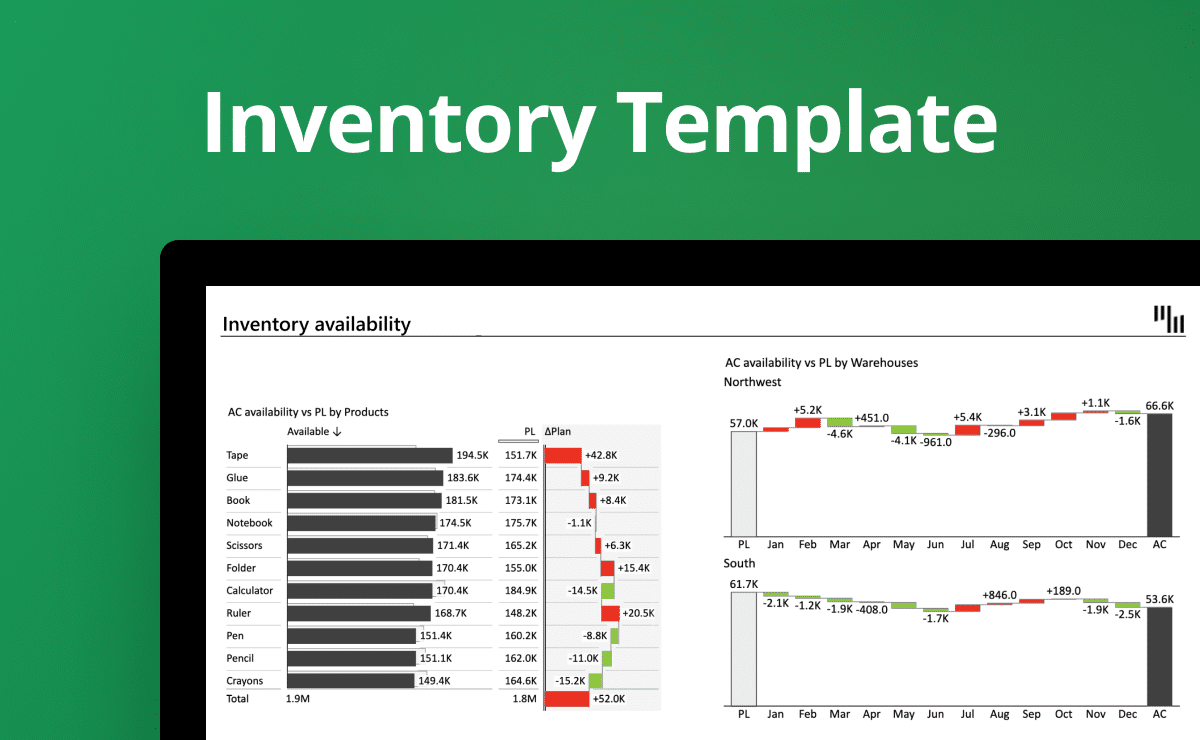
With Zebra BI's market analysis PowerPoint charts, you will no longer be presenting static images from Excel reports. This slide deck provides you with dynamic, customizable visualizations which allow you to deliver interactive presentations tailored to your business. Present your performance compared to industry peers, have your stakeholders spot where you shine and easily identify areas for improvement. It's not just about creating a presentation; it's also about telling the story behind your data - in your colors, with your fonts, in your style.

Show accurate sales growth forecasts that are easy to understand

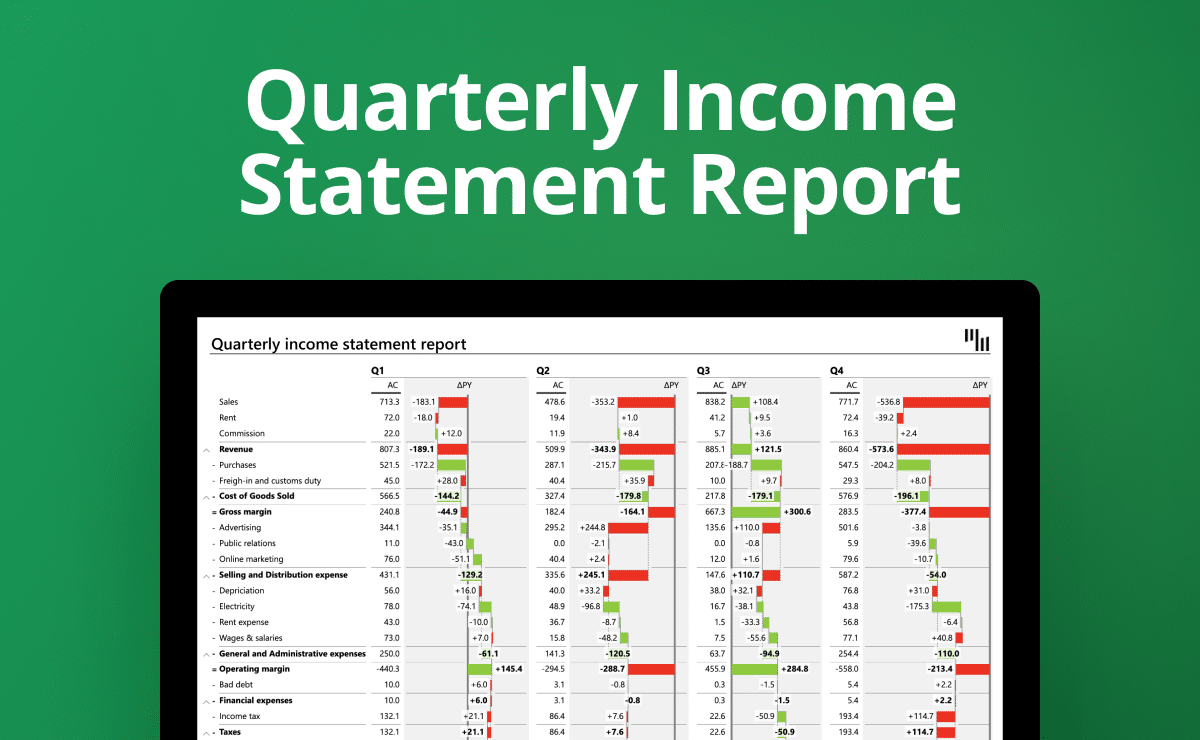
Understanding the ebb and flow of market trends is critical to predicting your business's future. Our interactive market analysis PowerPoint charts make this process easy and efficient. Just input your data and let our advanced charts and automatic variance calculations do the heavy lifting, revealing trends over time. It's forecasting made interactive, customizable, and most importantly, accurate.

Try it hands-on

Create impressive yet easy-to-understand presentations fast & deliver them in the most impactful way possible. Download these free market analysis PowerPoint charts, enter your own data and that's it! It doesn't get easier than that. Interested in how to do a market analysis in Excel, too? Learn all about it in our 4-step guide.
Features used
Comparison to industry average
Advanced charts & tables
Automatic variance calculations
Trends over time
Dynamic comments
The option of hiding columns
Creating insightful market analysis presentations has never been easier. Feel free to explore the advanced charting options to get inspired & try it with your data.
Download this template

More professionally-designed templates to use

Contribution Margin Analysis Excel Template
Gross Sales vs Net Sales Excel Report Template
Basic
Financial Forecasting and Planning: Profit & Loss Overview Excel Template
Adjusted EBITDA template and adjusted income statement example created with Zebra BI for Excel
Basic
Adjusted EBITDA Template & Adjusted Income Statement Example for Excel
Basic
Long-Term Assets and CapEx Report Excel Template
Basic
Cash Flow Statement from Pivot Table (Hierarchical)
Intermediate
Break-Even Analysis Template for Excel
Intermediate
Working Capital Analysis Template in Excel
Intermediate
Sales variance analysis report templates for Excel
income statement template excel afi
Intermediate
Basic
Income statement templates for Excel
Advanced
Consolidated financials dashboard in Excel
Intermediate
Sales variance report with multiple levels
Intermediate
Sales overview report in Excel
Advanced
Sales dashboard in Excel
Intermediate
Revenue-cost-profit analysis
Intermediate
Inventory report
Intermediate
Quarterly income statement
Basic
Income statement with multiple levels
Basic
Balance sheet template for Excel
Basic
Subscription business model analysis in Excel
Basic
Marketing budget variance analysis in Excel
Basic
Income statement (bridge chart) in Excel
Intermediate
Price-Volume-Mix variance analysis in Excel
Basic
EBIT contribution analysis in Excel
Basic
Cash Flow Statement template
Basic
Income statement in Excel (PY-AC-PL-FC)
Basic
Income statement in Excel (PY-AC-PL)
Basic
Income Statement in Excel (PY-AC) and (AC-PL)
Basic
Cost Variance Table in Excel (PY-AC-FC-PL)
Basic
Cost Variance Table in Excel (PY-AC-PL)
Basic
Cost Variance Table in Excel (PY-AC and AC-PL)
Intermediate
Monthly Sales Variances in Excel (PY-AC-FC-PL)
Intermediate
Monthly Sales Variances in Excel (AC-FC-PL)
Intermediate
Monthly Sales Variances in Excel (AC-PY-PL)
Intermediate
Monthly Sales Variances in Excel (PY-AC and AC-PL)
Basic
Sales Variance Table in Excel (PY-AC-FC-PL)
Basic
Sales Variance Table in Excel (PY-AC-PL)
Basic
Sales variance table in Excel (PY vs. AC and AC vs. PL)