How to Use Excel for Market Analysis in 4 Simple Steps
In the ever-changing world of business, keeping a keen eye on your market is crucial for staying ahead of the curve. Whether you're an FP&A professional or a business leader, understanding how to use Excel for market analysis can help you make smart data-driven decisions and unlock countless growth opportunities.
In this guide, we will examine the importance of market analysis and how to perform it with practical, hands-on tips. By learning how to use Excel for market analysis effectively, you'll be better equipped to identify trends, uncover hidden insights, and make strategic decisions. Finally, we will show you how to visualize your findings effectively to get a clear message across.
Let’s get right to it.
What is market analysis and why is it used?
Market analysis is a comprehensive evaluation of market conditions, trends, and competitive landscape, aimed at understanding business dynamics. With a powerful tool like Excel, you can gain a better insight into the market and make informed decisions that drive growth.
But let's take a closer look at what makes market analysis an essential tool for businesses. For starters, the fact that it provides valuable insights into your competitors, customers, and overall industry. Also, it helps you identify your strong points, weaknesses, opportunities, and threats (SWOT) through benchmarking and competitive analysis. Comparing your company's performance to that of similar businesses can help you evaluate how well you're doing & make appropriate strategic adjustments.

What's more, market analysis is essential to accurate forecasting. Here's the thing. Making meaningful predictions about your future performance and navigating the challenges ahead requires a deep understanding of market trends. Identifying market opportunities, understanding customer behavior, and segmenting the market are vital for conducting business and establishing yourself as an expert in your area.
All in all, learning how to use Excel for market analysis provides you with the tools and knowledge you need to be able to make data-driven decisions, stay competitive, and set your business up for success.
How to do a market analysis in Excel
Using Excel for market analysis is like putting a scalpel in the hands of a surgeon; it allows for precise and accurate work that might otherwise be impossible. Let's take a look at how you can leverage it to analyze raw data and turn it into actionable insights step by step.
1. Define your market clearly
Before diving into the data, make sure to have a clear definition of your market, taking into account factors such as industry, product, geography, customer demographics, etc. This clarity will help you focus your analysis and ensure that you're working with the most relevant data.
2. Get your data into Excel & clean it
Collect data from trustworthy sources such as industry reports and government statistics. Ideally, you should obtain data in CSV or XLS format, which can be easily imported into Excel. If other formats are used, Power Query can help transform the data into a format that you can work with in Excel. Once you have the data, you need to clean and manage it properly. Remove duplicates, fill in the missing values, and format the data consistently to ensure accurate analysis going forward.
3. Analyze the data in Excel
With your data organized, it's time to dig into the numbers. Use common Excel functions like AVERAGE, COUNTIF, SUMIF, MIN, MAX, and MEDIAN to perform calculations and extract insights from your data. Pivot Tables are another powerful feature that can help you summarize, filter, and analyze data more efficiently. By exploring trends and patterns in your data, you can identify opportunities and threats in your market and make smart decisions.
4. Visualize market analysis results effectively
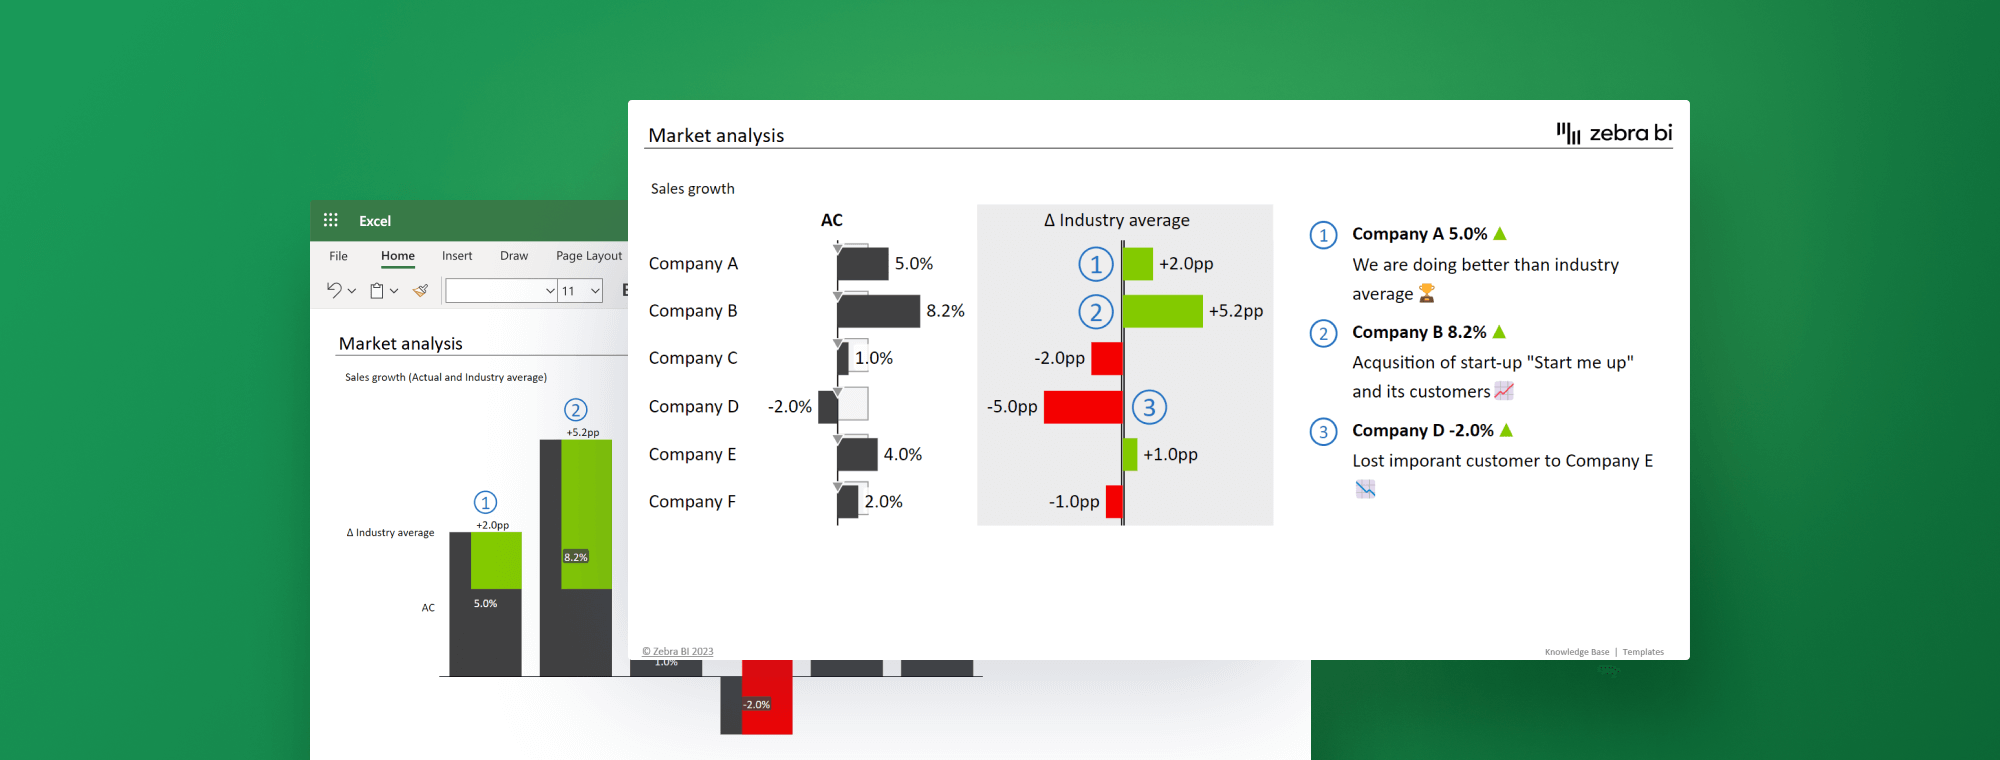
When you share your market analysis, it's super important to make sure the decision-makers understand what you're saying. It's the only way they'll be able to act upon the insights quickly. Visualizing your data not only makes it easier for them to digest and interpret but also enables you to identify patterns and trends that may not be visible from just the raw numbers. This is where Zebra BI for Office comes into play, taking your Excel-based market analysis and transforming it into actionable insights that will leave your stakeholders speechless.
Zebra BI – easily the best tool to visualize your market analysis
A picture is worth a thousand words. With IBCS-compliant interactive visualizations, Zebra BI can take that up to a million! By incorporating Zebra BI for Office into your Excel-based market analysis, you can clearly demonstrate industry trends and showcase how your company is performing against top competitors or the market average. And you can do it in just a few simple clicks. Have a look at how easy it is to visualize & navigate data with Zebra BI for Office.
Zebra BI for Office comes in the form of 2 add-ins for Excel (and also PowerPoint, by the way!) – Zebra BI Tables and Zebra BI Charts for Office. They enable you to:
- deliver actionable insights that your stakeholders can grasp at a single glance, and
- streamline your workflow, allowing you to get way more work done in just a fraction of the time.
And that's only the beginning. But let's have a look at how these add-ins can help you visualize your market analysis & deliver clear insights.
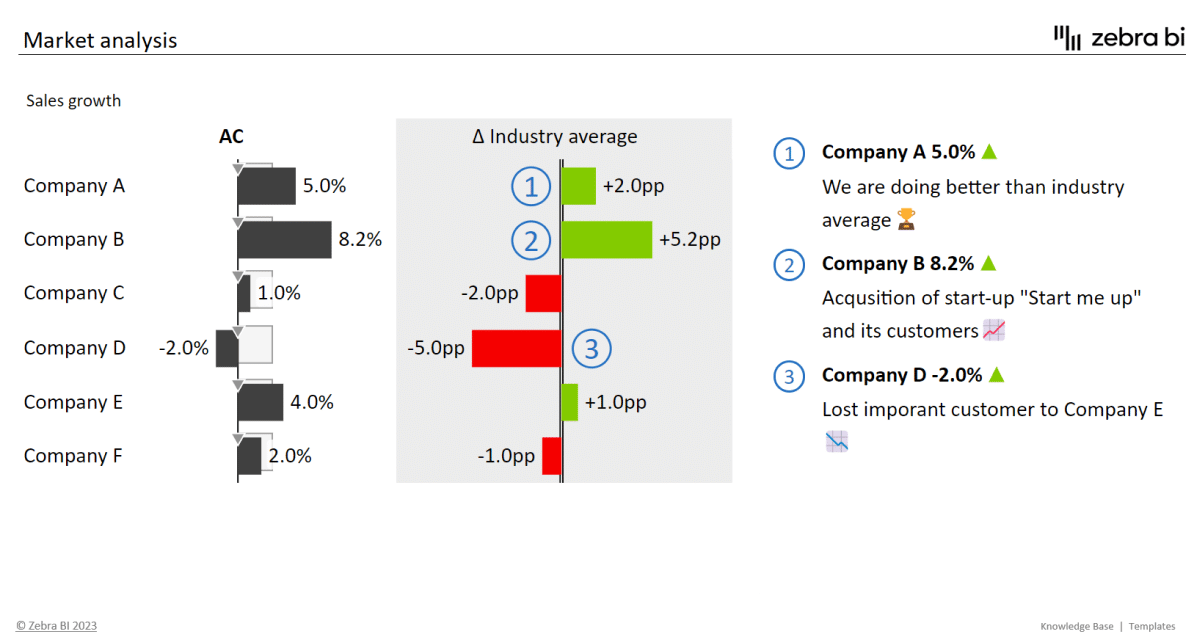
Zebra BI Tables for Office
Zebra BI Tables for Office is a versatile, powerful tool for visualizing tabular data in Excel. It allows you to easily showcase business performance compared to competitors and market averages.
As all Zebra BI visuals, Zebra BI Tables for Office features automatic variance calculations which, you've guessed it, calculate your variances automatically – and do so directly in the visual. This alone will save you a ton of time and effort that you otherwise put into manual work. The add-in also allows you to add comments to provide some necessary context to your numbers. several other next-level features that will make you look like a dataviz pro with the outputs you'll be getting.
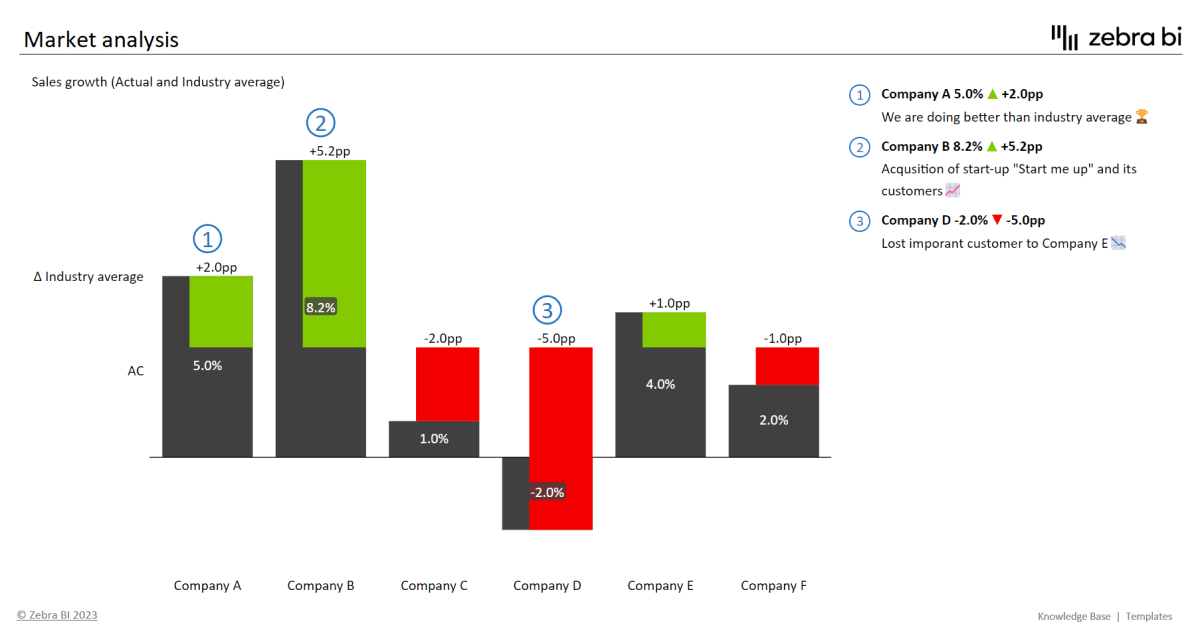
Zebra BI Charts for Office
In short, the Zebra BI Charts for Office add-in offers a wide range of chart types to render in Excel, including column/bar charts, area charts, line, waterfall, variance, "hills & valleys", dot, and lollipop charts. You can switch between chart types by simply clicking on the chart slider, directly in the visual. What's important to note is that you can also add forecasts to your charts and easily render small multiples of any chart type to analyze trends over time. Interested in learning more? Check out what else the add-in has to offer.
All in all, Zebra BI for Office can take your market analysis to a whole new level, delivering a super illuminating and actionable final product that will absolutely WOW your stakeholders. Not just with stunning interactive visualizations but also clear, relevant and accurate insights they can understand immediately.
Combined with Excel, Zebra BI allows for a powerful, comprehensive approach to market analysis, enabling you to drive your business forward and achieve success in an ever-changing landscape.
Unlock the full potential of your Excel-based market analysis
Try Zebra BI for Office for free & receive a free instructional file that will help you get familiar with the add-ins. It's time to create visually stunning market analysis visualizations that inform and inspire. Let's get cracking.