 September 8th
 February 22nd
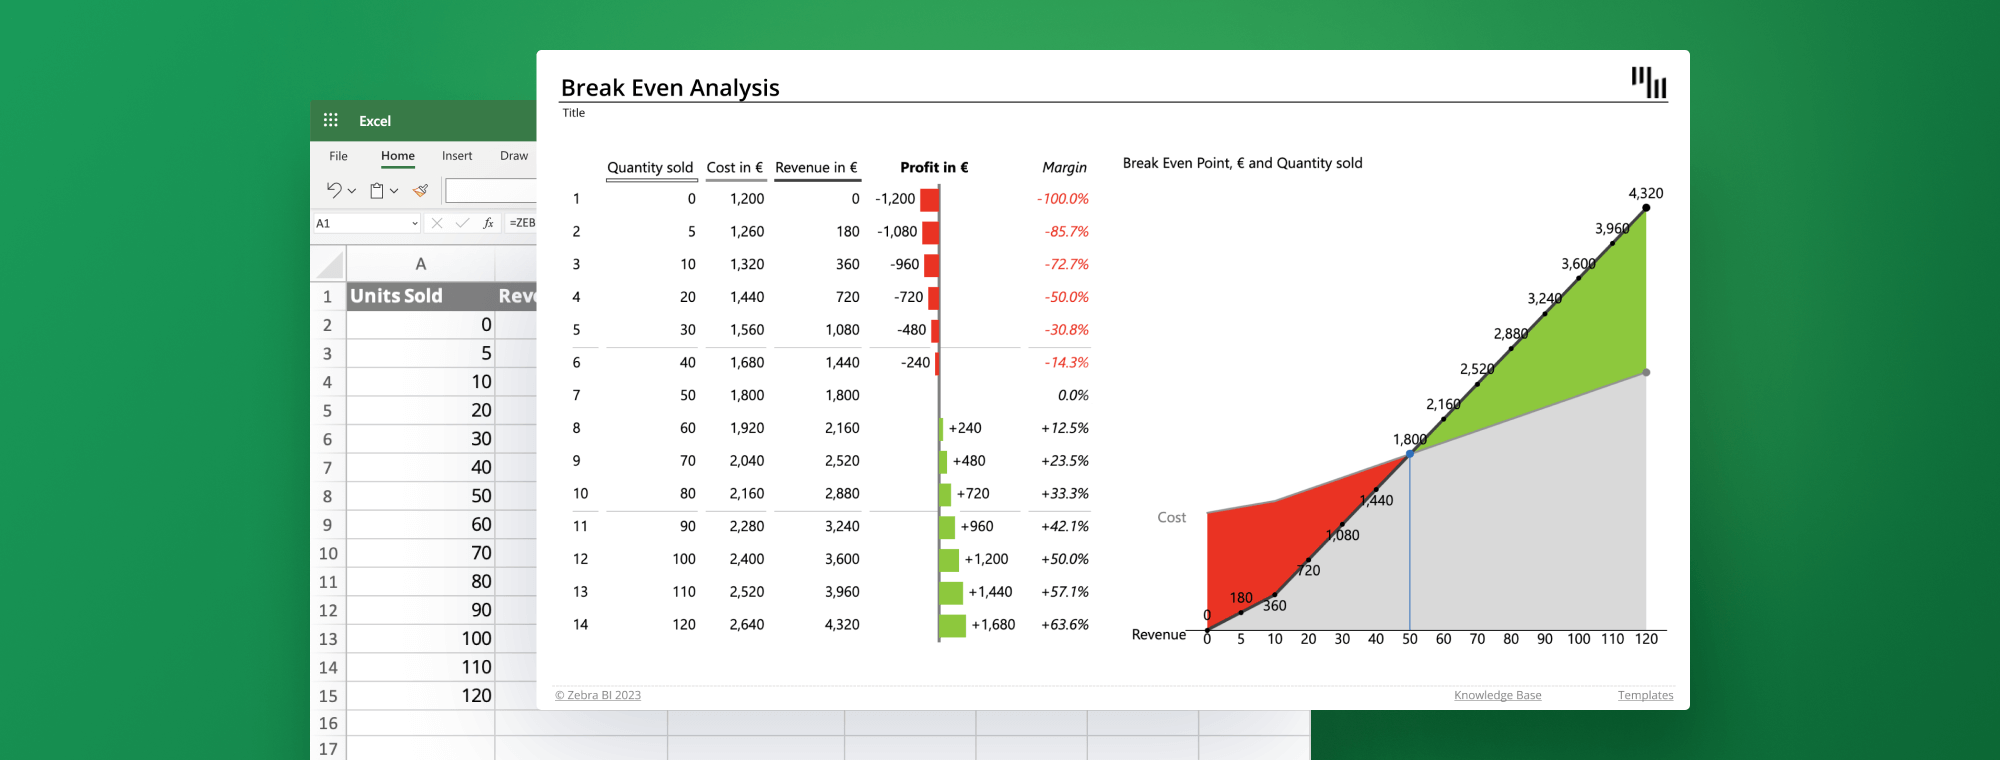
4 Foolproof Tips for Using Excel for Break-Even Analysis
Using Excel for break-even analysis is a game-changer when it comes to making informed business decisions. Read on to learn the 4 essential tips that will not only help you ace your break-even analysis in Excel but also better understand the financial landscape of your business in 2023.
Before we dive into the tips, let's first take a quick look at what a break-even analysis is & why it matters.
Start making informed business decisions with break-even analysis
Try Zebra BI for Office for FREE!
Zebra BI was made for:
- BI specialists
- FP&A specialists
- Consultants
- Digital transformation officers
- C-level and managers
Break-even analysis 101
A break-even analysis is the unsung hero of financial planning. With a dash of wit and a pinch of math, it helps businesses pinpoint the magical moment where revenues and costs meet in perfect harmony. In other words, it's the sweet spot where businesses finally stop bleeding cash and start making a profit. Break-even analysis is applicable to various fields, from stock-trading to corporate budgeting, which makes it an indispensable tool for informed decision-making.
The first step to conducting the analysis is to identify the break-even point, also known as Cost-Volume-Profit (CVP) analysis. This is crucial for any business, as it helps determine how much sales you need to cover the fixed and variable costs. The break-even analysis essentially consists of 3 components: fixed costs, variable costs, and sales. You can then use these to calculate the contribution margin and the break-even point.
Fixed costs refer to expenses that do not vary with changes in the level of quantity or sales. Think salaries, rent, insurance, etc. Variable costs, on the other hand, are the expenses that do change as the levels of production or sales do. They include the costs of raw materials, delivery, sales commissions, etc.
The results of the break-even analysis serve as inputs for pricing, cost reduction, production planning, performance metrics, project management, and more. The formula for calculating the business break-even point is as follows:

Note that the Gross Profit here is calculated as Price per unit – Variable cost per unit.
Now that you've got the basics covered, let's get right to the tips that will make using Excel for break-even analysis a breeze & produce powerful results, shall we?
Tips for Using Excel for Break-Even Analysis
As you start using Excel for break-even analysis, it's essential to know some tricks of the trade to streamline the process and make it more effective. In this section, we will explore 4 key tips to help you harness the full potential of Excel for conducting such an analysis. They're designed to help you do your work efficiently and accurately, which ultimately leads to better-informed business decisions.
1. Get your inputs
Make sure your data source has high-quality inputs. You know very well that the output of the calculation can only be as good as its input. Accurate and reliable data is essential for a precise break-even analysis, so take the time to gather and verify the information you need.
2. Understand and organize your data
Understand your cost structure and how it behaves given the quantity changes (for example, production units). Organize your data model in a way that you have an estimation of or clear information about your costs for each produced quantity (or range of quantities). Separate costs into columns by their nature to have a better overview of your cost structure.
3. Get the data into Excel and build a calculation model
Use your pre-organized Excel dataset to build on. Add the Profit calculation formula which deducts fixed and variable costs from sales to get to the profit.

This will give an indication of how the profit responds to quantities sold. Excel's built-in functions and tools will make these calculations more manageable and efficient.
4. Visualize your data to convey clear insights
Visualize your break-even analysis in table and/or chart formats. Presenting your output in a table, lining your break-even analysis components next to each other (quantities, sales, costs, and profit), and sorting them by profit in ascending order, can help you provide valuable insights. Presenting your output in a chart is also very beneficial, as it helps the reader get an immediate and clear message from the results.
Present Your Break-Even Analysis with Zebra BI for Office
Now that you've mastered the key tips for using Excel for break-even analysis, it's time to take your reporting to the next level with Zebra BI for Office. Zebra BI is a powerful tool that integrates seamlessly with Excel. It enables you to create compelling and informative visualizations to showcase your break-even analysis results clearly, accurately and efficiently.
With Zebra BI, you can effortlessly create an IBCS-compliant visual representation of your break-even analysis, where profit and variances are calculated automatically. Just enter your data into an Excel spreadsheet, insert a Zebra BI Tables and/or Zebra BI Charts for Office add-ins and let them do the heavy-lifting for you. It’s like having a car with a self-driving feature – you can just sit back, relax and let the car take you where you need to go while you enjoy the scenery.
Here's a quick sneak peek at what your break-even masterpieces could look like:
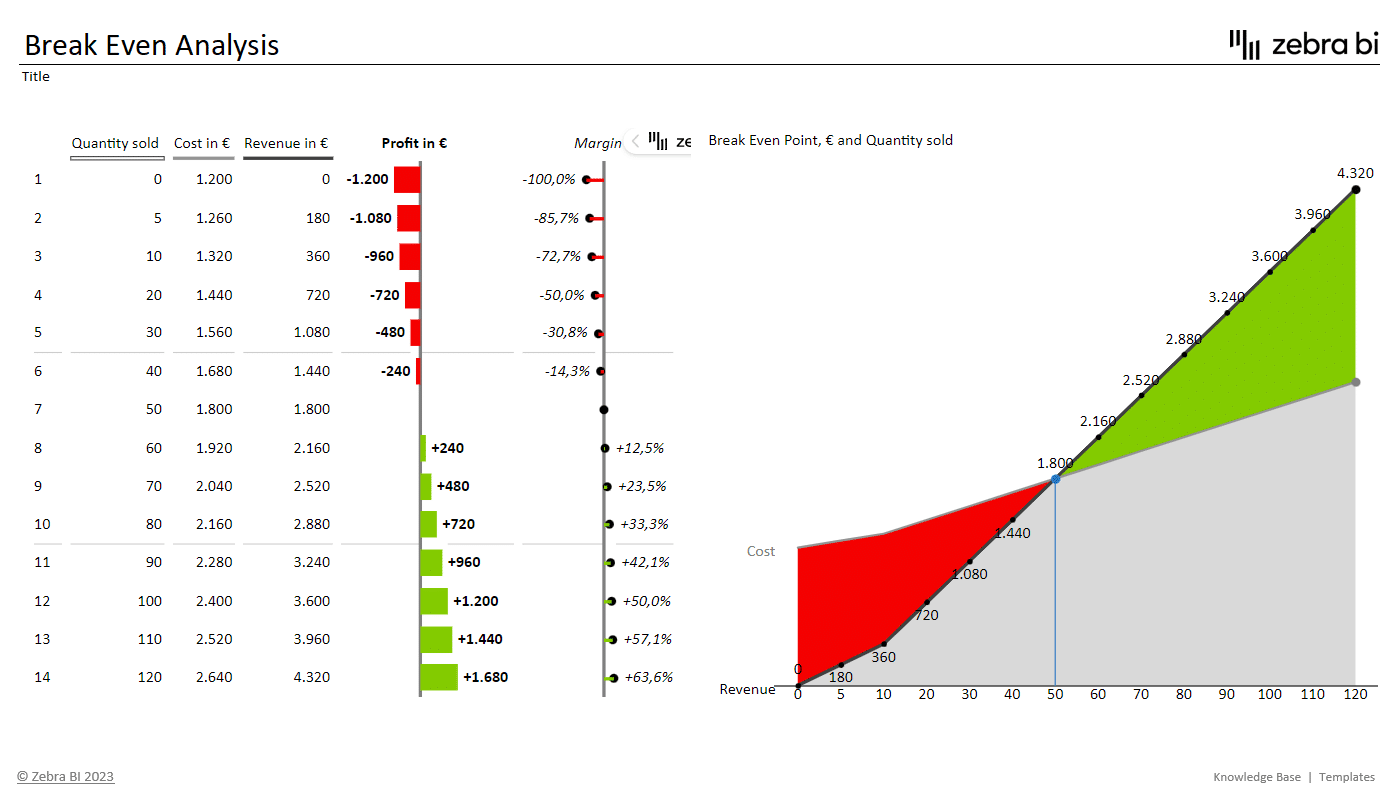
In just a few clicks, you get sleek, informative and interactive visualizations that clearly demonstrate the relationship between quantities, sales, costs, and profit. What's more, they enable you to drill down into your data to reveal more detailed information if so desired. When you present your break-even analyses with Zebra BI add-ins, you'll not only impress your audience but also ensure they grasp the key insights at a single glance. That's exactly what actionable reporting is all about.
To recap, using Excel for break-even analysis can help you gain a better understanding of your business's financial landscape. The added power of Zebra BI for Office helps you elevate your analysis & deliver powerful reports & dashboards in just a few clicks. It also makes it easier than ever for your stakeholders to make informed decisions fast.
Deliver an actionable break-even analysis visualization in seconds
Try Zebra BI for Excel for free & receive an easy-to-use instructional file that will launch you into the world of accurate & actionable visualizations.
Did you know? Zebra BI for Office also includes add-ins for PowerPoint. This enables you to create stunning presentations with actionable charts and interactive tables with your PowerPoint slides. It also gives a whole new meaning to efficient data storytelling.