Zebra BI for Office

IBCS® Certified
Show your business insights with 1 click
Create actionable reports, dashboards, or slide decks in seconds and convert boring numbers into real insights immediately.
Full features. No credit card required.
Trusted by 10.000+ controllers, FP&A analysts, digital transformation officers, business analysts, and other data enthusiasts:


Advanced visualizations
Actionable charts and tables in Excel and PowerPoint
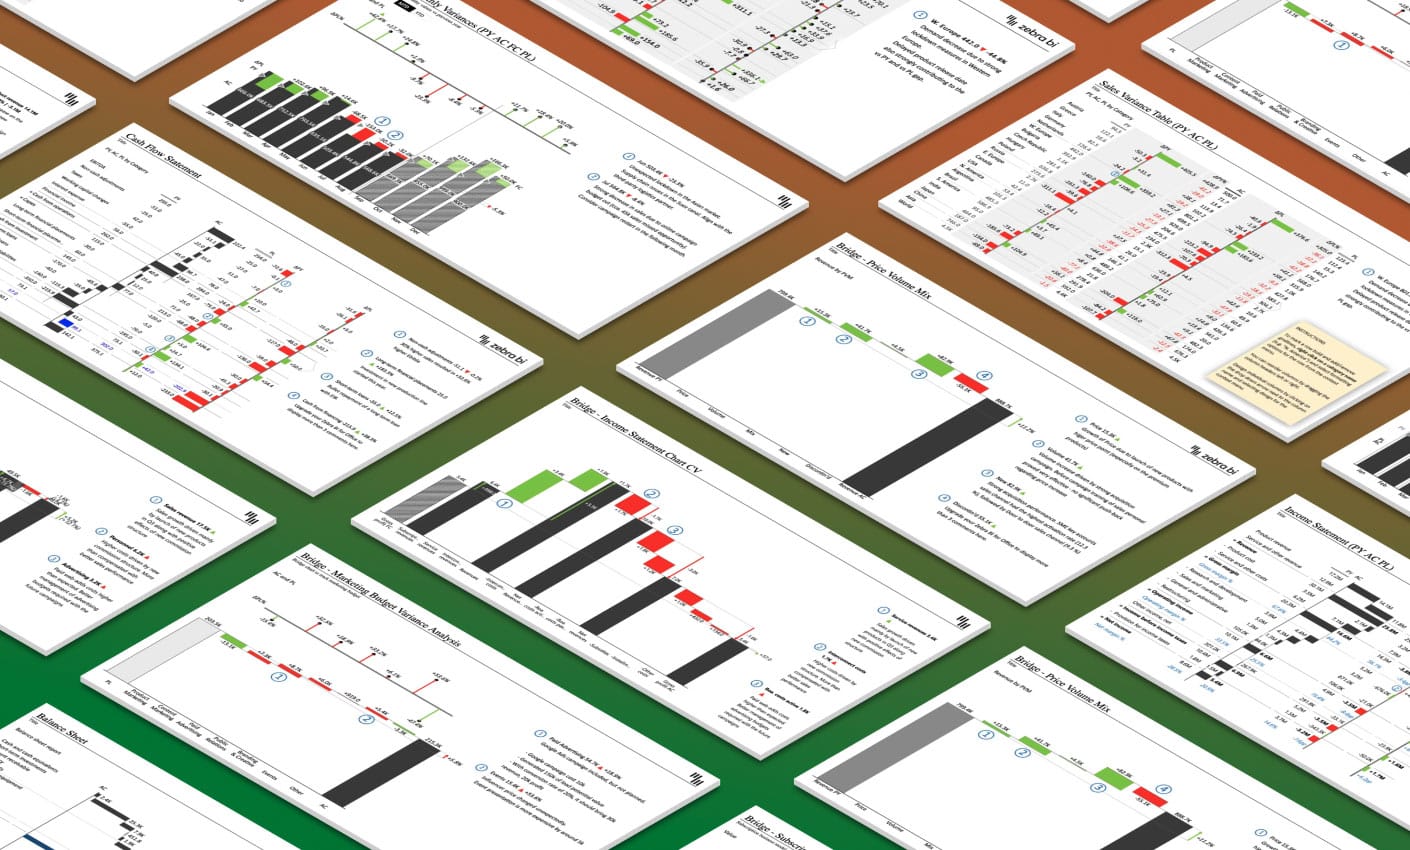
Forget the basic old-school visualizations. Let Zebra BI automatically turn your numbers into actionable interactive reports!
Have all variances calculated automatically in advanced tables or charts and simply slide between waterfall, variance, area, lollipop, or even small multiples!
Within 1 click
Show your business performance in seconds
Time is money, especially in business reporting. Simply select your data and visualize it in 1 click! Zebra BI automatically calculates absolute & relative variances for you so you can immediately show how your performance compares to Plan, Forecast, or Previous Year.
Actionable insights
Add comments to the visuals
You only have a couple of seconds to get the attention of the person reading your report. Add comments directly on the visual (even when in presenter mode!) to explain the ‘why’ behind the data and deliver actionable insights to people who make decisions.
Ready to see these features in action?
Consistent reports
Achieve faster understanding of the reports
If the same element always has the same meaning you will achieve a faster understanding of your reports (and save some time and money).
The out-of-the-box implementation of the International Business Communication Standards will create consistent reports across different platforms which will leave more time for analyzing data and planning future actions.
The out-of-the-box implementation of the International Business Communication Standards will create consistent reports across different platforms which will leave more time for analyzing data and planning future actions.
Single source of truth
Link data from Excel to PowerPoint
With Zebra BI you can effortlessly link your PowerPoint visualizations to your datasets in Excel (or even Power BI). Before your meeting, you can refresh your source data and have the latest version available in seconds.
Interactive dashboards
Cross-visual filtering in Excel
Zebra BI offers the world’s first solution in Excel that enables the cross-filtering of visuals by directly clicking on them. Click on one of the data entries and watch all other Zebra BI visualizations adapt to the chosen entry.
STYLE EDITOR
Apply your company branding
All your reports, dashboards, and presentations can now effortlessly match your company branding. By uploading your JSON theme once to the style editor, all your reports and slides in Excel and PowerPoint will match the company branding automatically.
DISCOVER ZEBRA BI FOR OFFICE FOR FREE
Uncover your business insights in seconds.
Zebra BI for Office is already available in Excel and PowerPoint. No additional installation is required. Follow the steps in the video and download the sample file that will help you get started.
Start Your Free Trial
Here's what analytics experts think
I had the privilege to do a test drive, and yes this product deserves multiple ❤ ❤ ❤

Wilco Nagtzaam
Senior FP&A Controller @ KPN
Excel is now an even better BI-Tool 😆 #ShowExcelSomeLove

Mario Mühllechner
Team Lead Business Intelligence | Liebherr Earthmoving
No more time spent on hacking #Excel to make the charts look good. Now with one click & boom! voilà! ⚡⚡
THANK YOU for developing this for the huge community of Excel users!

Carlos Barboza
Guerilla Data Analyst
Truly an amazing job which will change the way controller’s and financial analysts can do their work and focus on the actionable massages and not on the visualization! That part has been taken care of! Nice job & thanks.

Casper Plantinga
Customer Success Director
I freaking love Zebra BI! Y’all have some unreal custom stuff
DH
Dan Holman
Financial Analyst
What a great way to tell your data "I love you" 😍
UH
Ulrik Harnisch
Power-BI-Barista
Join Wilco, Mario, Carlos and 10,000+ analysts
Immediate insighs
Use data to tell a story
What's our sales performance compared to the plan? Which business categories are doing the best and where do we need to focus our attention? Are we spending more than last year and how much more?
Ditch time-consuming analyses. With Zebra BI, you'll know answers immediately, because it will uncover business insights for you.
Ditch time-consuming analyses. With Zebra BI, you'll know answers immediately, because it will uncover business insights for you.
Fully customizable
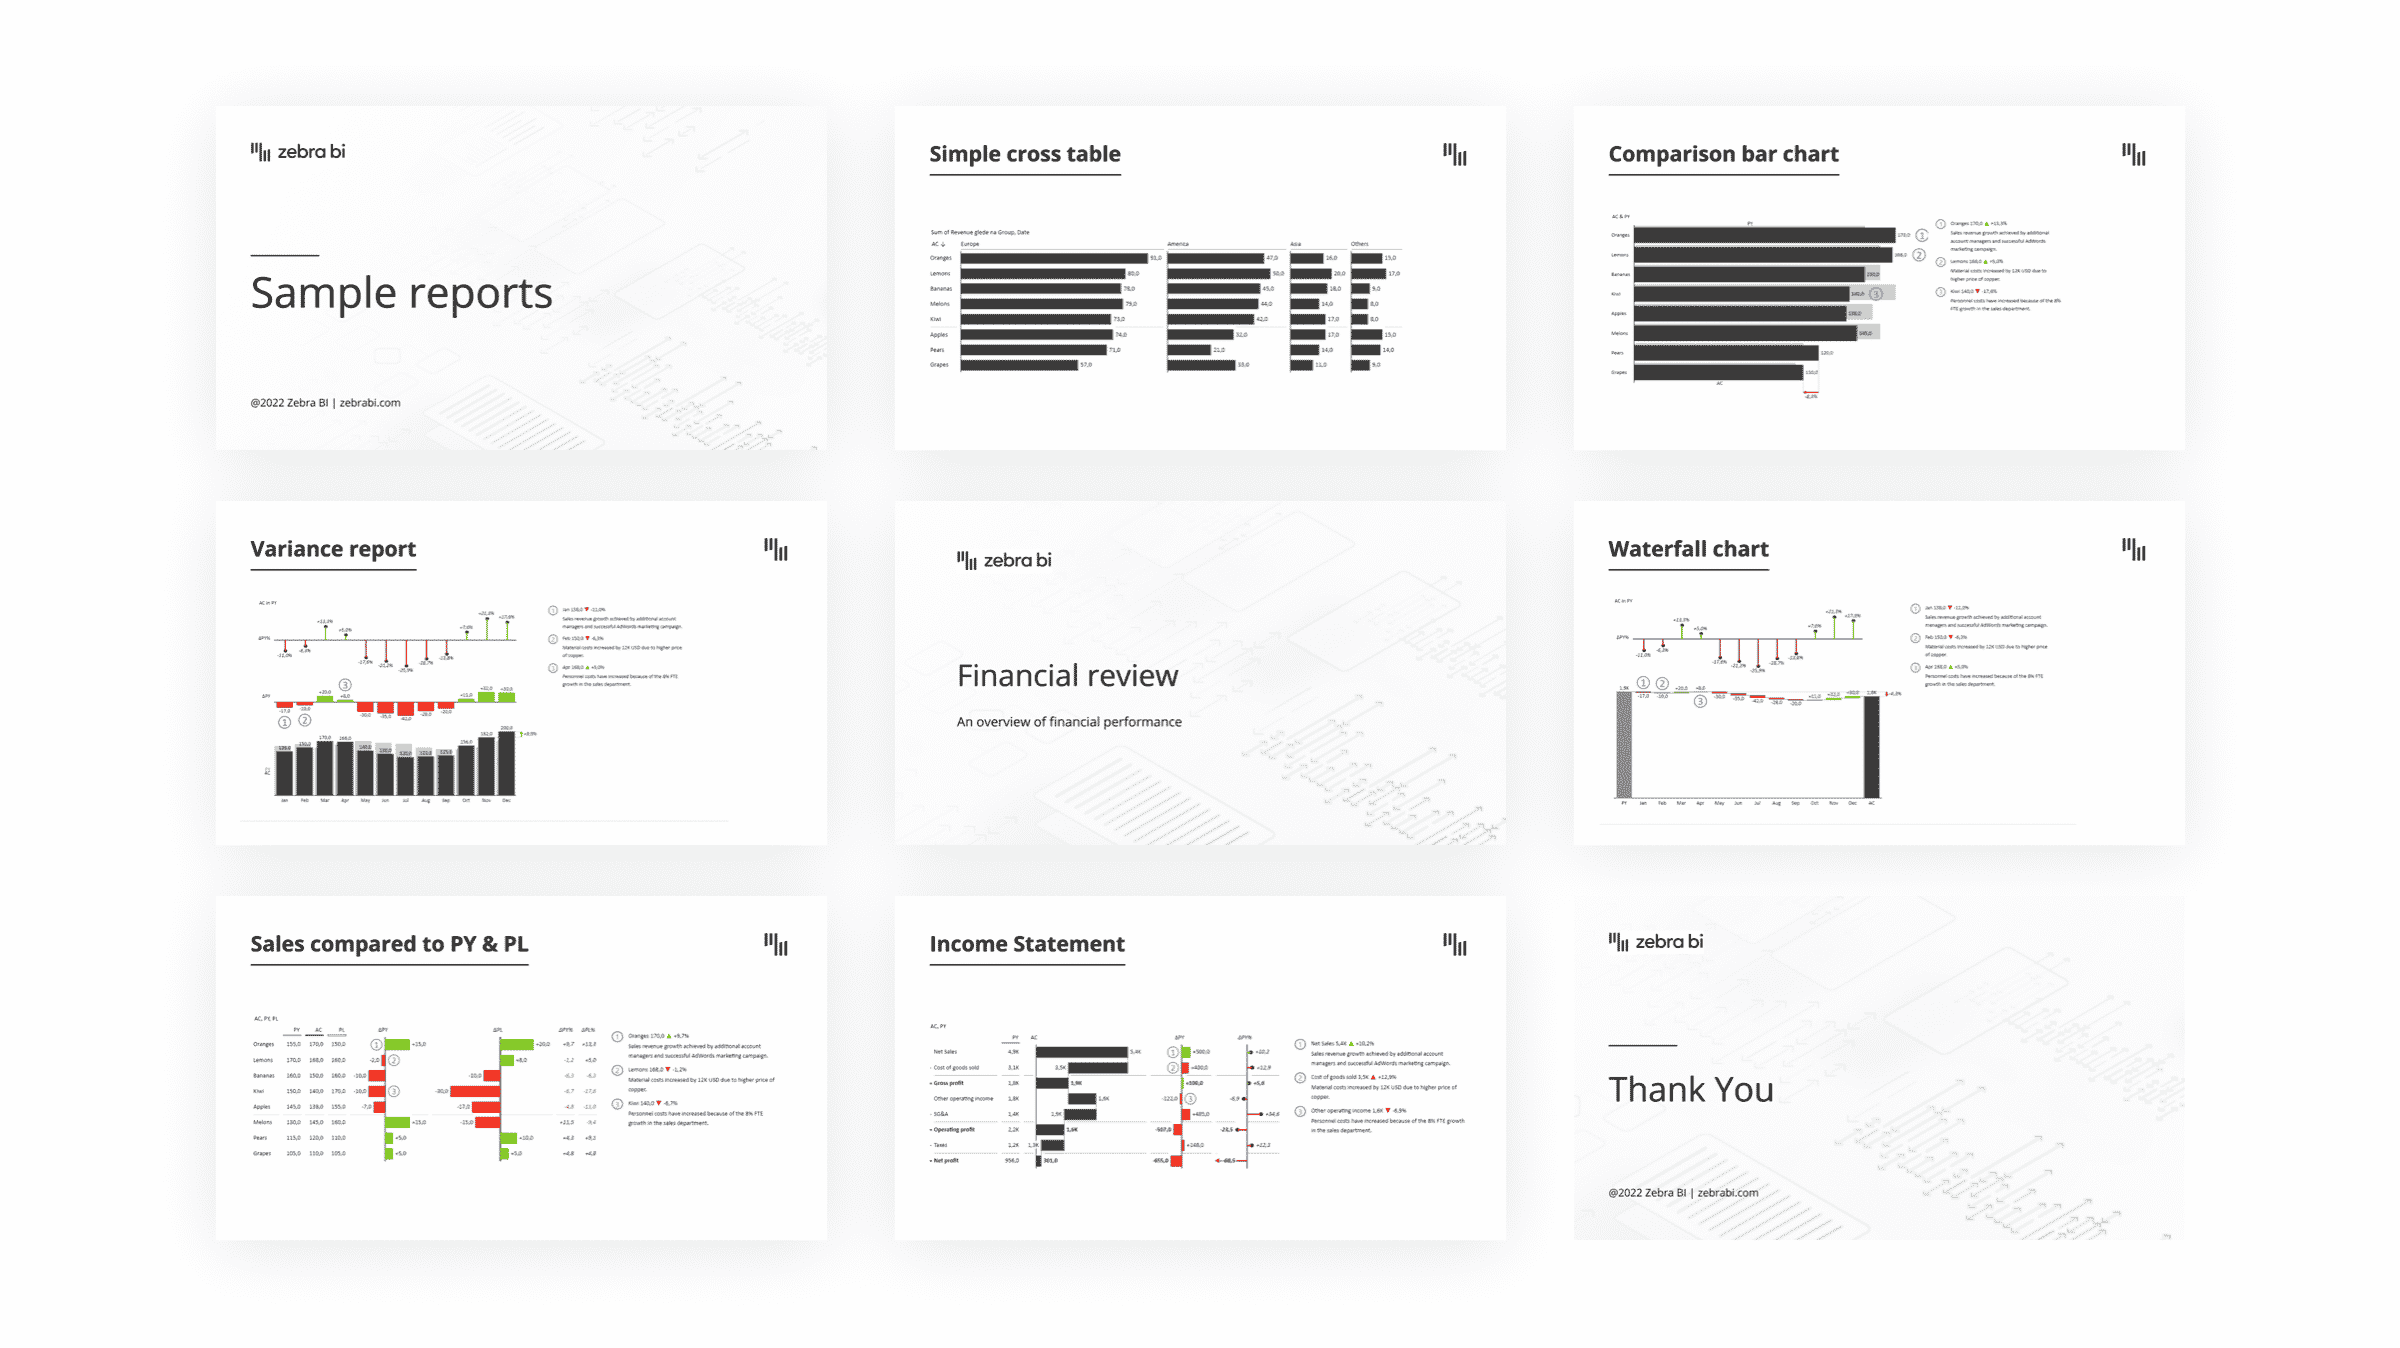
Save countless hours by using free report templates
Choose from 20+ fully customizable business reports trusted by analysts, executives, sales leaders and more from all around the world!
Explore Free Templates
Actionable Reporting for all

Report consistency
Faster and easier understanding of reports and slides with the out-of-the-box implementation of the IBCS.

Lifetime updates
After adding Zebra BI for Office, you will automatically receive updates as soon as the new version is available.
Ease of use
No need to learn new skills or install anything. Simply get your data and let Zebra BI do the magic of visualizing it.
Frequently asked questions
Still have questions?
Can’t find the answer you’re looking for? Contact help center.
We currently fully support Office 2021, Office365, and Office for Mac. Also, Office mobile apps are supported (when viewing, visuals are rendered as static images).
You can insert 2 Zebra Bl add-ins: Zebra BI Charts for Office and Zebra BI Tables for Office. Both add-ins are available on Microsoft AppSource and work on Excel or PowerPoint (either desktop or online environments).
Yes. You can sign up for a free trial and insert the free version by going to your Excel > Insert > Get Add-ins > search for 'Zebra' > click Add next to Zebra BI Tables for Office and/or Zebra Bl Charts for Office.
Then get your data either in a cell range, pivot table, or Excel table, click on It and insert the add- in.
The free version is free forever but it is intended only for personal use. If you'll be using it in a team, check out the pricing packages.
Then get your data either in a cell range, pivot table, or Excel table, click on It and insert the add- in.
The free version is free forever but it is intended only for personal use. If you'll be using it in a team, check out the pricing packages.
Viewers can see all the data and interact with it without needing any special requirements, other than having a valid license.
The visuals are embedded in the Excel workbook or Office slide, so no additional installation is required. The visuals are interactive, allowing users to easily explore the data and view different insights.
The visuals are embedded in the Excel workbook or Office slide, so no additional installation is required. The visuals are interactive, allowing users to easily explore the data and view different insights.
Still reading? You're ready to try it.
Start Your Free 14-Day Trial
Full features. No credit card required.