 September 8th
 February 22nd
Power BI Performance Tuning: How to Make Your Reports Run Up to 10X Faster
PRO Trial
We've all seen slow Power BI reports. You know, reports that just take forever to load the visual. We're talking 5, 20 seconds or even a minute and more which makes them completely useless. And that's just why Power BI performance optimization is extremely important!
Here's the thing...
Speed, and thus performance, has a huge impact on user experience. Let's face it, you don't have time to waste on waiting for your reports to load, no one does. And that's just where this guide comes in!
Read on to learn the best Power BI performance tuning tips to make your reports run up to 10x faster in a way that is simple and easy to follow.
Get these tips in the form of a PDF checklist: Power BI Performance Optimization Checklist [PDF].
Diagnosis tools for Power BI performance optimization
When it comes to optimizing the performance of your Power BI reports, using the right tools is essential.
Here are three powerful diagnosis tools that can help you identify bottlenecks and improve Power BI performance.
Performance Analyzer
Performance Analyzer is a built-in tool within Power BI Desktop that enables you to measure the time taken by different report elements to load. It helps identify which visuals or queries are causing delays, allowing you to focus your optimization efforts precisely. By reviewing the generated metrics, you can pinpoint inefficiencies and make targeted adjustments to enhance report speed.
In our latest webinar on optimizing Power BI performance, our Power BI consultant, Mark emphasizes that when using Performance Analyzer, you should always start recording from a blank page to get clean initial performance timings.
The tool is most effective when combined with DAX Studio - after running your analysis, you can copy specific DAX queries from Performance Analyzer and paste them into DAX Studio for deeper investigation of query execution plans and server timings.
DAX Studio
DAX Studio is a standalone tool for analyzing and tuning DAX queries in your Power BI models. You can access DAX Studio directly through Power BI's External Tools ribbon when connected to your model.
This tool provides advanced features like query performance metrics, query execution plans, and detailed insights into how your calculations are being processed. This makes it an invaluable resource for diagnosing slow-performing measures and optimizing complex DAX formulas.
According to Mark's demonstration in our webinar, the key to effective DAX Studio analysis is toggling on both 'Query Plan' and 'Server Timings' before running your copied queries. This combination allows you to capture detailed breakdowns showing time spent in the formula engine versus storage engine, helping you identify whether performance bottlenecks stem from DAX calculation logic or data retrieval operations.
VertiPaq Analyzer
VertiPaq Analyzer is a tool designed to analyze the memory usage of your Power BI data models. It provides a detailed breakdown of how your data is being stored and compressed, helping you identify areas where you can reduce memory consumption. Optimizing your VertiPaq storage not only improves report performance but also ensures efficient resource usage for complex, large datasets.
Semantic Link Labs
In our webinar, Mark showcased Semantic Link Labs as a powerful Python library for automated metadata analysis across Fabric models and workspaces. You can access this directly through Power BI Service by viewing your semantic model and clicking 'Model Health' in the ribbon, which generates a notebook with best practice analyzer functionality.
As Mark explained during the webinar, this tool enables enterprise-scale analysis - you can run scans across single workspaces, multiple workspaces, or even all accessible semantic models in your fabric environment. The tool also includes LLM support for instant translations, allowing you to analyze and translate entire data models into any language without manual effort.
MeasureKiller
MeasureKiller focuses specifically on cleanup and reducing model bloat, as Mark demonstrates in the webinar. The tool scans your Power BI files to identify unused measures, columns, and tables, helping you slim down files and reduce memory usage without guesswork.
Mark showed both the free version for single model analysis and the paid, full tenant analysis version that provides comprehensive reports across your entire Power BI environment, including best practice scores for individual reports. The tool can generate Power Query expressions to automatically remove unused columns, making cleanup efficient and reversible."
3 simple steps to Power BI performance optimization
Power BI performance optimization is a complex topic, so we'll try to make it as practical as possible. To this end, we'll cover it in three simple steps:
- Analyze your performance by identifying and locating any bottlenecks.
- Speed up your data model, the main source of most performance issues.
- Speed up your reports and visuals so that they run more smoothly.
Whoever said Power BI performance optimization can't be fun? Let's dive right in.
1. Analyze your performance
The natural starting point is Power BI Performance Analyzer, a built-in feature of Power BI Desktop. Select the View ribbon, and then select Performance Analyzer to display the Performance Analyzer pane.
The Performance Analyzer pane is located on the right side
In the Performance Analyzer pane, hit Start recording and then Refresh visuals. Power BI reloads visuals and records how long each of them takes to load.
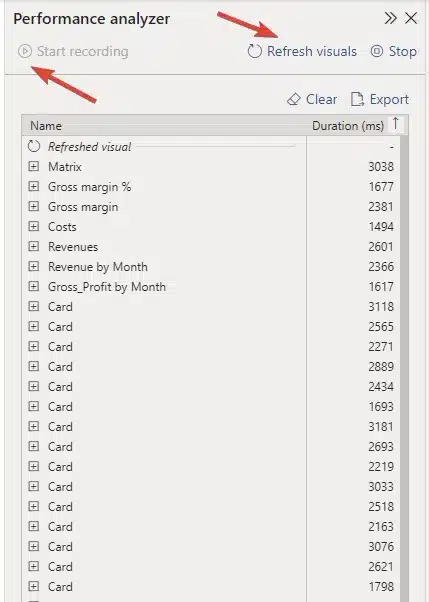
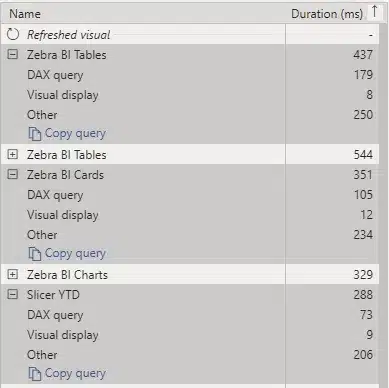
Performance Analyzer pane showing the load time for each element
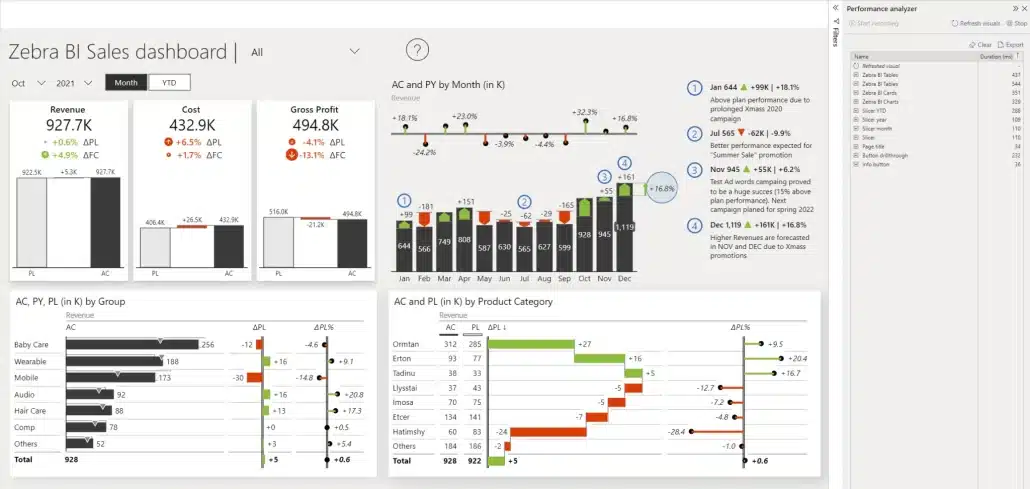
This report has a large number of elements, including images, lines, cards, charts, tables and slicers. Each of these elements adds to the time needed to query the data, and load and display the visual. What's important here is the duration of each element, displayed in milliseconds.
Specific example of Power BI performance analysis
Let's take a look at what makes up the load time of one randomly selected element.
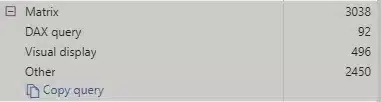
Element load times
DAX query turns out to be quite fast, with the duration of just 92 milliseconds. The Visual display category reveals that it took almost 500 milliseconds for the visual to display, which is worrying. What took the longest, however, was the Other category.
This one indicates how long it took for the visuals to load before the Zebra BI Tables could, which lets us know that there are simply too many visuals on the page.
Here are more tips on DAX optimization in Power BI:
- Minimize columns and rows queried: Only import the necessary columns and rows into your report; excess data increases query processing time and slows down performance. Use filters and query redundancies to limit the data size.
- Use aggregated data where possible: Perform data aggregation at the database level before bringing it into Power BI. Reducing the detail in the data can significantly enhance performance for reports that do not need granular data.
- Leverage variables in DAX expressions: Variables help reduce redundant calculations by allowing you to store intermediate results. This not only improves readability but also enhances performance by minimizing resource usage.
- Avoid complex nested loops: Simplify your DAX code by avoiding deeply nested functions. This can lead to faster calculations and optimized resource allocation.
- Pre-sort and pre-format data: Whenever possible, pre-sort and format your data in the database itself to reduce sorting and formatting operations in Power BI.
- Utilize appropriate data types: Ensure that columns are assigned the most efficient data type based on their usage (e.g., using whole numbers for integers instead of decimal types). This optimizes memory usage and speeds up queries.
- Reduce cardinality of columns: High cardinality, or an excessive number of unique values in a column, can slow performance. Grouping or rounding values can lessen cardinality and improve efficiency.
- Optimize relationships between tables: Use simple and efficient relationships between tables. Avoid many-to-many relationships, as they can drastically impact performance and complexity.
- Enable query reduction options: Turn on query reduction settings in Power BI to minimize the number of backend queries sent, especially in reports with slicers or high user interaction.
First things to do for Power BI performance optimization after analysis
Most times, the leading reason for poor Power BI performance is related to the type of data connection and data model you use. That's your first thing to look at—but not even by far, the only one.
Here are further steps you can take to power up your Power BI reports performance:
Get better-performing visuals
Better-performing visuals can make a world of difference for your Power BI reports, not just in terms of user-friendliness and providing access to data across the entire organization, but also in terms of actual Power BI performance.
To put things into perspective, let's take a look at a Zebra BI landing page report and run another performance analysis here. To create a similar report using Zebra BI visuals, start your free trial today.
A landing page report with improved performance
The performance report shows that this one is much faster – and here's why...
There are far fewer visuals on the page.
Essentially, we have four slicers, four content visuals, and three additional elements. That's pretty easy to manage from a performance standpoint. And even though there are fewer visuals, that doesn't mean there's less information available. After all, you can display multiple charts and much more information in every single visual.
Let's take a closer look at the report results.
Great results from individual visuals
Here, a DAX query took 105 seconds while the visual display only took 12 seconds. That's great! While the visual still had to wait 205 milliseconds for other elements to load, that's not a bad score.
Want to give Zebra BI a try?
Other things that slow down your reports
There are, of course, a number of things that can slow down Power BI reports. Some of the most common ones we’ve seen include:
Using DirectQuery for connections
You might be creating tables that use DirectQuery as the connection mode. This means that the data is not loaded into Power BI. Instead, it is loaded using a query that runs on a database server. This means additional time to fetch the data (and, as mentioned in our general guide on Power BI performance optimization, dependence on the speed of your database).
Also, this shows up as another item on the report, since Power BI first needs to fetch the data, process it using a PowerQuery and pass it on to a DAX command.
Row-level security
Another thing that can slow down your reports is row-level security. To check how it affects your visuals, you can open the Modelling tab, click View as and then select the role you want to analyze. You will see that the performance may change and can review what is happening.
Use a high-performing dashboard design layout
In our Power BI Performance Optimization webinar, Mark emphasized that effective report design should follow an overview-to-details structure rather than cramming everything onto one page.
His advice is to start with a fast-loading landing page containing only aggregated values and key insights with minimal visuals - aim for around four content visuals maximum. This creates an app-like experience where users can quickly see what interests them and then drill through to detailed pages for deeper analysis.
This approach segments the heavy data loads across multiple pages rather than forcing users to wait for one master page with excessive slicers and hierarchies to load completely before they can interact with any data.
How to run a more detailed DAX query analysis
Sometimes you might want to analyze a specific DAX query in more detail. Our latest webinar covered this, with Mark explaining, step-by-step, how to run in-depth DAX query analysis (without the headaches):
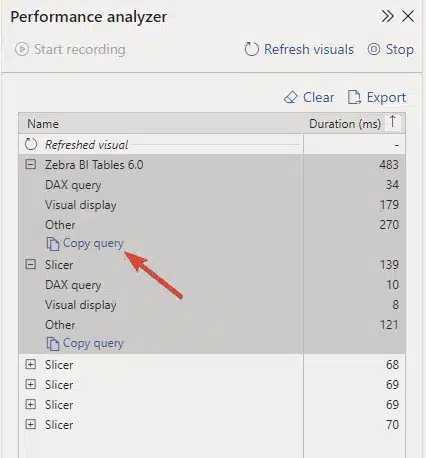
The Copy query command
- Start clean: Begin your performance analysis from a blank page to get accurate initial timings.
- Record performance: In Performance Analyzer, click 'Start recording' then 'Refresh visuals' to capture data.
- Copy the query: Click 'Copy query' for the specific visual you want to analyze in detail.
- Open DAX Studio: Access it through Power BI's External Tools ribbon - it will automatically connect to your current model.
- Configure analysis: Toggle on both 'Query Plan' and 'Server Timings' options before running your query.
- Run analysis: Paste the copied DAX query into DAX Studio and execute it to see detailed breakdowns of time spent in formula engine versus storage engine.
This process helps identify whether your performance bottleneck stems from DAX calculation logic or data retrieval operations. You can also export Performance Analyzer results as JSON for additional detail, though DAX Studio analysis typically provides sufficient information for most optimization work.
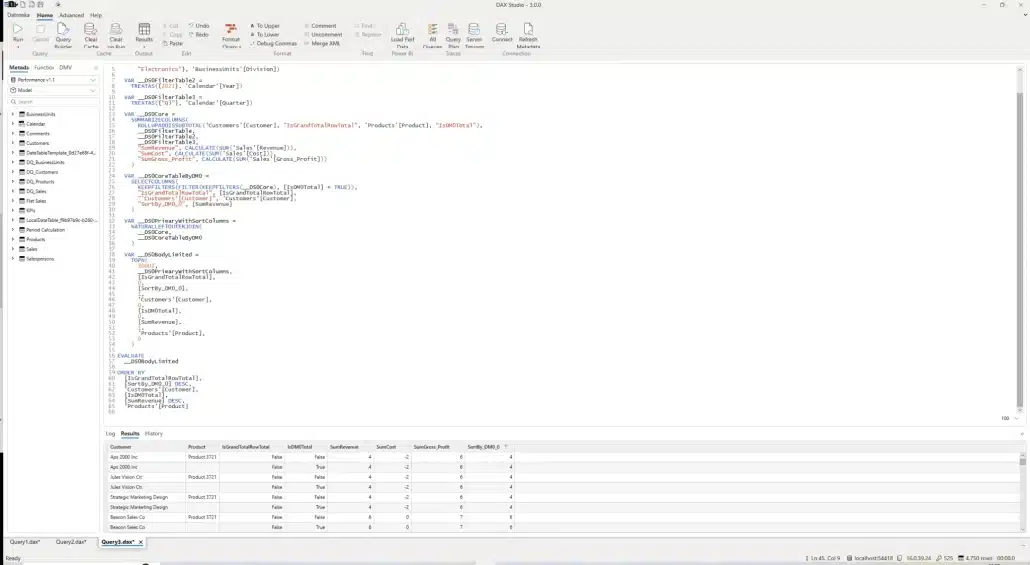
Dax Studio in action
2. Speed up your data model
Let's start by saying that 80% of performance issues are caused by the data model. The logical data model is the number one reason for performance issues. Here is an example of a data model that will cause problems for sure.

A complex data model
What is it that makes your data model messy and causes it to decrease your performance? It's things like many joins, relations, bridge tables, and so on. To make it actually work, you normally need complex DAX formulas with 10 or 20 lines. A good rule of thumb is that long DAX formulas are an indication of a poor data model.
Many-to-many relationships and unused columns often cause another issue. Always look at whether you are actually using them. If you're not, leave them out. You can always add more data fields and columns later on. Power BI is very flexible in this regard, so you don't have to worry about it breaking your existing reports.
But what does a lean data model look like, you may ask? Take a look at the example below.

A simple data model that runs FAST
This data model actually delivers the same functionality as the previous one. However, it is created using a simple star schema and leverages only the necessary columns. The DAX formulas we used are very simple. As a result, we've managed to reduce the number of tables in the model from 32 to 8 and make it 5 to 10 times faster for typical data queries.
By the way, if you want to learn how to create a Power BI data model for actionable reporting, Mark covered it in this video, check it out:
Reasons behind slow data models
There are a couple of reasons why these overly complex data models keep popping up.
Lack of proper data preparation
People essentially just load all the tables into Power BI and start creating relationships. Then, they need to write complex DAX formulas to tie everything together. To make everything run faster, however, you need to combine tables and merge them before you even load them into Power BI.
Separated fact tables
You might be working with a table with actual sales data and another one with plan data. People often load both of them separately and figure out the relationship between them in Power BI. For best results, these also need to be combined before loading into your data model.
Other major mistakes that slow down data models include using look-up tables instead of proper hierarchies and dimensions, and including every possible column into it (because, hey, somebody might need it sometime.)
As mentioned above, using row-level security can also be a performance killer.
How to speed up data models
So what can you do to make everything run faster?
Prep your data
Here are the steps you need to take to prepare your data:
- Combine or append the tables that are similar in structure and used for the same purpose. For example, fact tables like sales, actuals, plan and different forecasts can be combined or appended into a single table.
- Transform your hierarchies and attributes into single-table dimensions. For example, the goal is to have one table for your customers, with all their attributes and hierarchies, like region, country and so on.
- Filter out everything that you don't need.
Typically, you should do this in PowerQuery or on your data source (such as SQL server) and not in DAX. In the DAX model, you do add relationships, you use DAX for your KPIs and certain additional features, such as the calculation of certain data categories.
Making star schema really fast
Why is choosing the right model so important?
Technical tweaks of visuals can only get you so far. You can expect a 5% improvement. But the factor that impacts your performance the most is a logical data model and the way your data is organized.
Here are some rules that will help you make the star schema data model run really fast.
- Start with measures: Your fact table contains all your measures that can be implicit or explicit. The implicit measures are basically the columns from your source data like the cost, revenue and so on. An explicit measure, on the other hand, is something like a sum of revenue. A good practice here is not to use the columns from your database directly. First, create the explicit measures and then hide those implicit measures that you have in your source data.
- Foreign keys: These are the fields that are used for creating relationships, such as business unit ID, customer ID, product ID. Set these as integer fields. The goal is to create a long and narrow table that takes the minimum number of bytes to represent a value.
- Consider the granularity of your fact table: If you load your table with every document, sales order, and time stamp every five seconds, you're going to have a slow table. Reevaluate your granularity level needs – do you need your data sectioned into daily or monthly values?
Getting the dimensions right
In dimension tables, hide the foreign keys. All other values will be text. Also, make sure to remove any unnecessary columns to keep everything lean and clean.
When it comes to the Calendar dimension, use Date or DateID, not the DateTime data type. The latter is basically a timestamp with the number of milliseconds and seconds, which is why it's far too detailed.
Avoid calculated columns. You don't normally need the calculated columns and should just use measures. If you need something special, you can do the calculation in PowerQuery and generate the needed column as a normal column in a dimension.
The final tip is to remove the auto-date table in Power BI.
Push your calculations down the BI stack
There are many calculations that you can do in DAX. For example, calendar dimension calculations are something we've done in our tutorials and webinars. If you're experiencing performance issues, however, you'll want to move these things down the BI stack.
That means that you are not calculating these things every time a report is loaded or refreshed. Instead, calculations are done at the level of PowerQuery or your data source. Data is calculated before you import it into your Power BI report.
Also, you should always use simple DAX formulas, typically for non-additive measures.
Choose the right connection method
As also shown in our general guide on Power BI report performance optimization, you have several data connection methods in Power BI, each with its own benefits and drawbacks.
- The fastest method is Import mode. Essentially, this mode allows you to load the data once into Power BI, where it is then stored. Power BI uses the in-memory VertiPaq engine, which is exceptionally fast and delivers results almost immediately. It offers full DAX and PowerQuery support. The drawback is that Power BI limits semantic models on shared capacity to eight scheduled daily semantic model refreshes.
- To sidestep this issue, more demanding customers often switch to DirectQuery, which can be slow. You need to do your Power BI performance optimization at the source, which means you probably need a database administrator. And you will need to do these optimizations if you want a responsive report.
- The third method is Live Connection. You use it to connect to Azure Analysis Services or Azure Synapse. These databases are very similar to those used by Power BI, which delivers great performance. The drawbacks are limited DAX support and no PowerQuery functionalities.
The final method is the composite model. This is the recommended option if you need to use DirectQuery, because it compensates for some drawbacks.
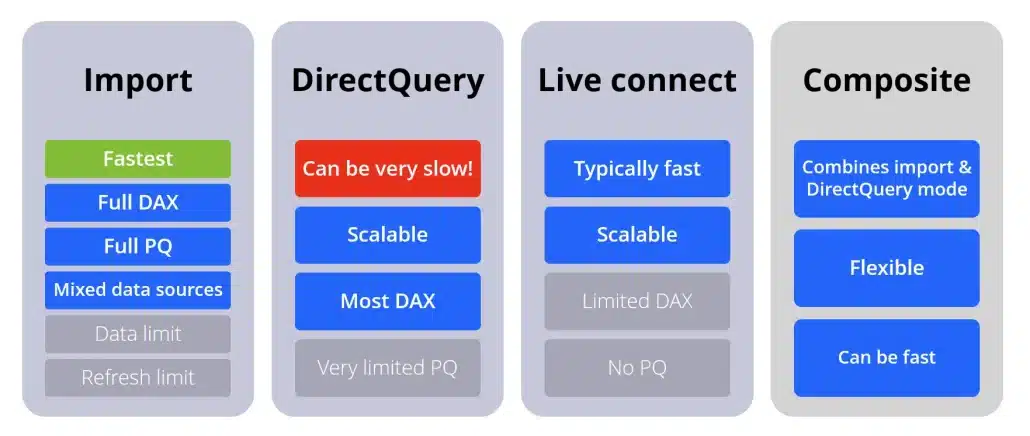
An overview of connection modes
Avoid row-level security if possible
Last but not least, avoid row-level security, which can be a performance killer. If you need it, make sure you are working with a clean star schema model. Try to edit it with simple rules and apply it to dimensions only.
Also, consider alternatives. When you are using simple rules, one option is to split your model into two separate reports and two separate datasets for different audiences. In this case, you don't need row-level security and both reports will work faster just because you split them into several parts.
3. Speed up your reports and visuals
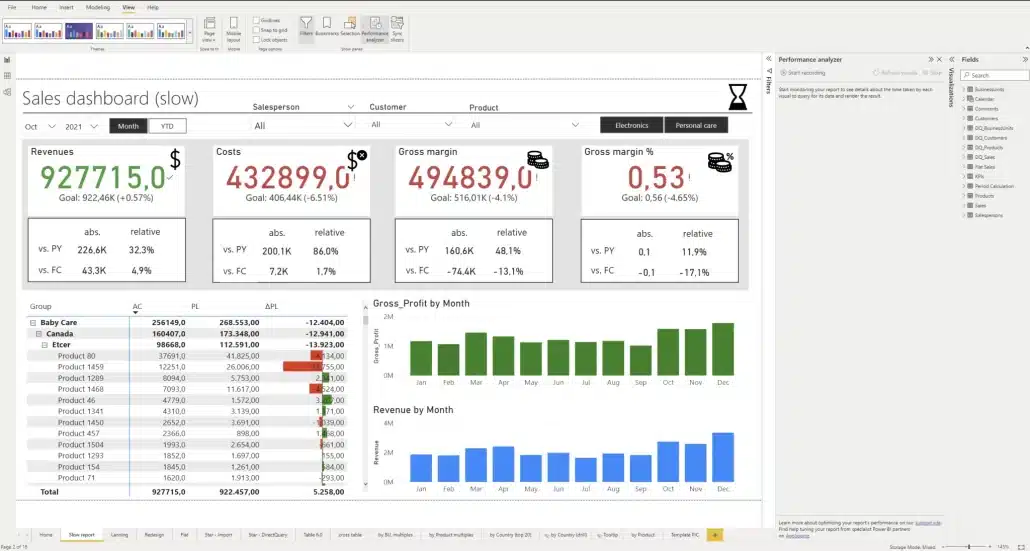
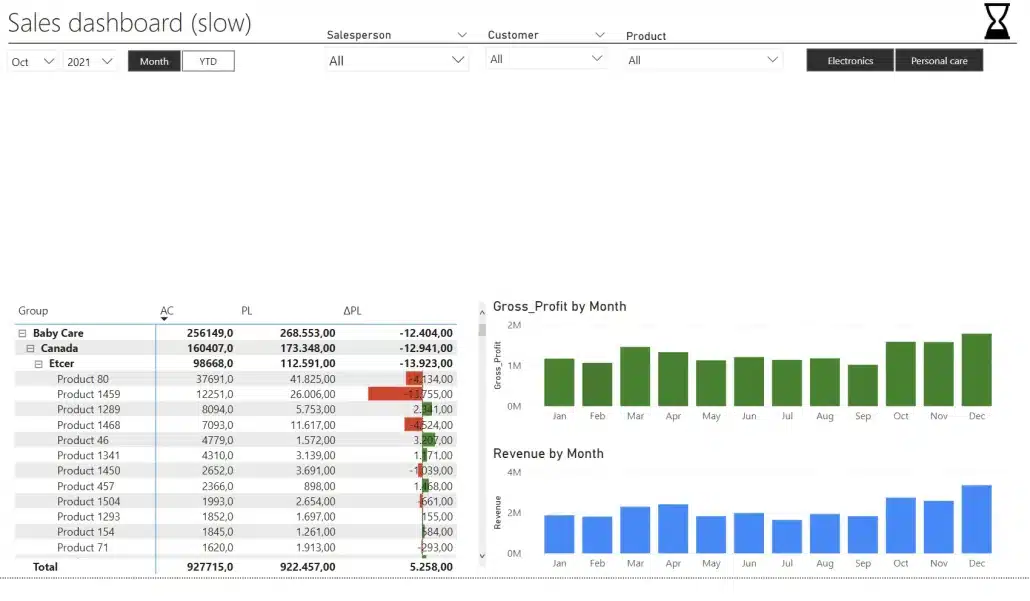
There is one thing that pops up almost always when we are seeing performance issues. It's putting too many elements into a report. Let's take another look at the report we analyzed at the beginning.

A slow report with too many elements
In our test, this report takes 5 seconds to load and you want to have it under 1 second. This is an extreme case, where every single part of the four card-type visuals is a separate element. Each individual part is its own visual. That makes it really slow.
We'll do a quick redesign and start by deleting the four groups of elements and replacing them with a Zebra BI Cards visual.
Deleted group of visual elements
Once we've done that, our performance analysis has shown that the load time has gone down to 700 milliseconds.
Now, we add the Zebra BI Cards custom visual and add it to our report. You then need to add individual measures (actuals, previous year and forecast) and group them by KPIs.
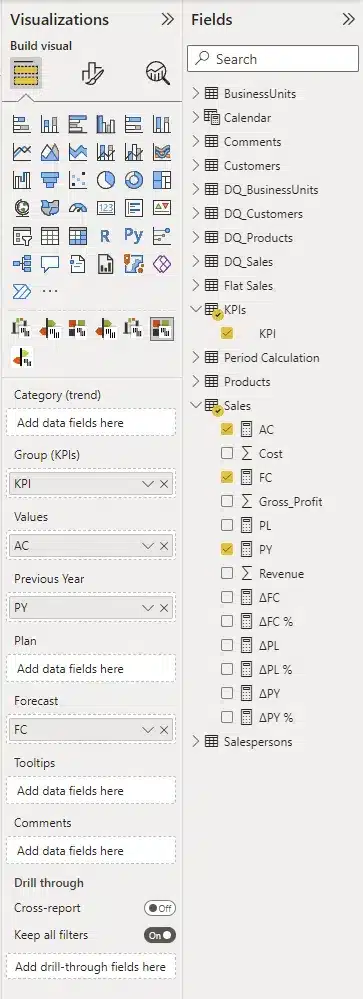
Setting up your Zebra BI Cards visual
We've replaced the complex group of visuals with a single clean visual that conveys the same information and still keeps the load time under one second.
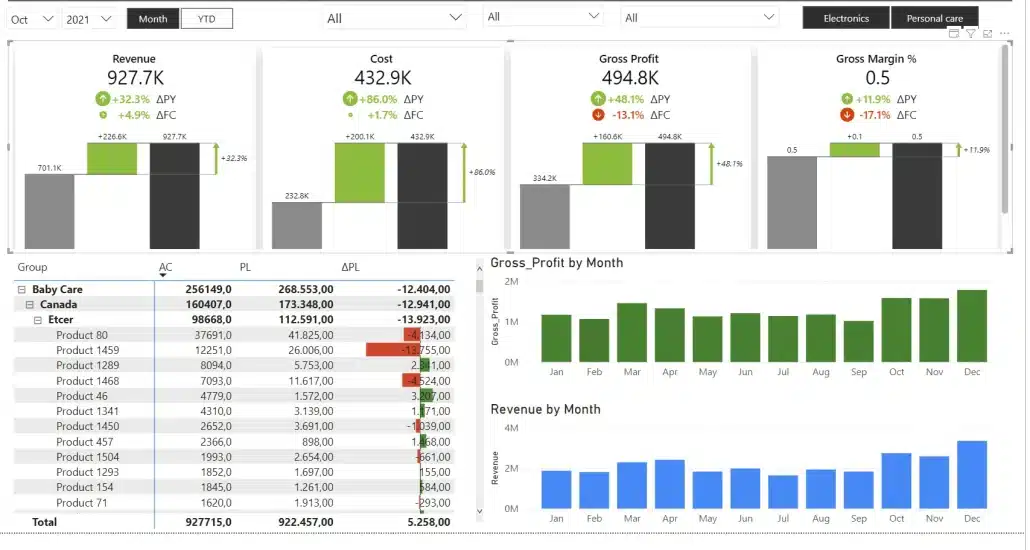
Redesigned faster report
We call this approach consolidating your visuals. In practice, this means that we are working with fewer visual but are not making any compromises when it comes to information. The same information is still there, it's just presented better.
Presenting your data in a multi-card type visuals is the best practice for this case.
Using cross-tables
Another powerful tool for consolidating your visuals is cross tables. Instead of having multiple tables, you can have a single table to display the relationships between two or more groups.
Example of a cross table
In the example above, you have a regular table with basic measures that then includes a period calculation to display more information. Since all of this is included in a single visual, it is still very fast.
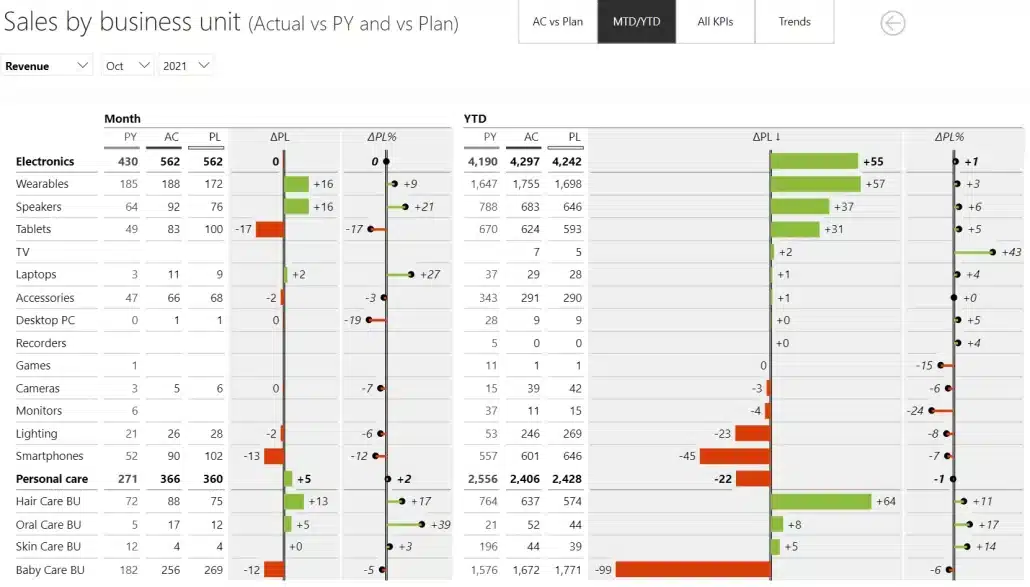
Small multiples to the rescue
The last helpful tool when it comes to selecting visuals is small multiples. This is another brilliant tool for improving the performance of your reports. For example, we've created an example report page with 9 charts for each individual group. It only took 33 milliseconds to render.
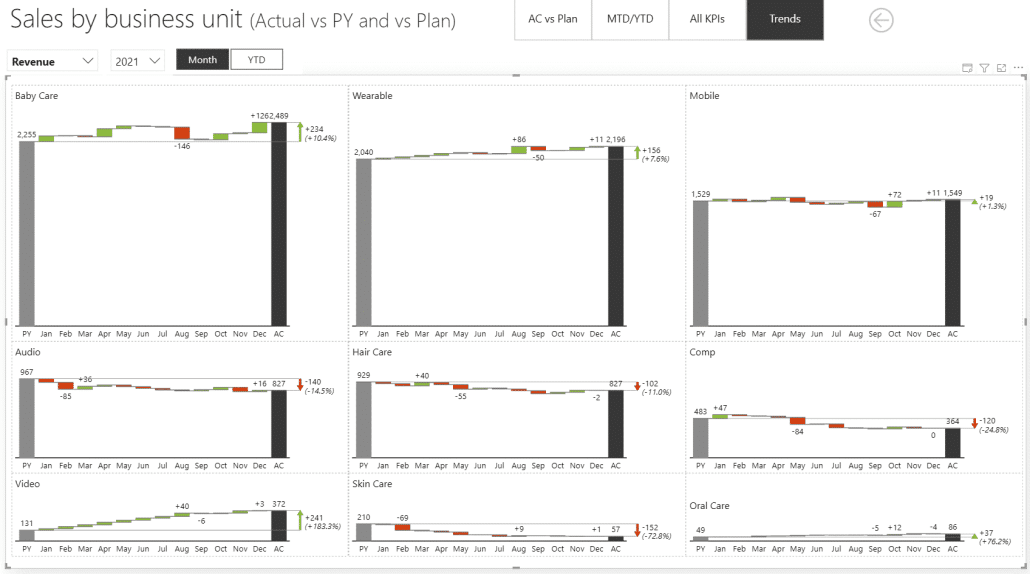
Small multiples for business units
This report is running in Import data mode and is ridiculously fast. Of course, adding more charts will slow down the performance somewhat. As a test, we've created a report with 144 charts – one for each individual product.
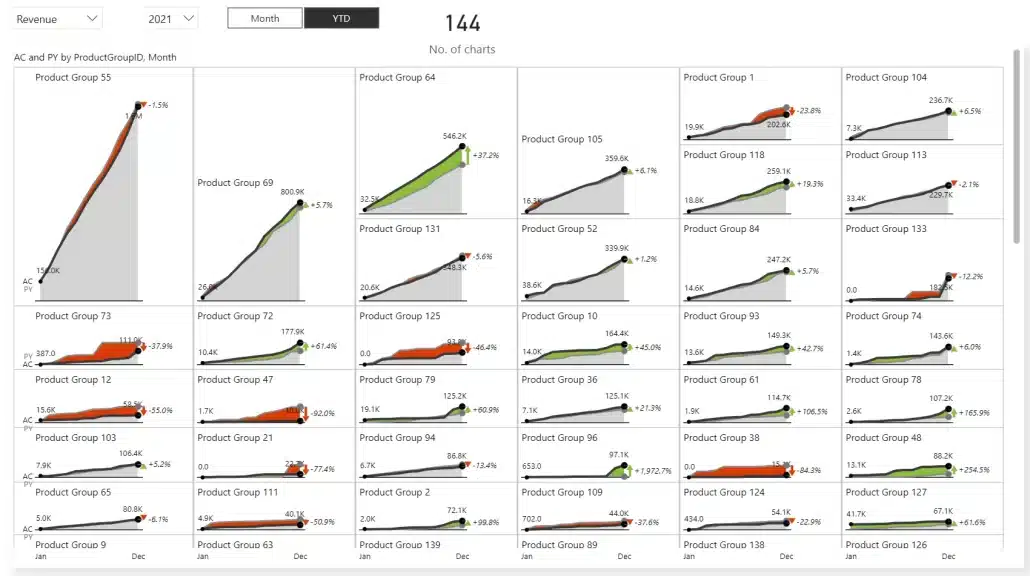
There are 144 charts on this visual, not all of which are visible at once
The results even surprised us. The render time was still under half a second.
An integrated approach to creating reports
As you consolidate your visuals, make sure that you start with a landing page that runs fast and will not take more than half a second to load. To do this, keep only the very good visuals without a lot of elements that still include variances and other key information.
Why does this page need to be so fast?
People will open it, it'll load, they will see things that interest them and they will click on them. They can click on specific elements to drill through to another report page and discover more information. Once they are interested in what they see, they're prepared to wait a bit longer. But the starting point needs to be extremely fast.
QuickPower BI optimization techniques checklist for ongoing success
Creating a high-performing dashboard requires careful planning and consistent maintenance. Here are four key strategies to ensure your dashboards run smoothly and efficiently:
1. Regularly audit with Performance Analyzer
Use tools like Performance Analyzer to identify bottlenecks and optimize your dashboard’s speed. Regular audits can help you pinpoint areas for improvement and maintain peak performance.
2. Reuse base measures
Streamline your dashboard by reusing base measures instead of creating duplicates. This not only reduces complexity but also improves processing time.
3. Establish documentation standards
Set clear standards for your dashboards, such as limits on visuals per page and refresh thresholds. Proper documentation ensures consistency and helps teams collaborate effectively.
4. Test with production-scale data
Always test your dashboards with real-world, production-scale data. This will help you anticipate potential issues and fine-tune performance before deployment.
By following these steps, you can deliver dashboards that are both efficient and user-friendly.
Real example: optimizing Power BI reports with Zebra BI
In the example in our webinar, Power BI Performance Optimization, Mark showcased a slow Power BI reports that was creating significant business problems. Poor load times were reducing user adoption, damaging organizational trust in data insights, and preventing teams from making timely decisions.
To get the report to run (much) faster, Mark implemented the following tactics:
- Data model optimization: Implemented star schema design to simplify data relationships and improve query performance. This foundational change streamlines how Power BI processes and retrieves data.
- DAX formula enhancement: Simplified complex DAX calculations and formulas to reduce computational overhead. Inefficient measures and calculations were identified and rewritten for optimal performance.
- Visual reduction and layout design: Streamlined report layouts by reducing visual complexity and removing unnecessary elements. Fewer visuals mean faster rendering and better user experience.
- Performance tool implementation: Leveraged specialized tools including DAX Studio for query analysis and bottleneck identification, Tabular Editor with Best Practice Analyzer for model scanning and bulk editing, Measure Killer for identifying unused measures and columns, and Power BI's built-in Performance Analyzer for runtime diagnostics.
After implementing these Power BI performance tuning tactics, load times improved by an impressive 97%, with one real-world example showing reports that previously took 15 seconds to load now completing in just 0.5 seconds. This dramatic performance boost restored user confidence and significantly increased report adoption rates.
Want to watch the full webinar and see a detailed demonstration of all performance optimization techniques and tools discussed?
Watch our full webinar, Power BI Performance Optimization: Best Practices, Star Schema & Tools,on-demand, featuring Zebra BI's Senior BI Expert Mark Leskovšek.
Power BI performance optimization: A recap
Speed is crucial to maintaining a great user experience. As we've seen, there are several ways of speeding up your reports and achieving maximum Power BI performance optimization, but the best and most efficient way is to focus on your data model. This will deliver truly impressive results and is the only way to really bring the load times down to a fraction of a second.
To get there, start by looking at the performance of your dashboards as a project. Take a look at what it is that is slowing them down and what the main culprits are. Next, reevaluate your data model. It's only after that that you are ready to start tweaking your visuals, consolidating and streamlining them.
To fully experience all the features demonstrated in this video tutorial, start your free trial of Zebra BI for Power BI and make your first step towards actionable, fast, and easy-to-understand-and-build Power BI reports.