 September 8th
 February 22nd
How to Combine Two Columns in Power BI: 2 Ways Explained
PRO Trial
Combining two columns in Power BI can be a useful technique to simplify your data and make it more accessible. This article will provide a complete guide on effectively combining two columns in Power BI. We will cover everything from understanding the need for combining two columns to best practices and troubleshooting common issues. If you want to combine two columns in Power BI, this article is for you.
Understanding the Need to Combine Two Columns in Power BI
Before diving into combining two columns, let's first understand its need. Combining two columns in Power BI is useful when you have related data across multiple columns and want to group them to make them more meaningful. For example, you may have a customer's first name in one column and their last name in another. Combining these two columns will create a new column with the customer's full name. This can make it easier to analyze, sort or filter data and create more precise visuals.
Another scenario where combining two columns in Power BI can be useful is when data is split across multiple columns you want to use as a single identifier. For instance, you may have a product's name in one column and its SKU (stock-keeping unit) in another. Combining these two columns will create a new column with a unique identifier for each product, which can be used to track inventory, sales, and other metrics. This can help you better understand your business and make more informed decisions.
In addition to the scenarios discussed above, combining columns in Power BI is predominantly used for data types other than numbers. When dealing with numerical data, you would probably use a calculation measure to effectively manipulate and analyze the data.
There are several methods to combine two columns in Power BI, each with its unique approach:
- Power Query: Power Query is essentially the ETL (Extract, Transform, Load) tool of Power BI. It provides several functions that can be used to combine columns, such as the 'Columns from Examples' function and the 'Custom column' function. These functions are particularly handy when you want to merge columns based on specific patterns or create new columns using data from existing ones.
- Formula Editor: The Formula Editor in Power BI uses Data Analysis Expressions (DAX), a formula language that allows users to define custom calculations for calculated columns and measures. DAX includes functions like
CONCATENATEandCOMBINEVALUESthat can merge two columns.
The CONCATENATE function joins two or more text strings into one text string, while the COMBINEVALUES function can combine text values with a delimiter.
Each method provides its features and is chosen based on the specific requirements of your data transformation tasks. By mastering these techniques, you can make your data more organized, accessible, and easier to analyze, ultimately enabling you to make better, more informed decisions for your business.
Create Advanced Reports in Power BI Easily
One visual, many visualizations! With Zebra BI, you can build any report you want, from sales dashboards to complex financial statements, right in your Power BI!
Step-by-Step Guide to Combining Two Columns in Power BI
Now that we understand the need for combining two columns let's take a step-by-step approach.
Combine two columns using Power Query Editor:
Step 1: Load Your Dataset in Power BI: The first step is to import your data into Power BI. You can accomplish this by clicking on 'Home' in the toolbar and selecting 'Get Data.' Browse your file location, select the file, and click 'Open'.
Step 2: Access Power Query Editor: Open the Data pane on the right-hand side of the Power BI interface once your data is loaded. Right-click on your dataset and select 'Edit Query' to launch the Power Query Editor.
Step 3: Select Columns to Merge: In the Power Query Editor window, select the columns you wish to merge by pressing 'Control' on your keyboard and clicking the desired columns. Once the columns are selected, navigate to the 'Add Columns' tab in the toolbar and select 'Column From Examples' -> 'From Selection'.
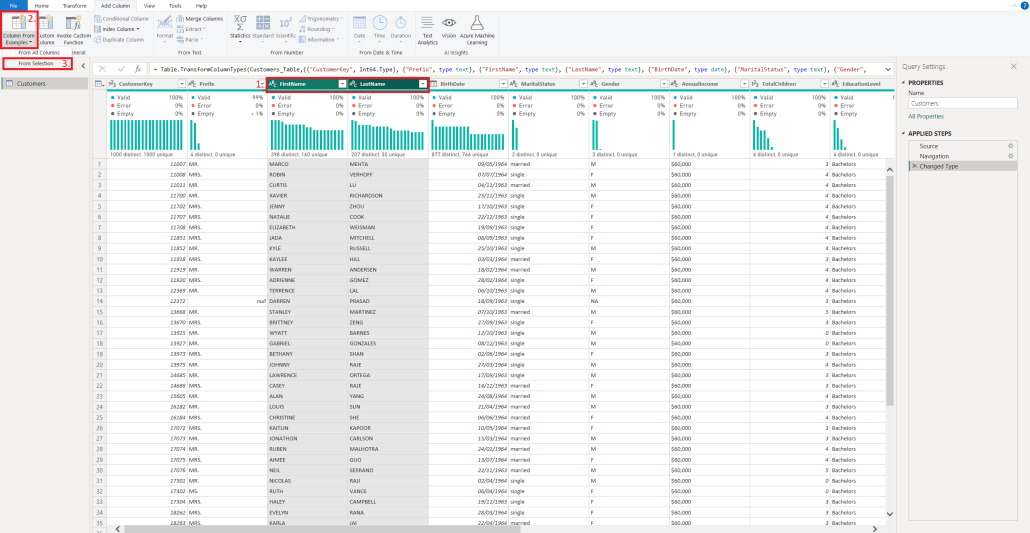
Step 4: Enter Desired Output: In the new column labeled "Column 1," you must enter an example of your desired output. This instructs Power BI about how the columns should be combined. You can rename the new column by double-clicking on the column header and typing in the new name.
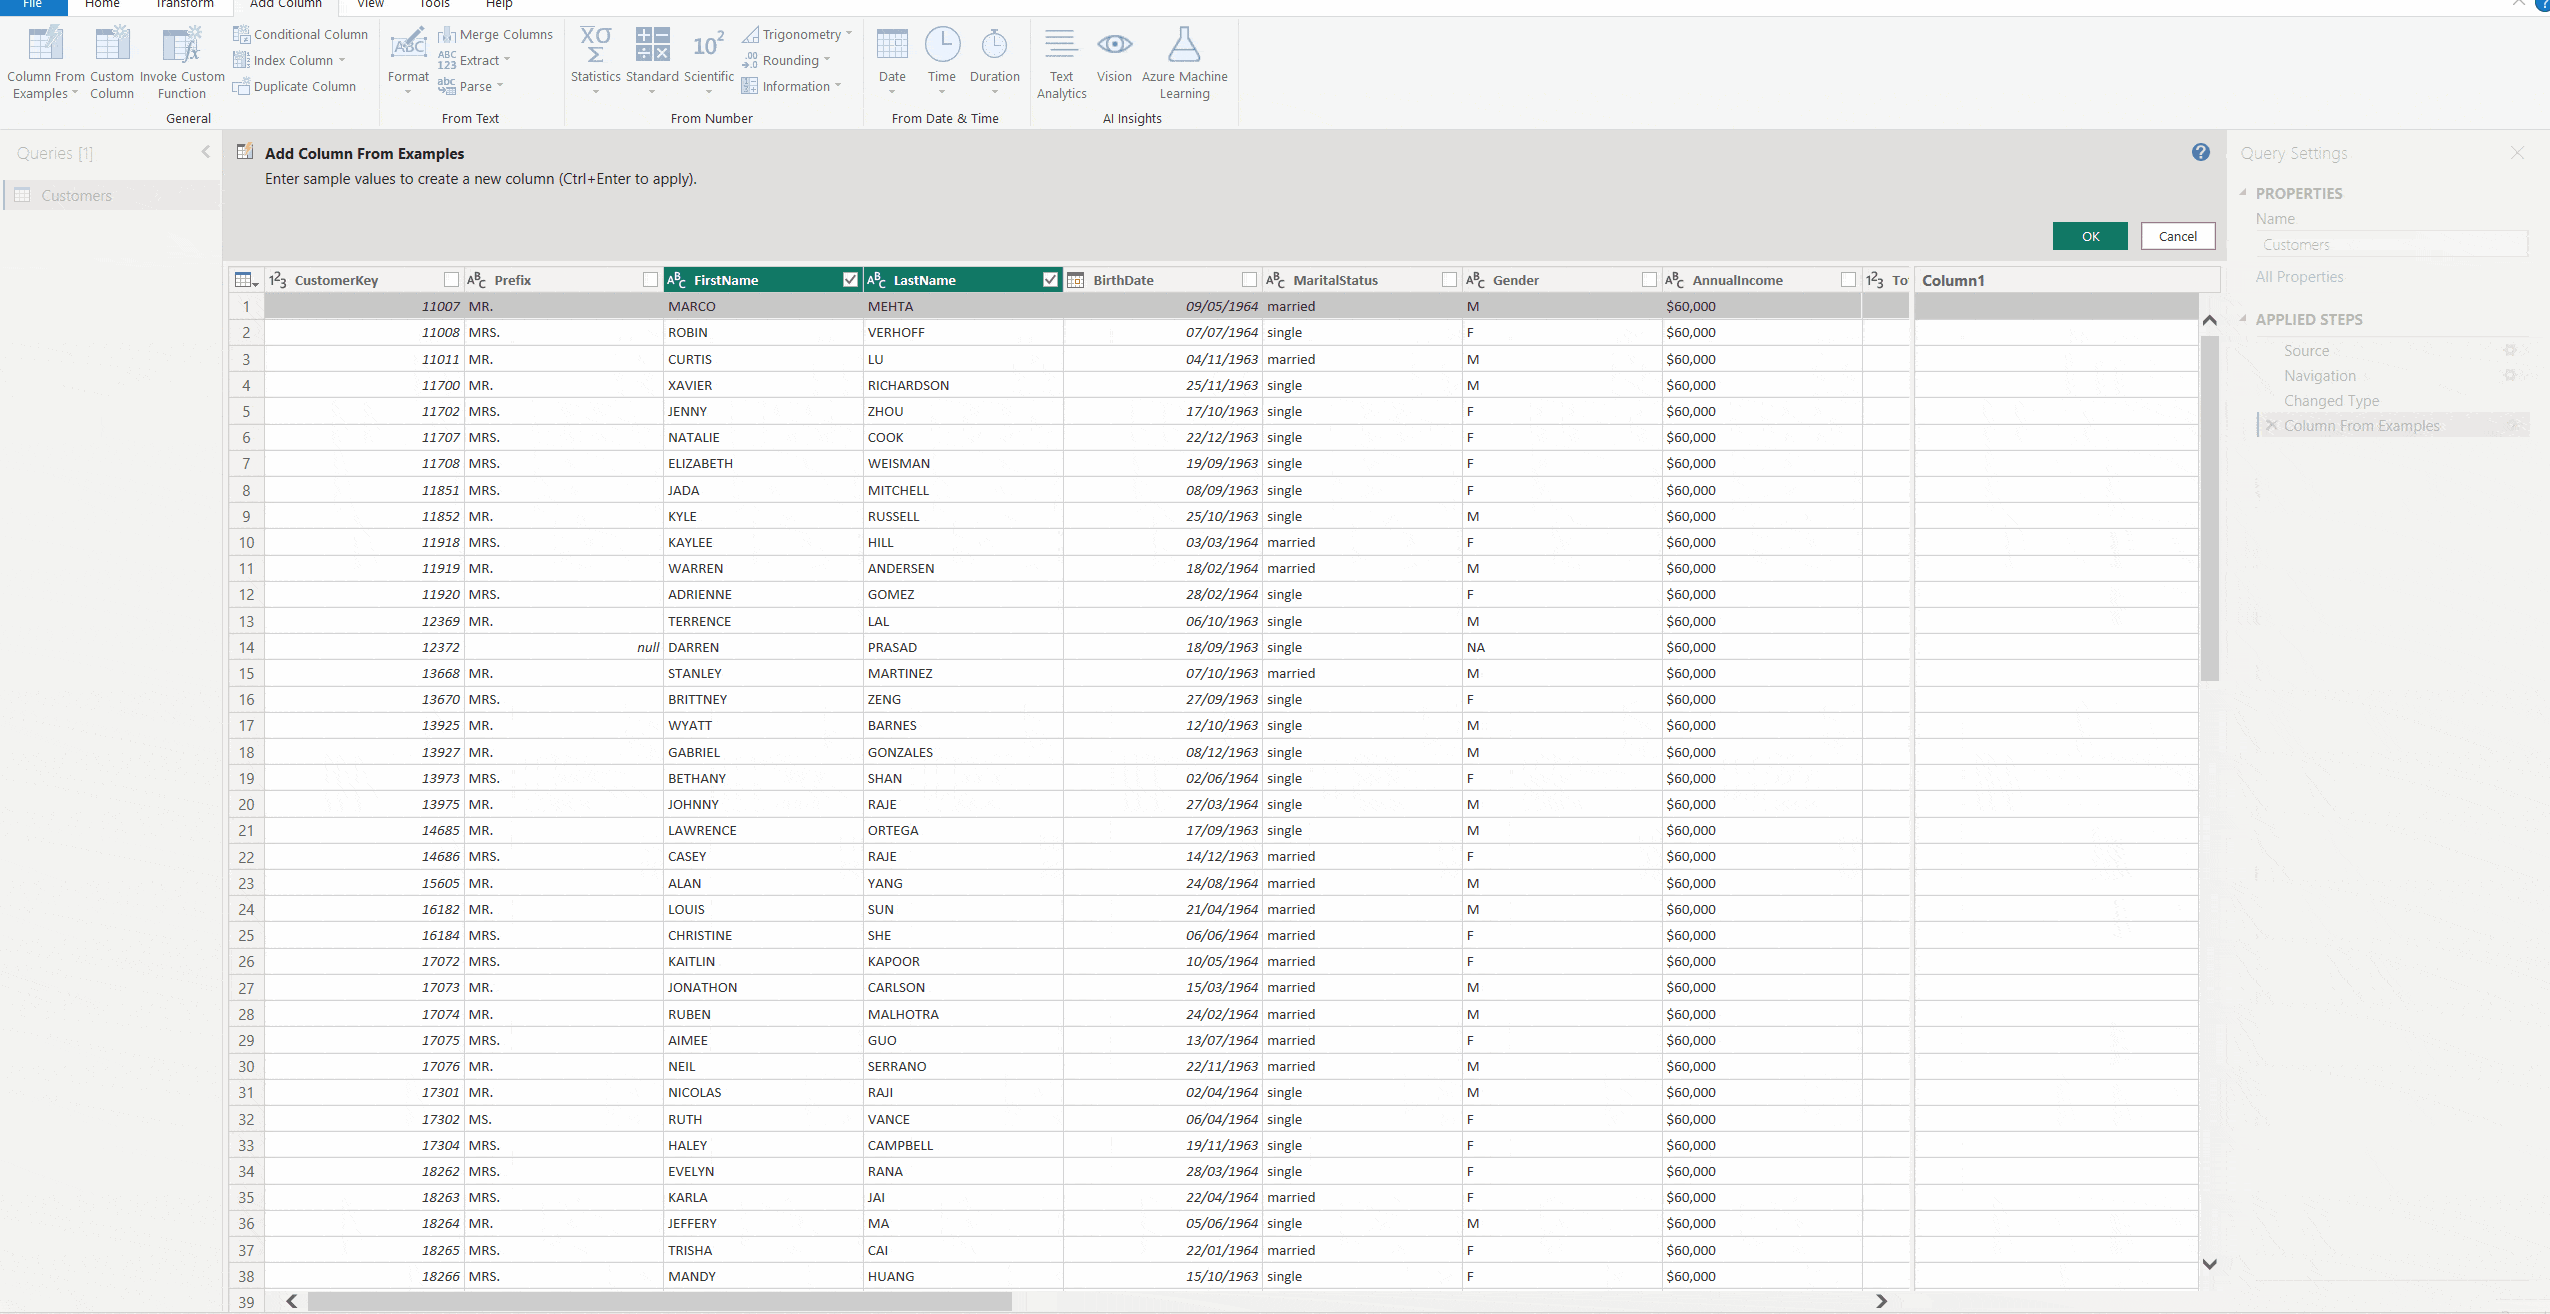
Step 5: Create a Combined Column: Click' OK' after entering your desired output. Power BI will now generate your new combined column in accordance with the example you provided.
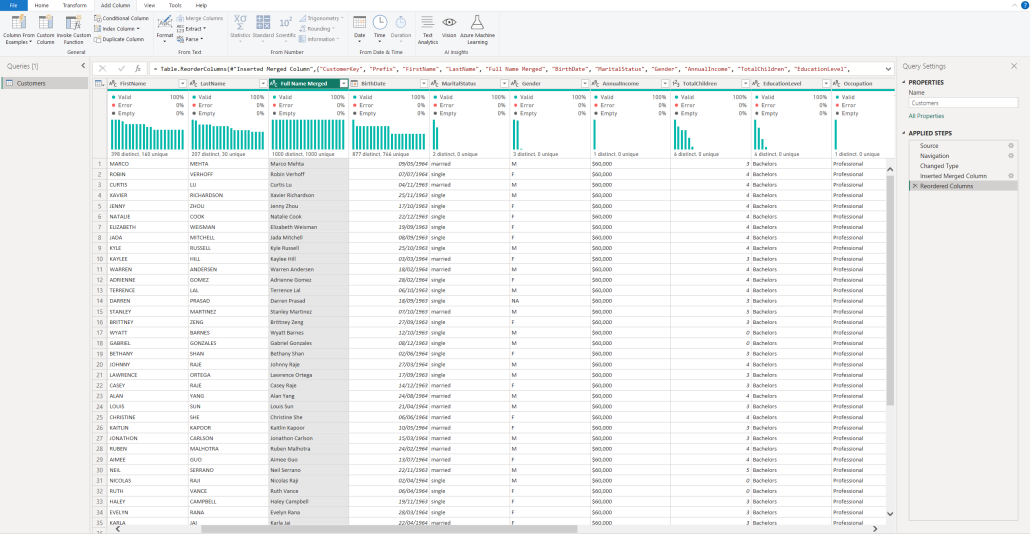
Step 6: Remove Redundant Columns: If the original columns used to create the new combined column are no longer needed, you can remove them to avoid redundancy. Select the columns and use the 'Remove Columns' function from the 'Home' tab in the toolbar.
This process allows you to create meaningful data constructs from separate columns in your dataset, making data analysis tasks in Power BI more efficient and precise. Remember that combining columns is a common practice in data transformation tasks and plays a crucial role in data modeling and reporting in Power BI.
Combine two columns using the Formula Editor:
Now, we'll combine two columns in Power BI using the Formula Editor and the DAX CONCATENATE function. This method is especially useful for combining text fields.
Step 1: Load Your Dataset in Power BI and Access Data View: Like before, you start importing your data into Power BI. After successfully loading your dataset, navigate to the 'Data View' by clicking the table icon located on the left side of the Power BI interface.
Step 2: Create a New Column: In the 'Data View', find the 'Table Tools' tab at the top of the Power BI interface. Within this tab, select 'New Column'. A new field will appear where you can type in your formula.
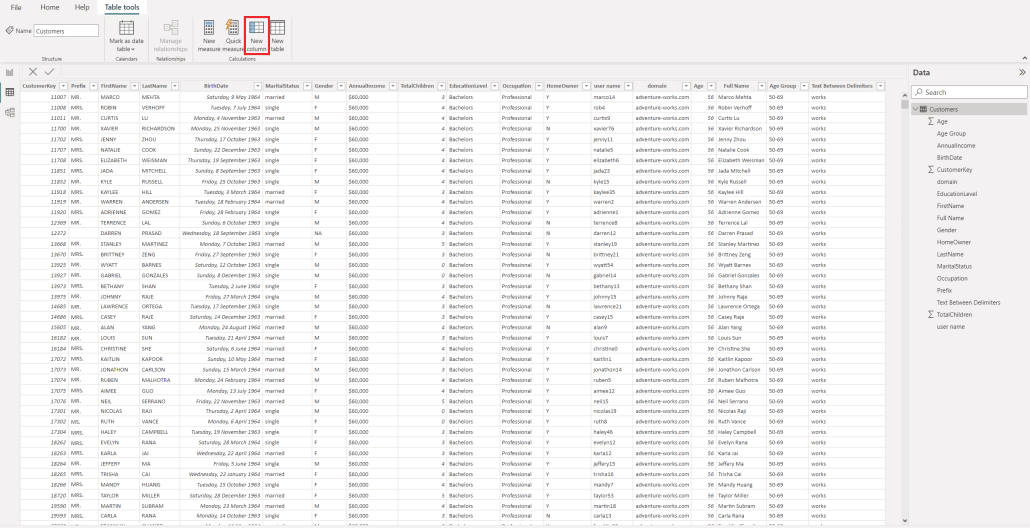
Step 3: Enter the Formula: Enter your DAX formula in the new column field. For example, if you want to combine a customer's first name and last name into a full name, you would use the CONCATENATE function and type in the formula as follows: "Full Name Merged = CONCATENATE(Customers[FirstName]&" ", Customers[LastName])". The "&" symbol creates space between the first and last names. After typing in your formula, press 'Enter'.
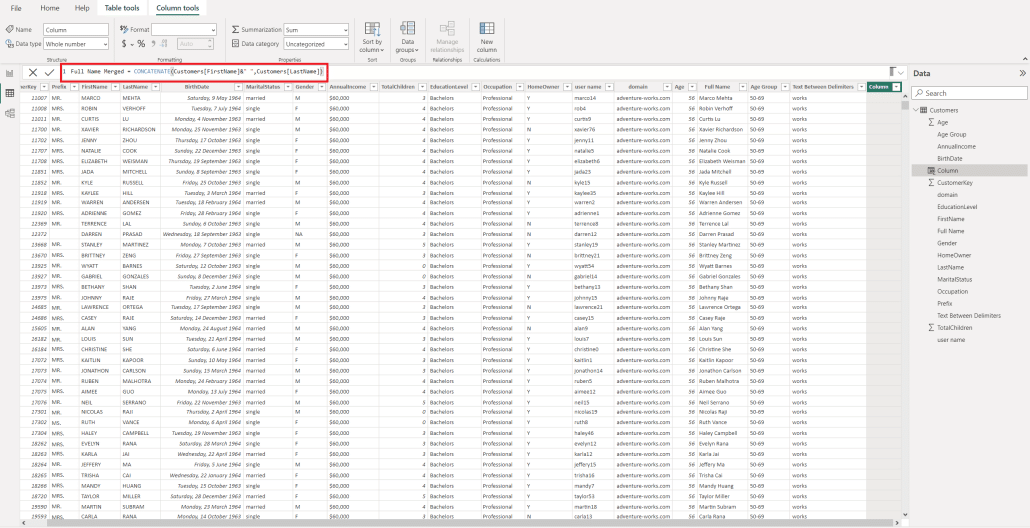
Power BI will create your new combined column based on your provided formula. You can see this new column in the 'Data View' and use it in your reports and dashboards. This method of combining columns allows for great flexibility and control over the transformation of your data, making it a powerful tool for creating precise and insightful data analyses.
It is important to note that the order in which you select the columns to combine will affect the order of the data in the new combined column. For example, if you select the 'First Name' and 'Last Name' columns and merge them with a space as the delimiter, the new column will have the first name followed by the last name. However, if you select the 'Last Name' and 'First Name' columns and merge them with a space as the delimiter, the new column will have the last name followed by the first name. Therefore, selecting the columns in the correct order is important to get the desired result.
Creating a New Column by Combining Two Columns in Power BI
Combining two columns in Power BI can create a new column that holds the combined data. This new column can be used in calculations, sorting, and filtering data. Here are a few things to keep in mind when creating a new column:
Column Name:
Choose a name for the new column that is meaningful and descriptive of the data it holds. This will make it easier for you and others to understand the data.
Data Type:
Choose the appropriate data type for the new column. This will ensure you can use this column in calculations and visuals without errors.
Best Practices for Combining Two Columns in Power BI
Here are a few best practices to keep in mind when combining two columns in Power BI:
Review Data:
Before merging columns, review the data to ensure it is correct and accurate. Merging incorrect data can lead to inaccurate results.
Backup Data:
Always back up your data before combining columns. This can help you roll back to the original data if something goes wrong in the process.
Choose Delimiter Carefully:
When using a delimiter to merge columns, choose it carefully. Ensure that the delimiter is not present in the data, as this can cause issues in the merge.
Troubleshooting Common Issues While Combining Two Columns in Power BI
Here are a few common issues that you may encounter while merging columns and their solutions:
Issue 1: Data Type Mismatch Error
Solution: Convert the columns to a compatible data type before merging them. Ensure that the data types match before merging them.
Issue 2: Missing Data
Solution: Review the data to ensure all the rows have data in the selected columns. If not, you can use the 'Add Conditional Column' option in the Power Query Editor to create a new column with a default value.
Visualizing Combined Data with Charts and Graphs in Power BI
You can create visuals to represent the data once you have combined two columns in Power BI. Here are a few tips:
Choose the Right Visual:
Choose the right visual to represent the data. For example, a bar chart may be suitable for comparing the merged data across categories.
Use Drilldowns:
Use drill-downs to provide more insights into the data. For example, you can use drill-downs to show the merged data by category, subcategory, and product.
Amplifying Power BI Data Visualizations Using Zebra BI Custom Visuals
One way to take your data visualization to the next level is using custom visuals from third-party providers, such as Zebra BI. Zebra BI offers Microsoft-certified custom visuals for Power BI that can enhance your data analysis and presentation.
Watch the video below to learn more about using Zebra BI visuals in Power BI:
Key Features of Zebra BI Visuals:
Zebra BI visuals offer an array of features to make your Power BI reports more powerful and insightful:
- Out-of-the-Box Calculated Variances: Zebra BI visuals can automatically calculate variances in your data, providing instant insights into differences between actual and projected data.
- Responsive Layout: The layout of Zebra BI visuals adjusts automatically based on the size and orientation of your report page, ensuring optimal readability and visual appeal.
- Advanced Charts and Tables: Zebra BI offers a variety of advanced visualization options, including waterfall charts and small multiples, which can be used to represent complex data trends in a clear, digestible way.
- Dynamic Comments: With Zebra BI visuals, you can add dynamic comments to your charts and tables, allowing for nuanced interpretations and explanations of data.
- Drilldowns: Zebra BI visuals support drill-downs, enabling you to dive deeper into your data for detailed analysis.
- Tooltips: Zebra BI's custom tooltips provide additional context and information when users hover over data points, enhancing comprehension and engagement.
And many more features that turn your data into meaningful insights, all within Power BI's easy-to-use interface. With Zebra BI visuals, you can take your Power BI reports and dashboards to the next level, providing a more comprehensive and intuitive understanding of your data.
Get Actionable Insights from your data in Power BI
Enhance your Power BI reports with Zebra BI, intuitive visualization tools, and gain insights from your data quickly and efficiently.
Advanced Techniques for Combining Multiple Columns in Power BI
While we have covered combining two columns in Power BI, you may need to combine multiple columns to get the desired results. Here are a few advanced techniques:
Method 1: Combine Columns in Stages:
You can combine columns in stages by creating new columns and combining them using the steps outlined above. This can help you customize the merge and deal with data type issues.
Method 2: Use Unpivot Columns:
You can use the 'Unpivot Columns' option in the Power Query Editor to convert multiple columns into rows. You can then merge the rows and convert them back to columns.
Examples of Real-World Use Cases for Combining Two Columns in Power BI
Here are a few real-world examples where combining two columns in Power BI can be useful:
Example 1: Combining Dates and Times
You can combine date and time columns to create a new column that holds the date and time together. This can be useful in scenarios where you need the combined date and time for analysis.
Example 2: Combining Product Name and SKU
You can combine a product name column and an SKU column to create a new column that holds the product name and SKU together. This can be useful when identifying products by their name and SKU.
Tips and Tricks for Combining Two Columns Efficiently in Power BI
Here are a few tips and tricks for combining two columns efficiently in Power BI:
Get Familiar with the Power Query Editor:
The Power Query Editor is a powerful tool that can help you manipulate and clean data. Spend some time getting familiar with it to improve your skills in combining two columns.
Read more about this topic:
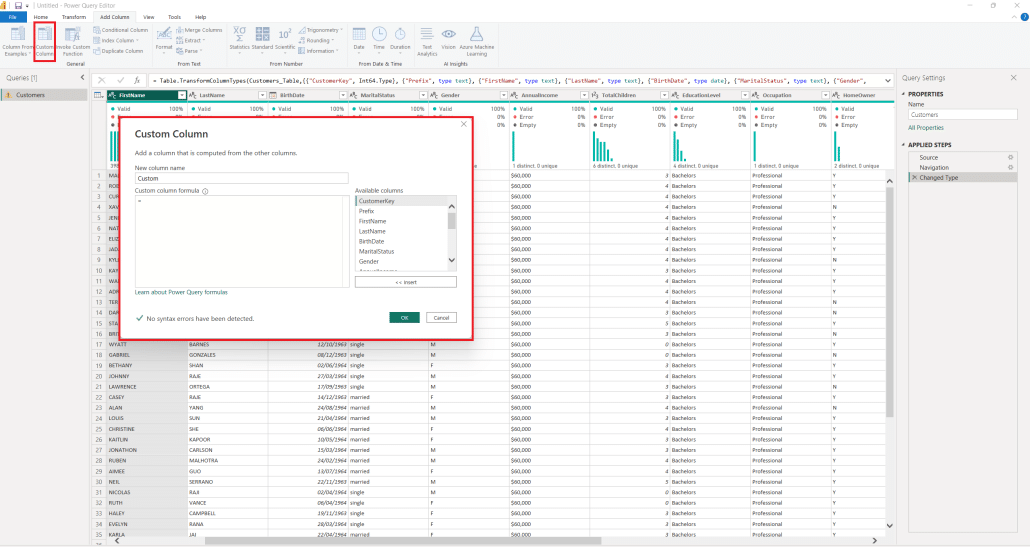
For more complex scenarios, you might need to add a Custom Column. As you can see, this option requires you to add a formula. The formula language used in Power Query Editor is called M and is very powerful. Go to Add Column Tab and select Custom Column.
Sometimes you need to split columns first and then combine columns differently. Read how to do it in our Power Query Editor Knowledge Base article.
Conclusion
Combining two columns in Power BI can be a useful technique to simplify your data and make it more meaningful. By following the steps, best practices, and tips outlined in this article, you can combine two columns efficiently and get more insights from your data. Always review and back up your data before making any changes, and choose the appropriate visualizations to represent your data. Explore Power BI's advanced techniques to combine multiple columns and enhance your analysis further.
We recommend utilizing Power Query for data preparation, as it fosters a well-organized dataset that enhances Power BI analysis. Moreover, data prepared via Power Query tends to boost the performance of your reports, offering an advantage over solely relying on DAX measures.