 September 8th
 February 22nd
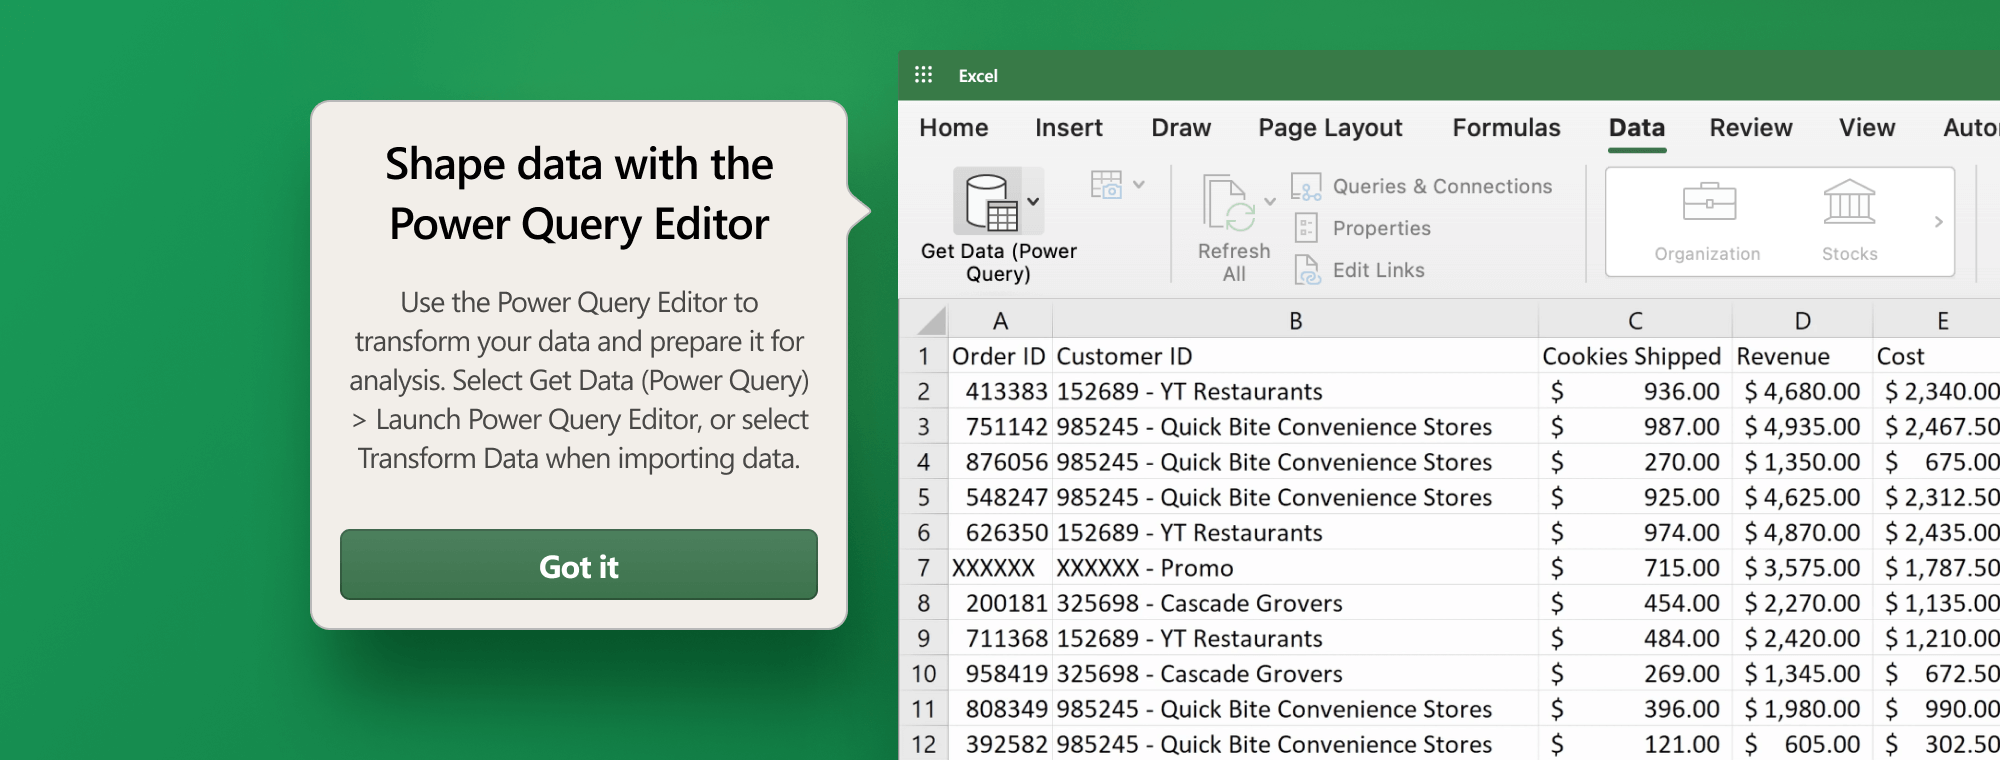
Master the Art of Data Transformation: Use Power Query to Transform Data in Excel
Welcome to the fascinating world of Power Query, the secret weapon in every data wizard's arsenal! This powerful tool greatly simplifies the process of molding raw data into a meaningful format for further analysis and visualization. When you use Power Query to transform data in Excel, you're streamlining your data manipulation tasks and setting the stage for powerful insights. This will guide you toward better decision-making and more informed strategies.
Learning and mastering Power Query is like learning to ride a bike; it may be a bit challenging at first, but once you get the hang of it, you’ll be able to transform data quickly and easily. Read on to learn all about it.
But before we dive into the how-to, let's take a look at where you can find Power Query & how you can navigate it.
Accessing Power Query in Excel
Where to find it
If you're ready to use Power Query to transform data in Excel, you'll be glad to know that accessing it is easier than you think. Here's how you can go about it:
- Open Excel and create a new workbook.
- Click on the "Data" tab in the Excel ribbon.
- In the "Get & Transform Data" section, you'll find the Power Query options:
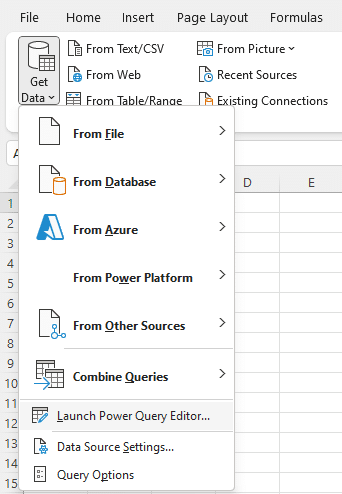
- To launch the Power Query editor, click on "Get Data" and choose your desired data source or select "Launch Power Query Editor" from the dropdown menu.
And voilà! You've now successfully entered the realm of Power Query, where your data transformation journey begins.
How to navigate it
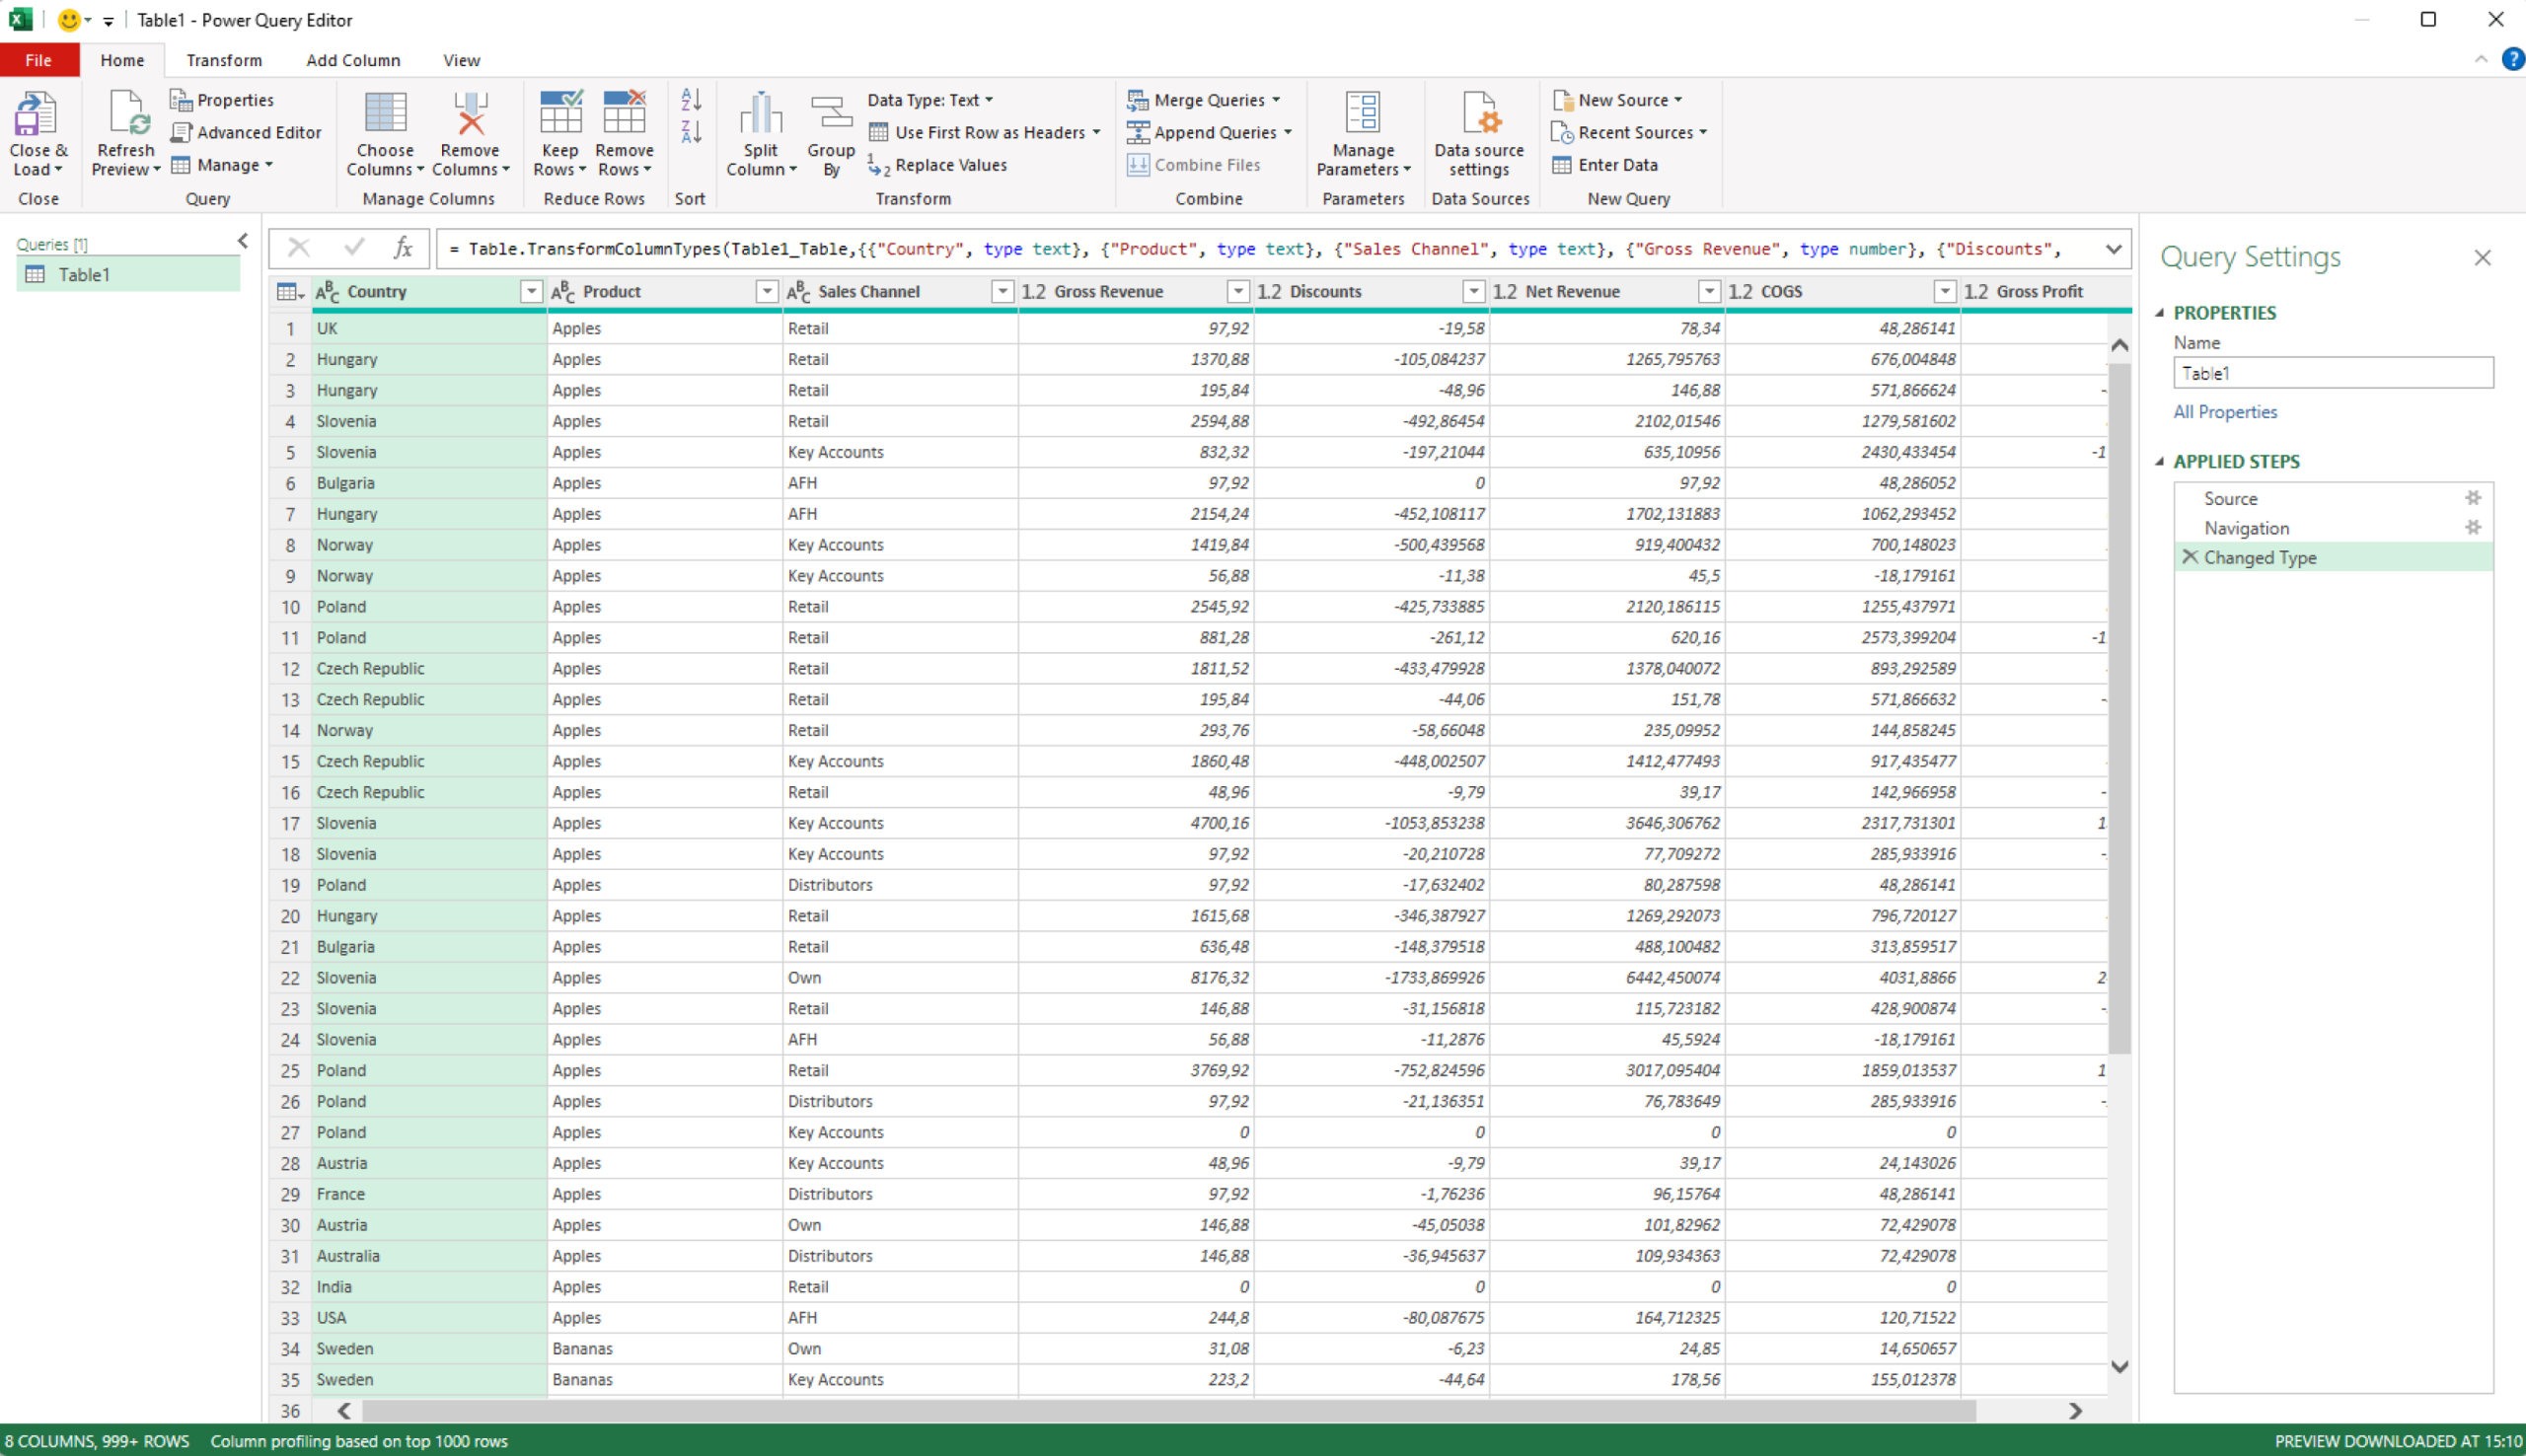
Now that you've unlocked the Power Query editor, you're almost ready to start transforming your data. Before you do that, let's take a quick tour of its interface:
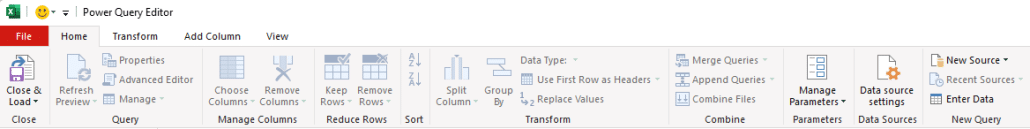
- Home Tab: This is where most of your data transformation actions will take place. It offers options for connecting to data sources, refreshing data, and applying basic transformations.
- Transform Tab: The Transform tab is where the real magic happens. It contains advanced transformation options such as grouping, pivoting, and text manipulation.
- Add Column Tab: Need to create custom columns or apply advanced calculations? This is the place to be. The Add Column tab offers a range of functions to help you enrich your dataset.
- View Tab: The View tab allows you to toggle various panes and settings within the Power Query editor, such as the formula bar, data preview, and query settings.
- Query Pane: Located on the left side of the editor, the Query Pane displays a list of queries within your workbook. Clicking on a query will reveal its applied steps and properties in the right-side panes.
- Data Preview Pane: This central pane showcases a preview of your data, allowing you to see the results of your transformations in real-time.
- Applied Steps Pane: As you work your transformation magic, the Applied Steps Pane on the right side will keep a record of your actions. You can easily modify or delete steps as needed.
With the Power Query interface covered, all that's left to do is start transforming your data! Let's dive right in, shall we?
Loading data into Power Query
With Power Query, you can connect to almost any type of data. From simple Excel files and CSVs to databases and online services, it is your trusted ally when you need to transform data in Excel. But how exactly do you go about connecting to your data sources?
To connect to a data source and pave the way to using Power Query to transform data in Excel, follow these steps:
- In the Power Query editor, click on the "Data" tab.
- Click on "Get Data" to reveal a dropdown menu with different data source categories:
- File: Connect to file-based sources such as Excel, CSV, JSON, XML, and more.
- Database: Connect to popular databases like SQL Server, Oracle, MySQL, and PostgreSQL.
- Online Services: Access data from cloud services like SharePoint, Salesforce, or Microsoft Dynamics 365.
- Other: Connect to various other sources, including OData feeds, Web pages, and custom data connectors.
- Select your desired data source category and then choose the specific source from the list.
- Follow the prompts to provide connection details and credentials (if required).
Once you've connected to a data source, importing data into Power Query is a breeze. Here's how to go about it:
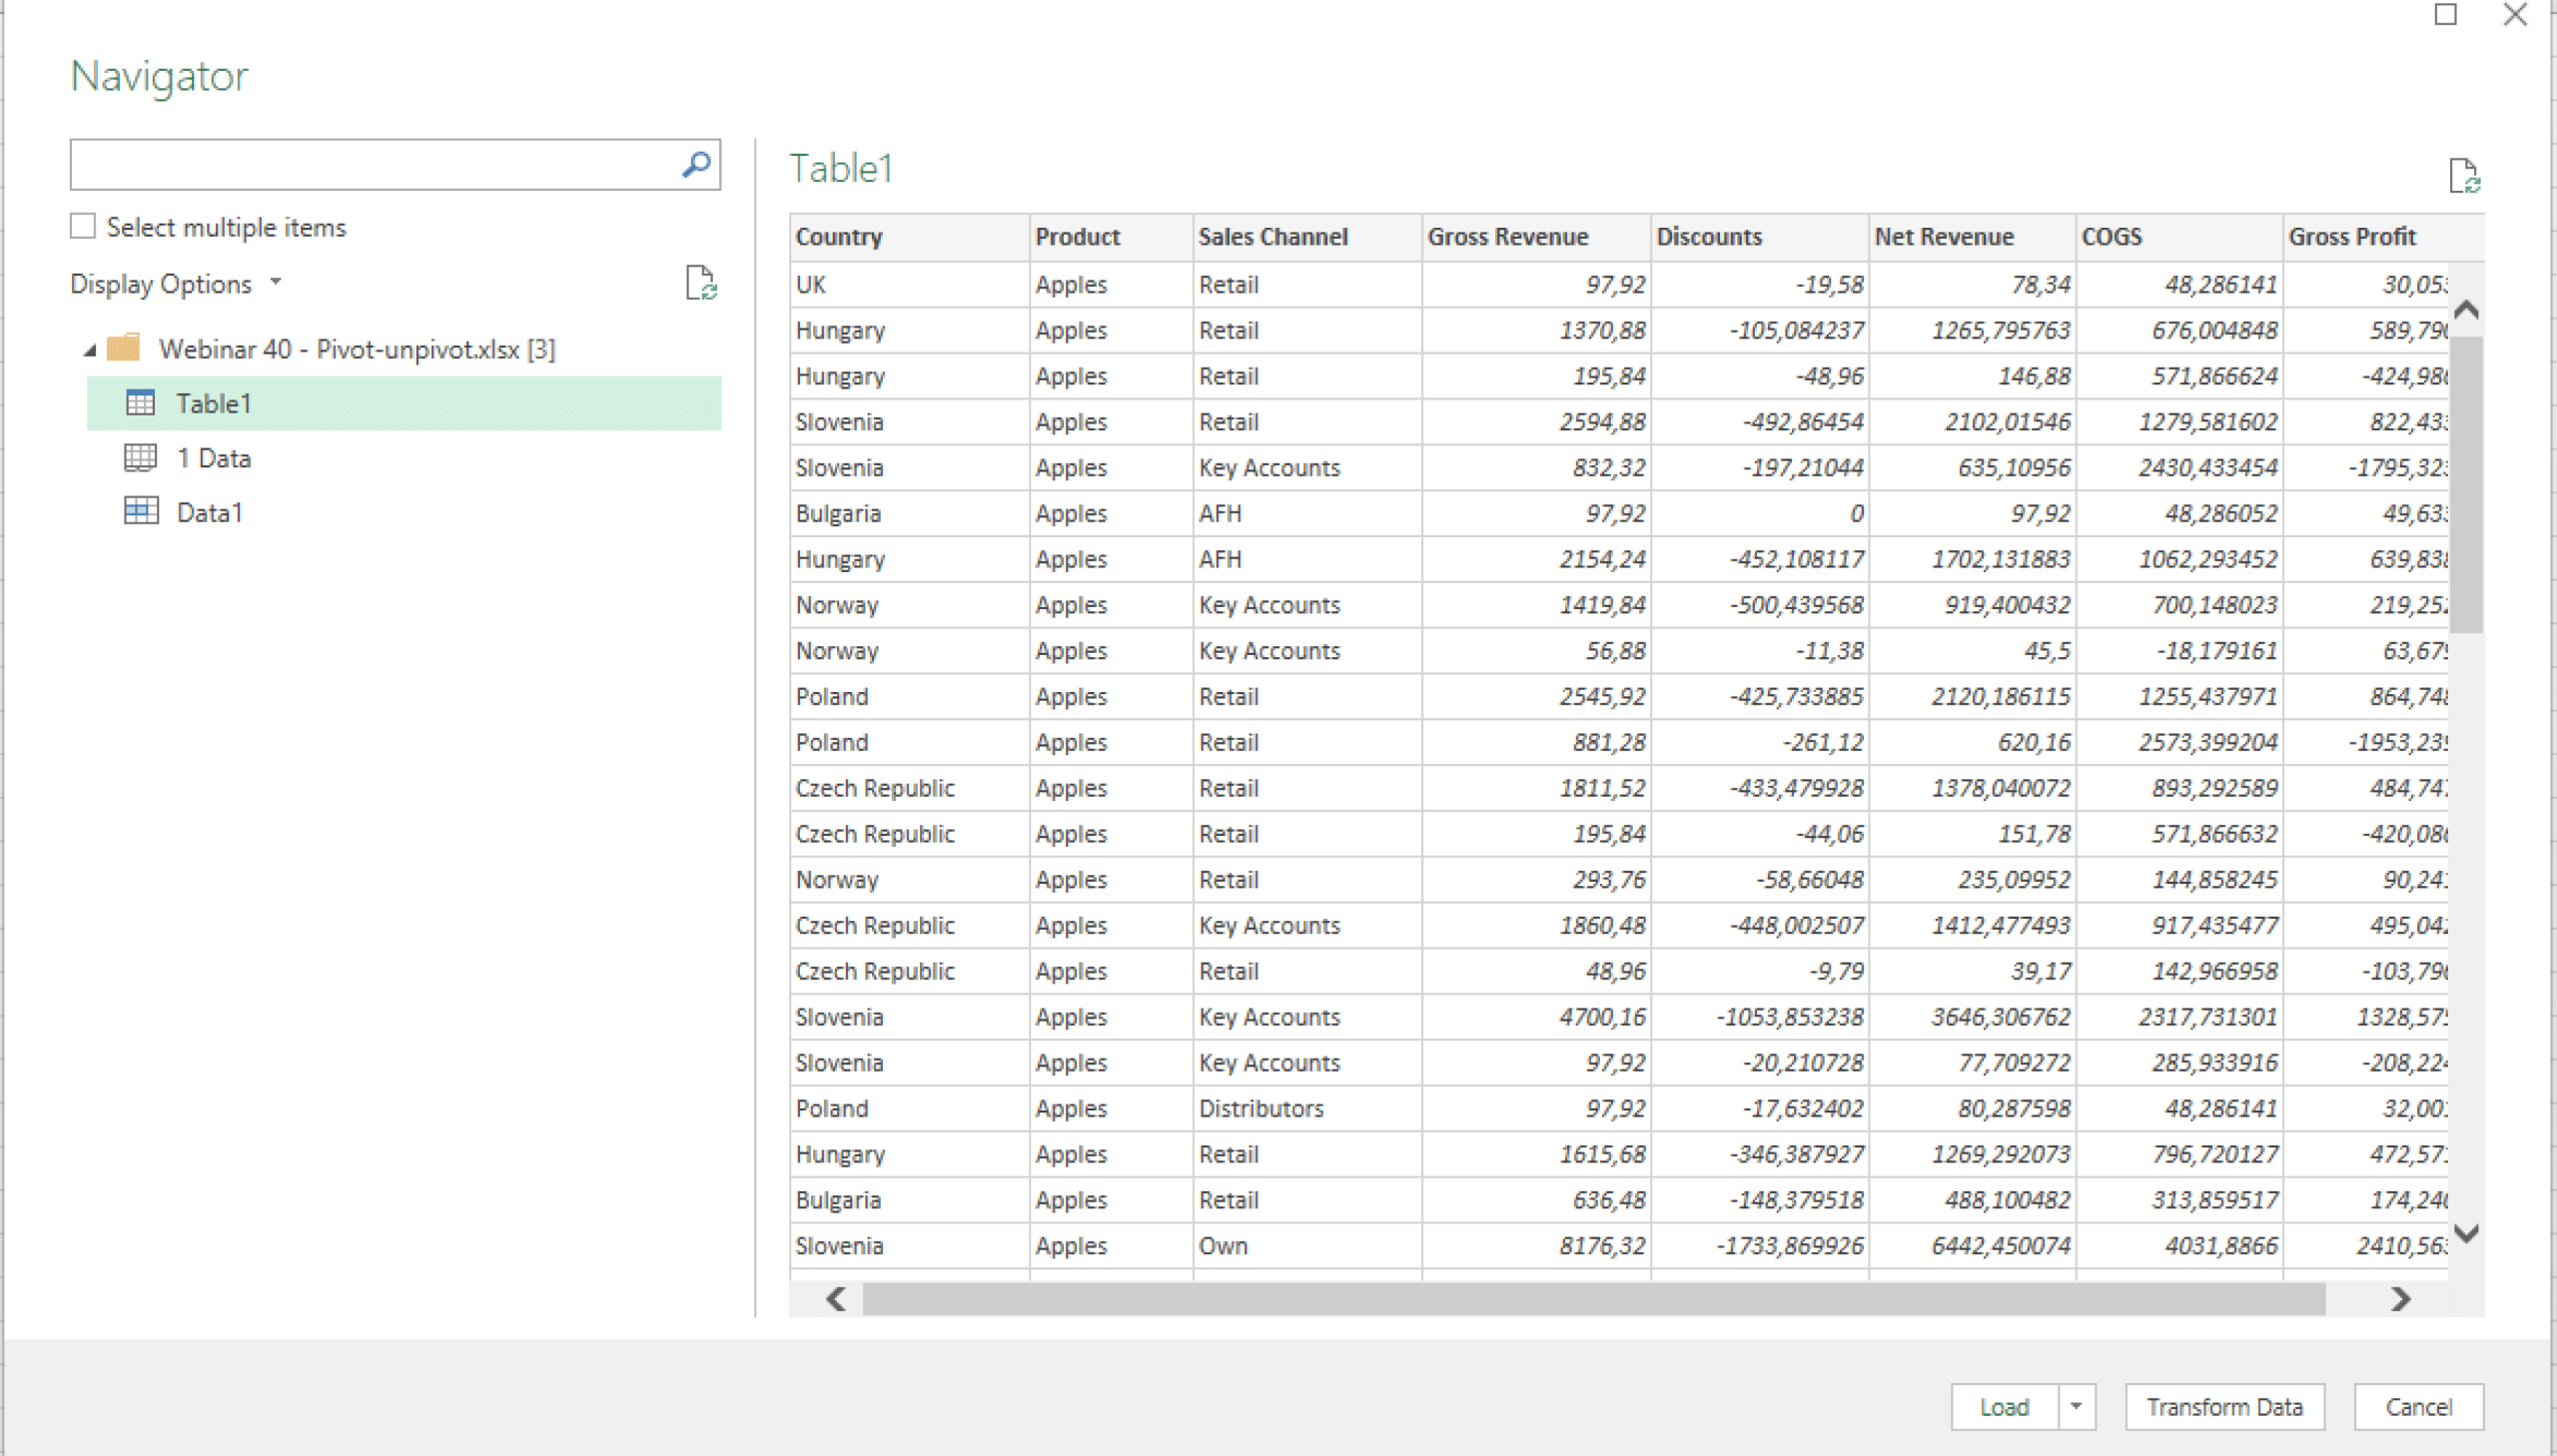
- You'll typically see a "Navigator" window displaying available tables, views, or objects.
- Browse the Navigator and select the data you'd like to import. You can preview the data by clicking on the table or object.
- You have two options to import the data:
- Click on "Load" to directly load the data into Excel (bypassing the Power Query editor) – this is useful when no further data transformation is needed.
- Click on "Transform Data" to open the data in the Power Query editor, where you can apply transformations before loading it into Excel.
It's that simple! You've successfully imported data into Power Query. It's now time for some serious data transformation. Let's get right to it.
Transforming data in Power Query
Data transformation is all about cleaning, reshaping, and reorganizing data to make it more suitable for analysis and visualization. Using Power Query to transform data in Excel opens up a world of possibilities for improving data quality and unveiling actionable insights.
Editing your data
The Power Query editor makes editing your data simple and intuitive. Here's a brief overview of how you can go about it:
- In the Power Query editor, select the data column or columns you want to transform.
- Use the options available in the "Home," "Transform," or "Add Column" tabs to apply transformations to the selected data.
Common techniques for transforming your data
There's a number of techniques for using Power Query to transform data in Excel. Some common ones include:
- Splitting and Combining Columns:
- Split a single column into multiple columns by delimiters or character count.
- Combine two or more columns into one using custom separators.
- Filtering and Sorting Data:
- Filter data by applying criteria to columns, such as text, numeric, or date filters.
- Sort data in ascending or descending order based on one or more columns.
- Removing Duplicates:
- Eliminate duplicate rows in your data to ensure accuracy and consistency.
- Pivoting and Unpivoting Data:
- Pivot data to create a summarized table with a new layout, aggregating values based on column categories.
- Unpivot data to transform a pivoted table back into a flat list format, making it easier to analyze.
These techniques will help you use Power Query to transform data in Excel and uncover some seriously valuable insights.
Data analysis with Power Query
Now that you've transformed your data, it's time to examine it. This will enable you to uncover trends, patterns, and correlations which are crucial for making informed decisions. Let's see how you can help yourself with Power Query.
Using Power Query for data analysis
Power Query offers several features that aid in data analysis – follow these steps to take advantage of it:
- Apply transformations to clean and restructure your data.
- Use the "Group By" feature to aggregate data based on specific criteria.
- Leverage conditional columns, custom functions, and calculated columns to create new data points for analysis.
- Load the transformed data into Excel. Then you can perform further analysis using PivotTables, formulas, or data visualization tools like Zebra BI for Office.
Common techniques for analyzing your data
You can use a variety of techniques to derive insights from your data. Let's take a look at a few common ones:
- Creating Calculated Columns:
Add new columns to your data set by performing calculations on existing data, using arithmetic operations or built-in functions.
- Creating Custom Functions:
Design custom functions to apply complex calculations or transformations to your data. This can be particularly helpful in cases of large data sets or repetitive tasks.
- Creating Conditional Statements:
Use conditional statements to create new columns or modify existing data based on specific conditions. For example, you could create a new column that categorizes products based on their price range.
Leveraging Power Query's data transformation and analysis capabilities can greatly help you uncover valuable insights and make data-driven decisions in Excel.
Loading transformed data into Excel
After transforming the data and preparing it for analysis, it's time to load it back into Excel. Here's how you can do that:
- In the Power Query editor, click the "Home" tab.
- Verify that all your transformations are complete and that your data is ready for analysis.
- Click the "Close & Load" button on the top left corner of the Power Query editor.
At this point, Power Query will process your transformations and load the resulting data into a new worksheet or an existing Excel table, depending on your selection.
After loading the data into Excel, you may need to refresh it periodically. This way, you know you're always working with the most up-to-date numbers. Refreshing the data in Excel is pretty straightforward:
- Just click on the "Data" tab in the Excel ribbon.
- In the "Queries & Connections" section, click the "Refresh All" button to update all the data sources linked to Power Query. Alternatively, you can right-click on a specific query in the "Queries & Connections" pane and select "Refresh" to update only that query.
Following these steps will help you make sure that your transformed data is always current and accurate. This way, you can rest assured that you're basing your decisions on the latest information available.
Alright, you're all set with your data. Now it's time to visualize it. And there's no tool better suited to delivering insightful and actionable visualizations in Excel than Zebra BI for Office.
Visualizing Data in Excel with Zebra BI for Office
Zebra BI for Office is a powerful data visualization add-in for Excel (and PowerPoint) that helps you create stunning, interactive reports and dashboards (and even business presentations!). With its user-friendly interface and extensive library of charts and tables, you can create visually appealing and actionable visualizations with just a few simple clicks.
Using it can knock hours off your workday, not to mention deliver insights that are easily understandable at a single glance. All that in just seconds of your time. Have we mentioned all the visualizations are compliant with IBCS? That's right. Here's a sneak peek at what Zebra BI reports can look like.
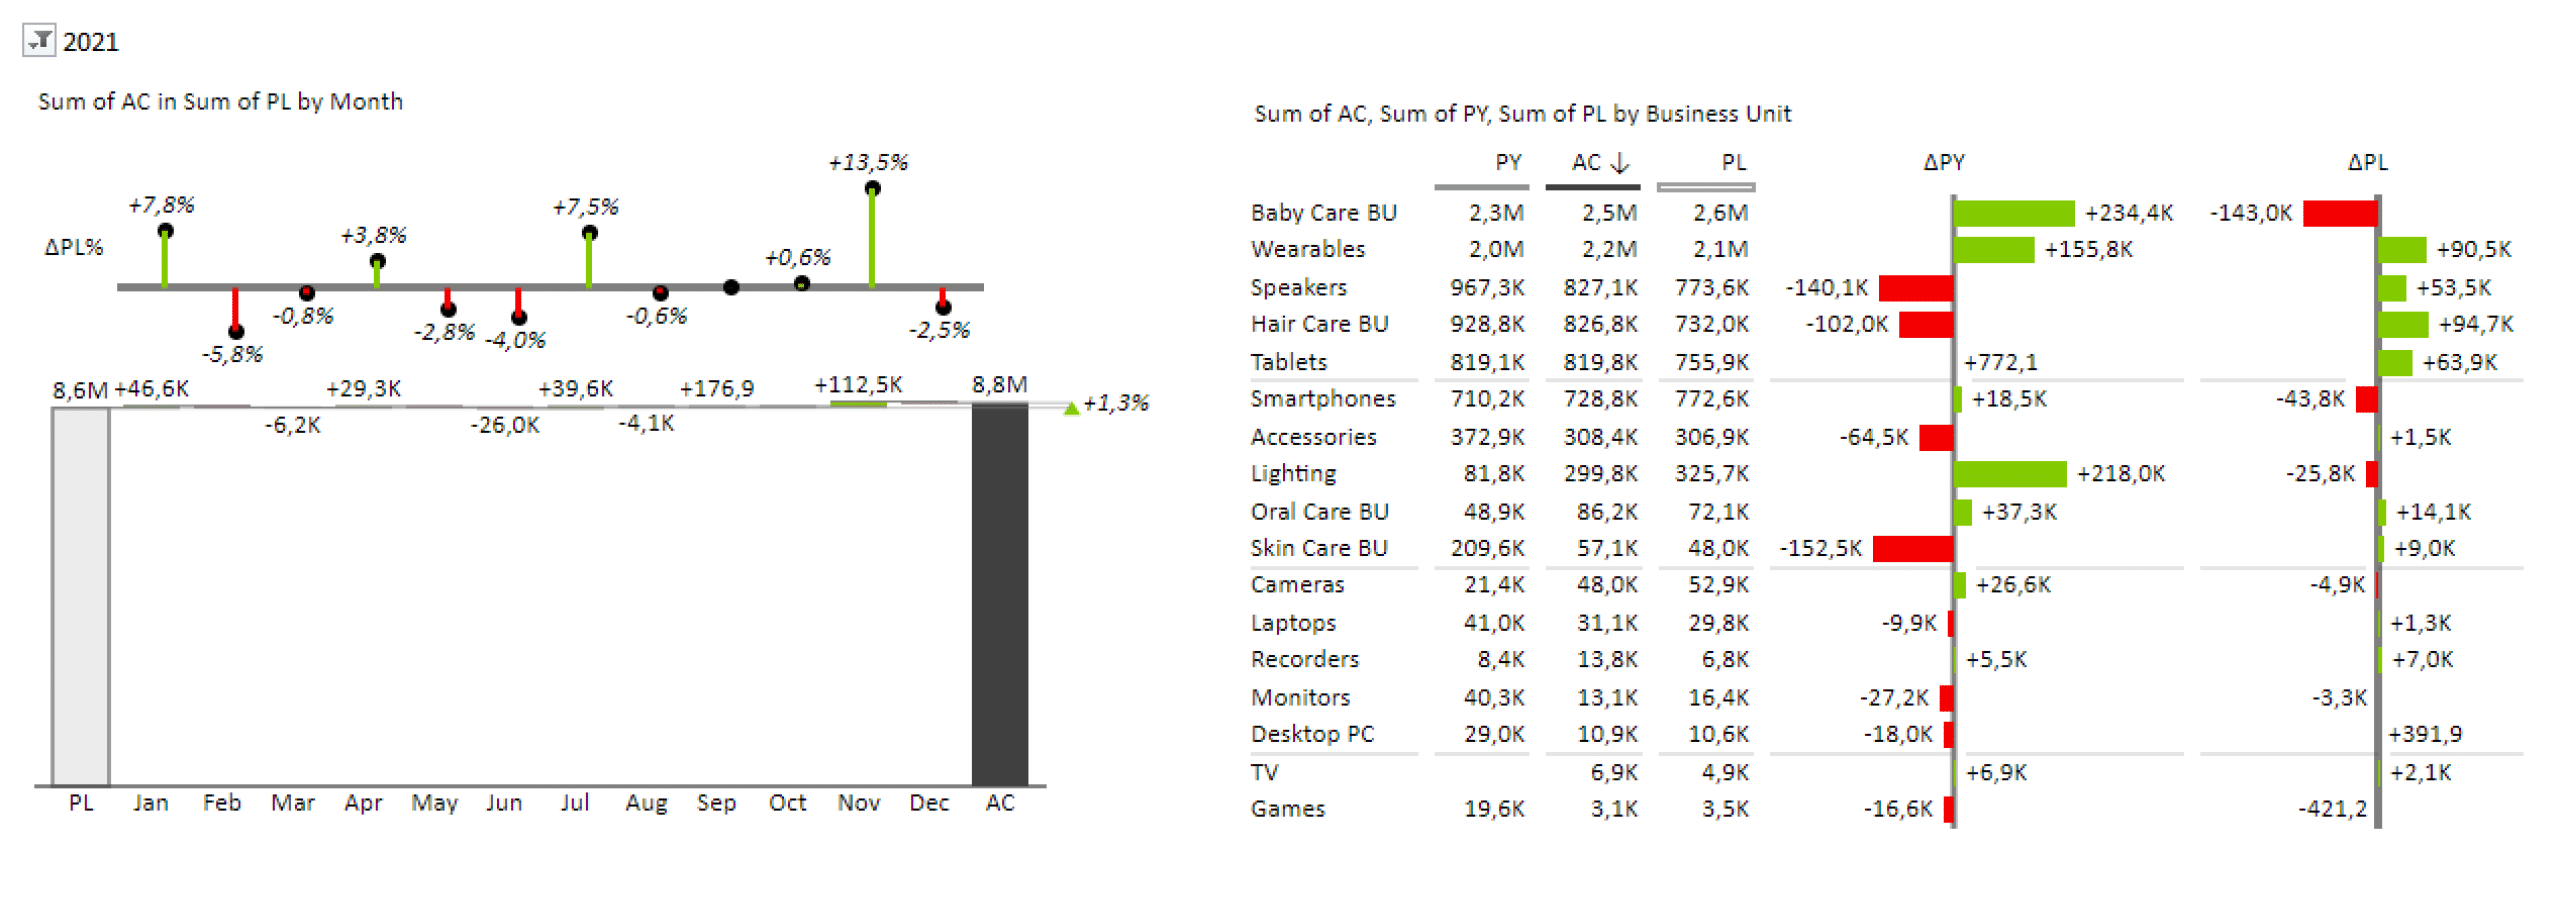
To create such visualizations, simply select the source table in Excel and insert Zebra BI Charts and Zebra BI Tables for Office add-ins – and voila, your best & most easily understandable visualizations yet. Complete with automatically calculated variances and other advanced features.

You can further customize them by adjusting colors, formatting, and data labels to create polished and professional reports and dashboards.
Zebra BI for Office works seamlessly with a variety of source tables, including those generated by Power Query and Excel PivotTables (see the gif above!). This means you can use it to easily visualize data from complex, multi-dimensional data sources, such as OLAP cubes or large data sets.
Get impressive visualizations of complex data sets fast
You now have a solid understanding of how to use Power Query to transform data in Excel, so you can use it to greatly streamline your workflow. But don't forget about the final result. Combine Power Query with Zebra BI for Office to take your reporting to a whole new level fast – and easily impress your C-levels.
Grab a free instructional file to get started
Get started with Zebra BI for Excel & automatically receive a quick step-by-step guide. In it, you'll find everything you need to add the Zebra BI add-ins to your Excel & start creating impactful, visually stunning reports and dashboards that inform and inspire.