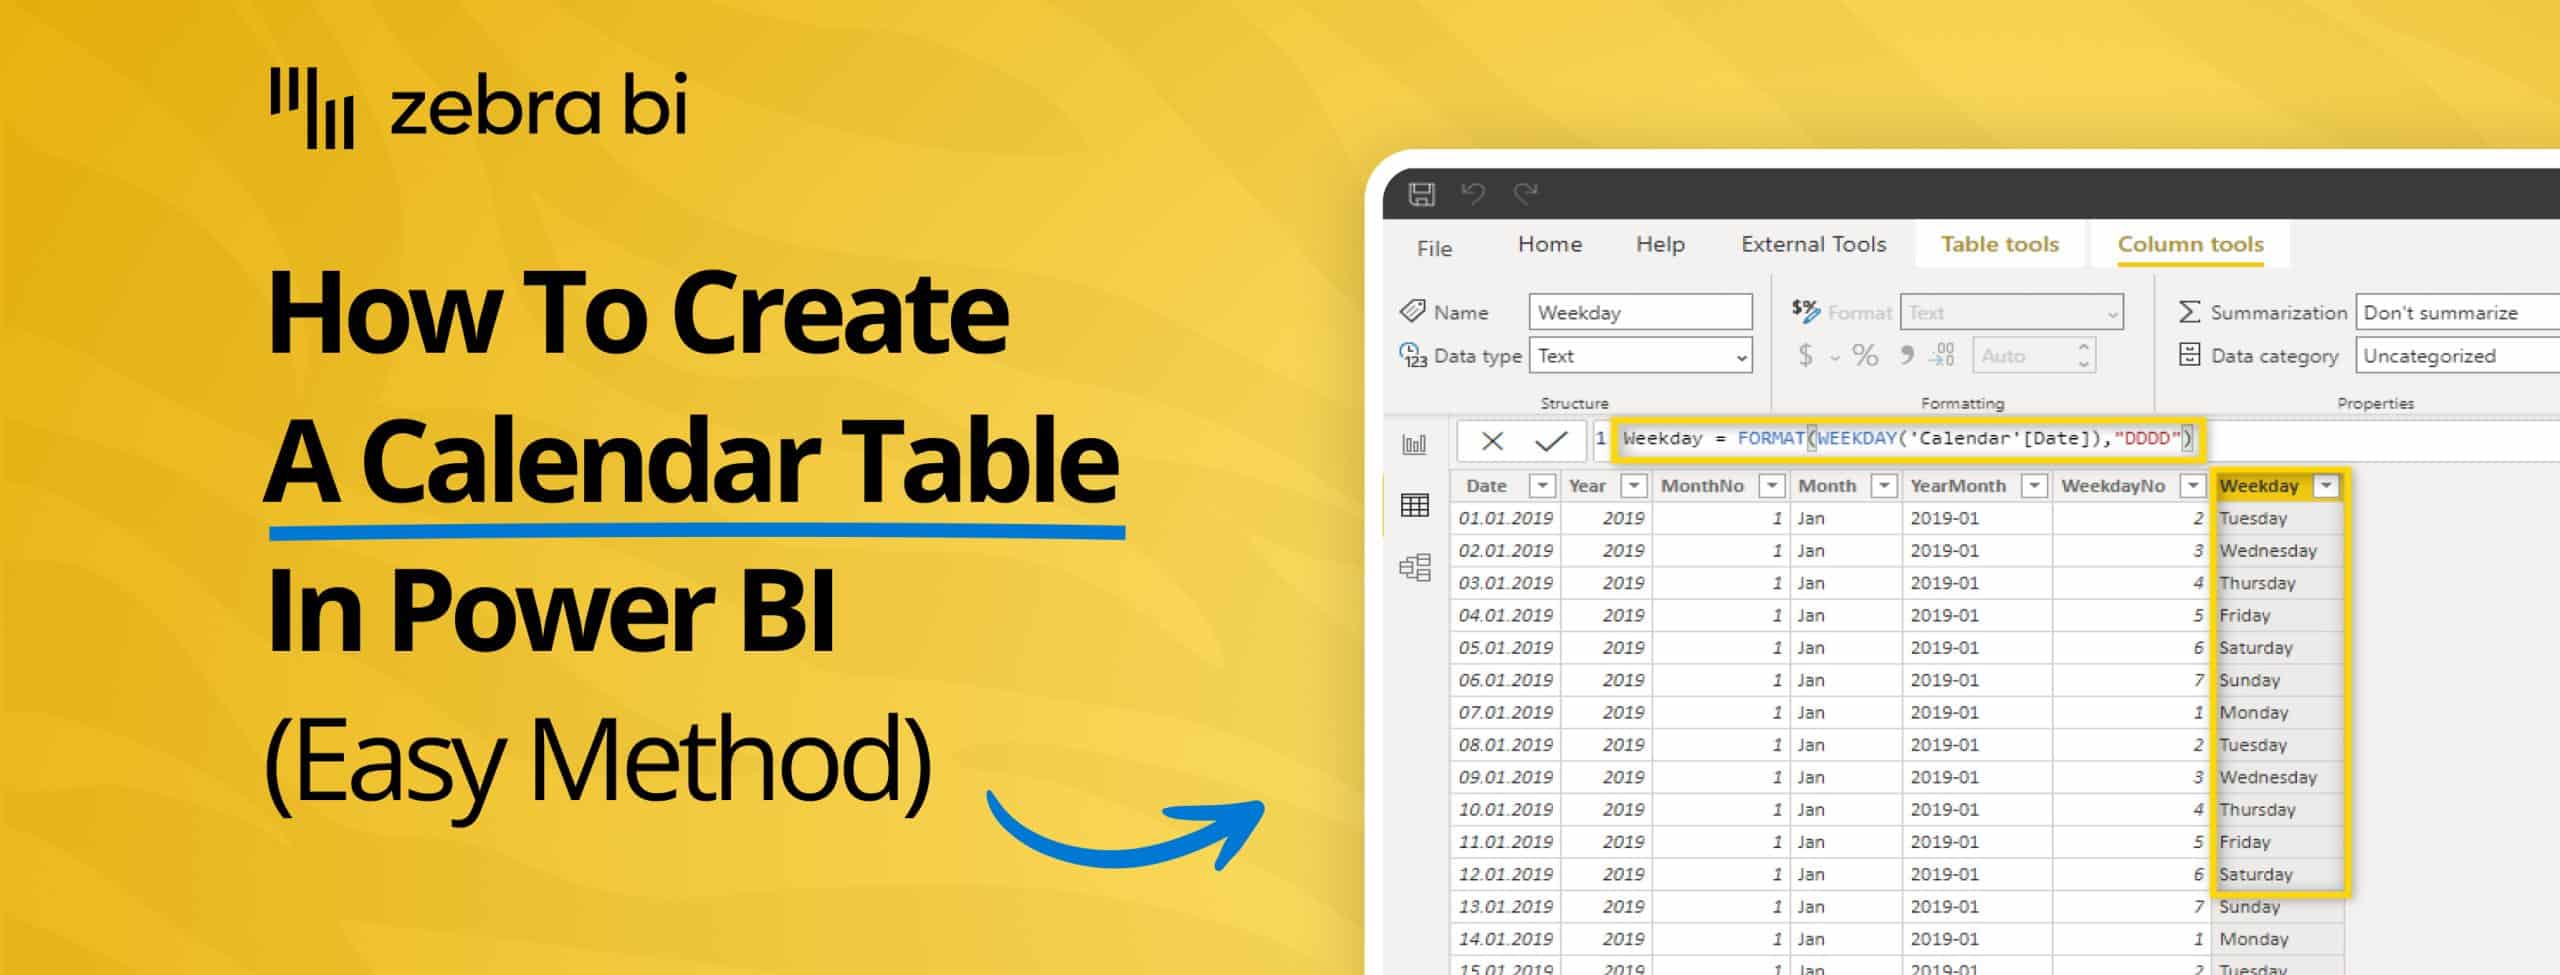
Calendar Table in Power BI: Why You Need It and How to Create One (Two Easy Methods)
PRO Trial
Time-based analysis is at the heart of financial and business reporting. Whether you're tracking sales by month, comparing year-over-year growth, or analyzing quarterly performance, your reports rely on dates to tell the story behind the numbers.
There's good news about this, and there's not-so-great-news.
We'll start with the not-so-great ones:
Power BI comes with a built-in Auto-generated Date Hierarchy that seems convenient at first glance.
Bad news? Relying on it quickly creates limitations: inconsistent results, missing fiscal calendars, and problems with advanced reporting that can undermine the accuracy of your analysis.
More even, the Auto Date/ Time feature in Power BI, while convenient for beginners, can pose real issues for more advanced Power BI models because the model refresh takes longer due to Power BI having to maintain multiple date hierarchies. As a result, query execution slows down (and even more so on visuals with time intelligence calculations, like YoY and MoM).
That's where a calendar table in Power BI comes in handy.
In this guide, you'll learn what a calendar table is, why it's essential for correct time intelligence, how to create one in Power BI, and how Zebra BI visuals take your analysis to the next level.
What is a calendar table in Power BI?
A calendar table (sometimes called a date table) is a dedicated table containing a continuous list of dates. Unlike Power BI's Auto Date Hierarchy, which is automatically generated for each date column in your data model, a calendar table is purpose-built for time intelligence.
Key characteristics of a Power BI calendar table
One of the main characteristics that sets a calendar table apart is that it contains a row for every single day within a certain range.
Your fact tables typically don't contain a row for every date—for example, there might be no data on weekends and holidays. This continuous date structure is exactly what makes a calendar table so powerful.
A properly constructed calendar table is:
- Centralized → One table serves all your models and reports
- Flexible → Supports fiscal years, holidays, and custom business periods
- Reliable → Ensures accurate calculations across all reports
- Comprehensive → Contains a continuous date range with no gaps
Simply put: calendar-based time intelligence in Power BI is the foundation of what allows DAX time-intelligence functions to work correctly and consistently.
Calendar table vs Auto Date Hierarchy
While Auto Date Hierarchy might seem convenient, it has significant limitations. It's automatically generated for each date column, creating redundancy and potential inconsistencies. A calendar table, by contrast, is a single source of truth for all time-based calculations in your model.
Microsoft and BI experts consistently recommend using a dedicated calendar table over relying on Auto Date Hierarchy for any professional reporting scenario, because it provides greater flexibility, improved performance, and more control over date calculations and formatting.
Need to know how to create a date hierarchy in Power BI? <-- We have a guide for this, check it out!
Why you need a calendar table
Without a calendar table, your Power BI reports risk being incomplete or misleading. Here's why implementing one matters for your business intelligence work:
Enables correct time intelligence
A calendar table is essential for accurate time intelligence calculations. Functions like YTD (Year-to-Date), MTD (Month-to-Date), QoQ (Quarter-over-Quarter), and YoY (Year-over-Year) require a continuous date dimension to work properly. Without it, these calculations may produce incorrect results or fail entirely.
Powers accurate variances in Zebra BI
For Zebra BI visuals to calculate absolute and relative variances correctly, they need a properly structured calendar table. This ensures that when you're comparing this year to last year, or actual performance to budget, the comparisons align perfectly across calendar time periods.
Without a calendar table, variance calculations can fail or misalign, leading to misleading insights that could impact business decisions.
Supports hierarchical drill-downs
A calendar table enables seamless navigation through time hierarchies. Users can start with annual totals and drill down through quarters, months, and individual days. This hierarchical structure makes it intuitive for report consumers to explore data at different levels of granularity.
Handles custom calendars
Every organization has unique calendar needs. Some operate on fiscal years that don't align with calendar years. Others need to account for custom business periods, regional standards, or industry-specific timeframes. A calendar table gives you the flexibility to define these structures exactly as your business requires.
👉 Want to turn your Power BI reports into lightning-fast insights machines? Learn more about Power BI performance optimization to make your reports even more efficient.
How to create a calendar table in Power BI
Creating a calendar table in Power BI can be done in two ways: using a Power Query script or using DAX in Power BI Desktop. Both methods are straightforward, but it's important to do it right to ensure your time intelligence functions work correctly.
Method 1: Create a calendar table in Power Query Editor
This method uses M code to create a flexible calendar table that you can customize to your specific needs.
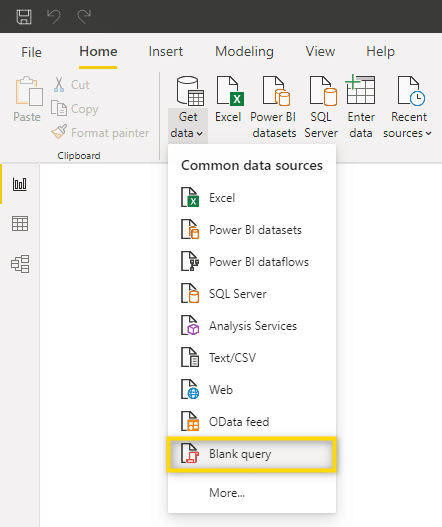
Step 1: Add a new blank data source
In Power BI Desktop, add a new blank data source to begin creating your calendar table.
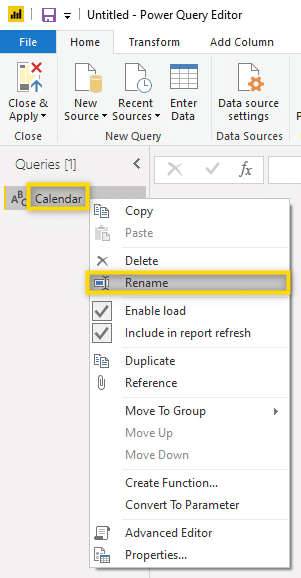
Step 2: Name your query
Right-click the query and give it a proper name (for example, "Calendar"). This makes it easy to identify in your data model.
Tip: By pressing WIN + (.) you can add the calendar emoji 📅 to the description to make it stand out even more in your model.
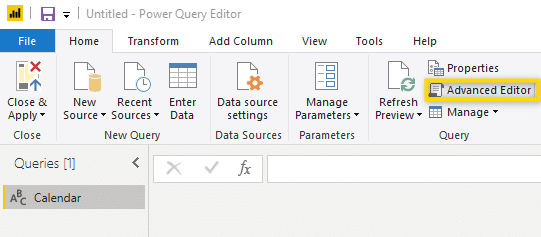
Step 3: Open the Advanced Editor
Access the Advanced Editor to enter the M code that will generate your date range.
Step 4: Paste the M code
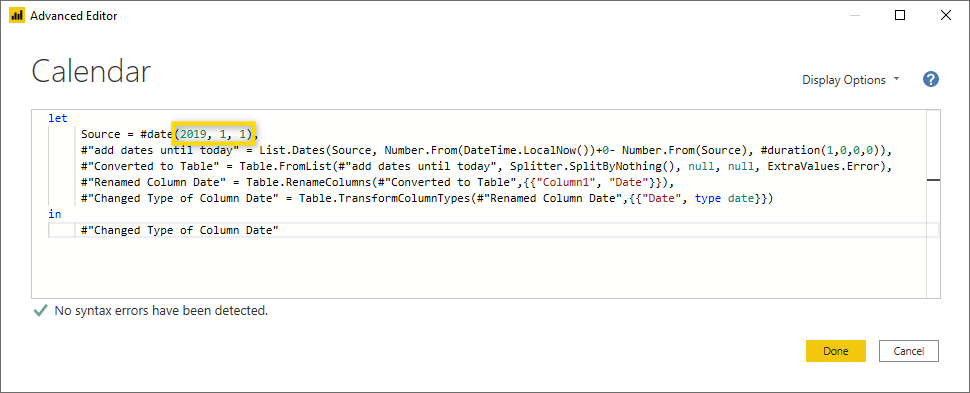
Copy and paste the following M code and confirm with "Done":
let
Source = #date(2019, 1, 1),
#"add dates until today" = List.Dates(Source, Number.From(DateTime.LocalNow())+0- Number.From(Source), #duration(1,0,0,0)),
#"Converted to Table" = Table.FromList(#"add dates until today", Splitter.SplitByNothing(), null, null, ExtraValues.Error),
#"Renamed Column Date" = Table.RenameColumns(#"Converted to Table",{{"Column1", "Date"}}),
#"Changed Type of Column Date" = Table.TransformColumnTypes(#"Renamed Column Date",{{"Date", type date}})
in
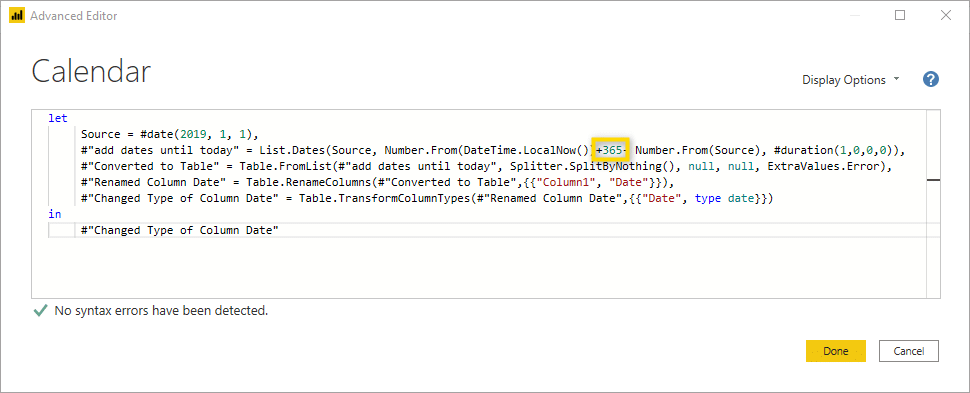
#"Changed Type of Column Date"Step 5: Customize the date range
You now have a date table showing all dates between January 1, 2019, and the current date. To customize:
- To change the start date: Go back to the Advanced Editor and replace the date #date(2019, 1, 1) with your desired start date
- To extend into the future: Change the +0 to +365 (or any number of days) to extend the calendar table beyond the current date
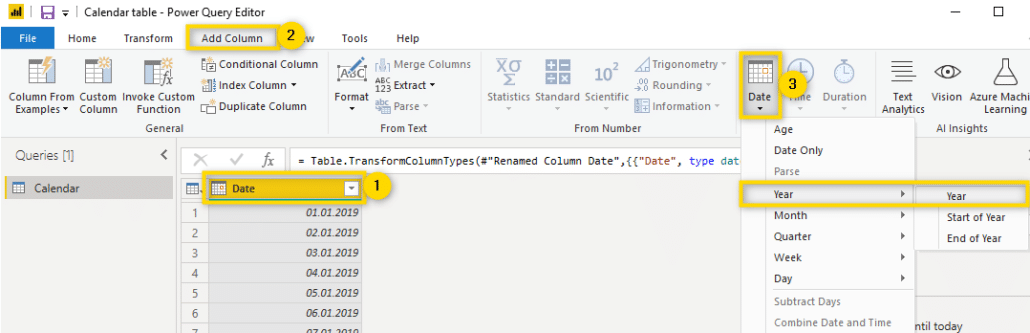
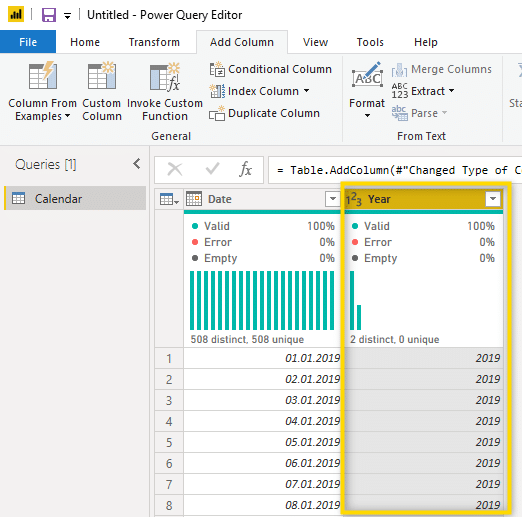
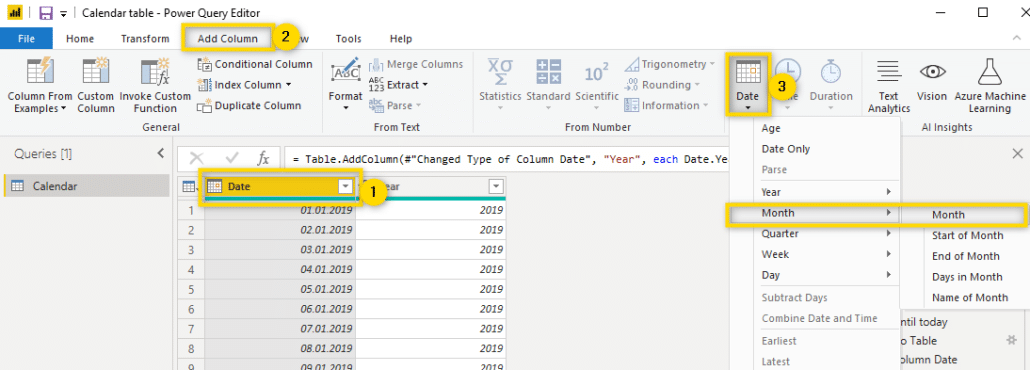
Step 6: Add year column
Select the date column, then go to the Add column menu and select the Date function. From there, choose Year to add a year column to your table.
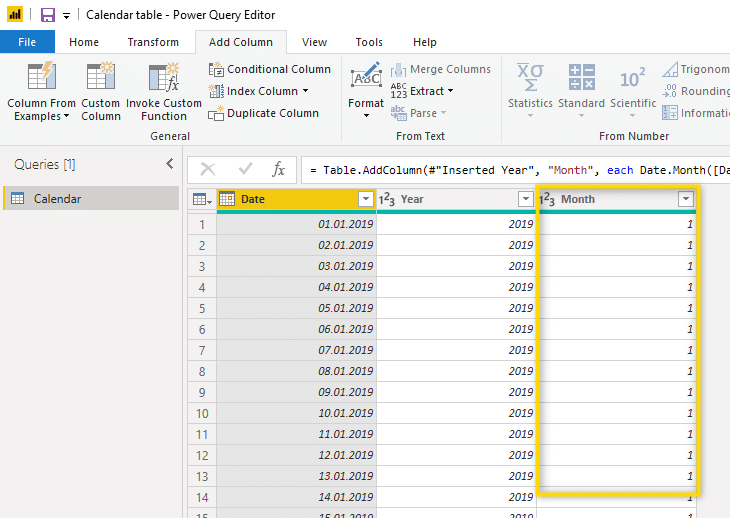
Step 7: Add month number column
With the date column still selected, use the Add column > Date function again and select Month to add a numeric month column.
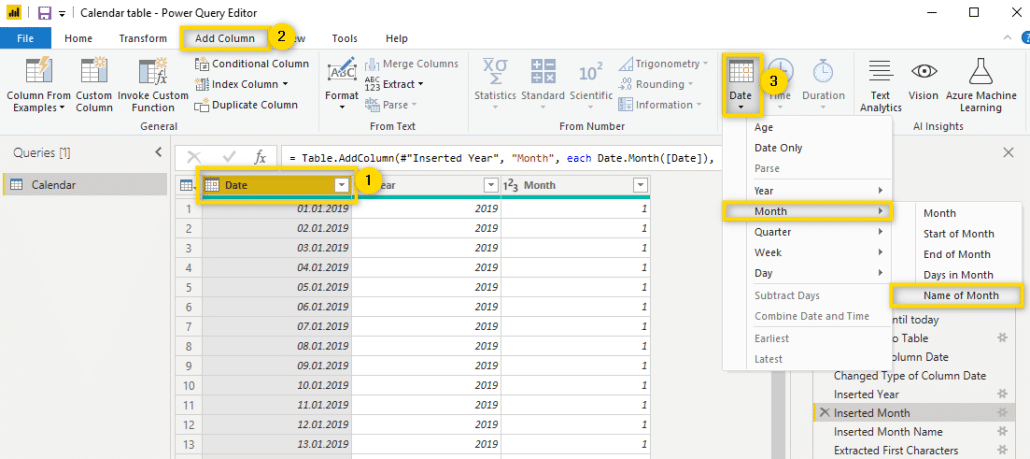
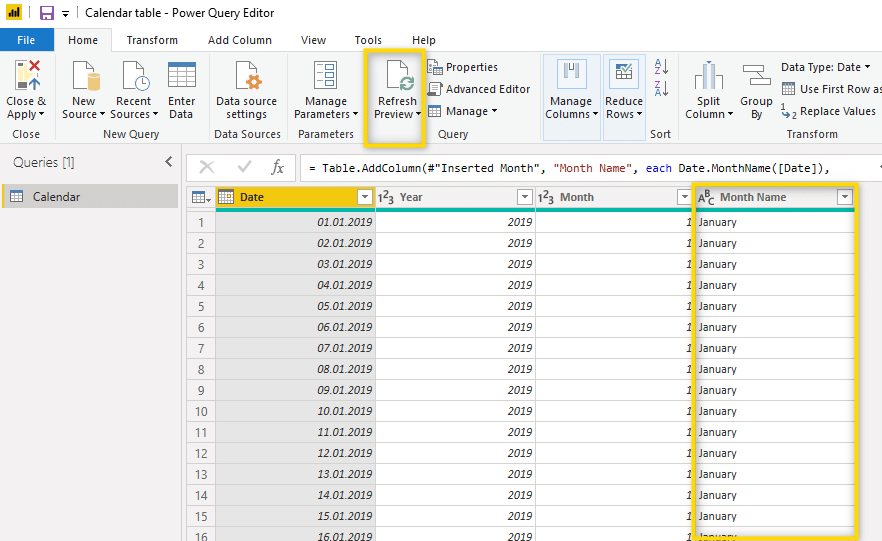
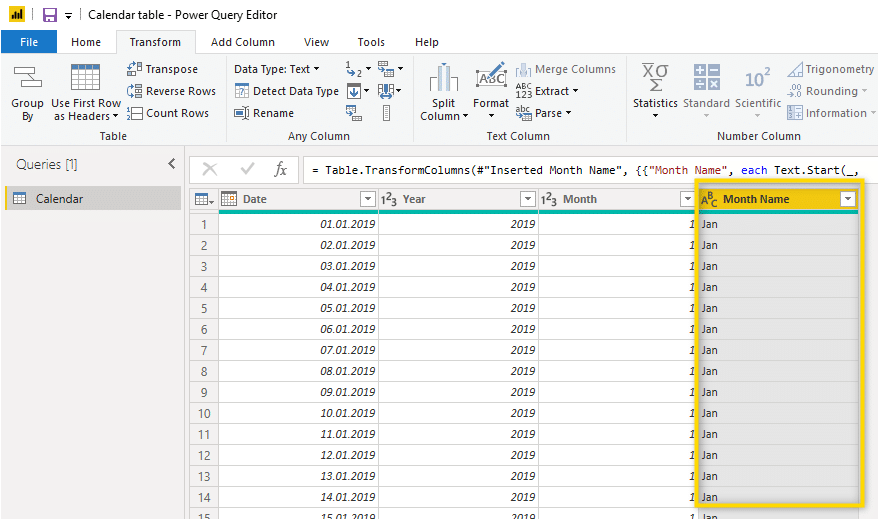
Step 8: Add month name column
To add the full month name, use the Add column > Date function and select Month Name. This will display the complete name of each month.
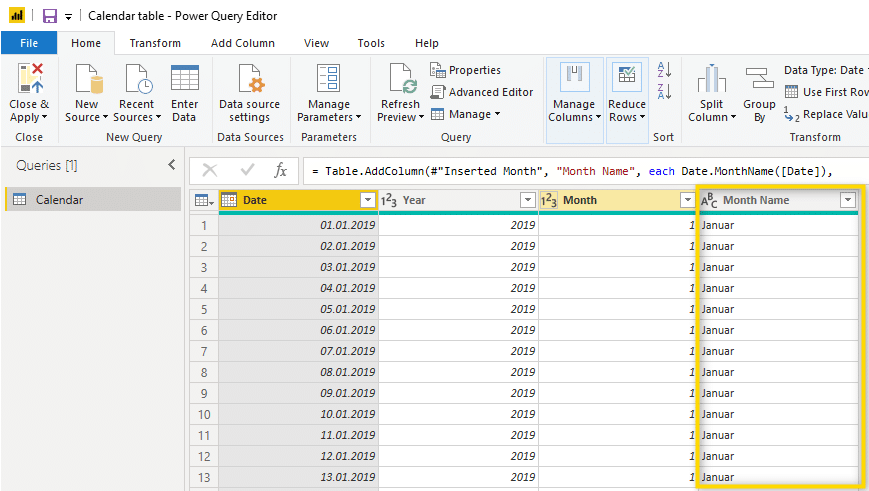
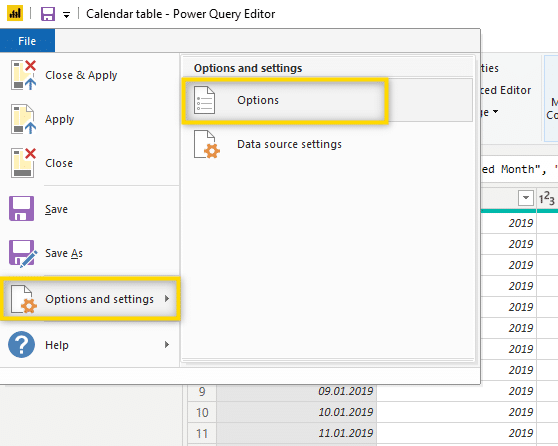
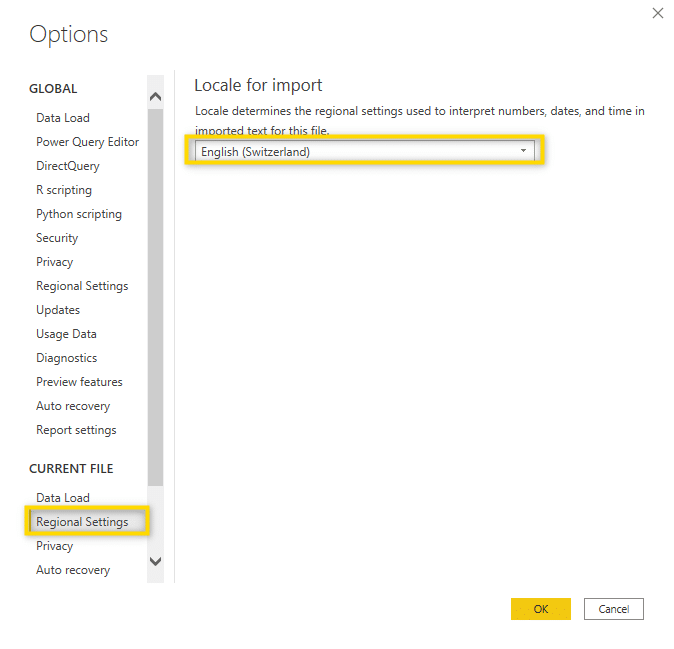
Step 9: Adjust regional settings (optional)
The language of text elements depends on your regional settings. If needed, change the locale settings to English (or your preferred language) through the Power Query options, then click Refresh Preview to apply the changes.
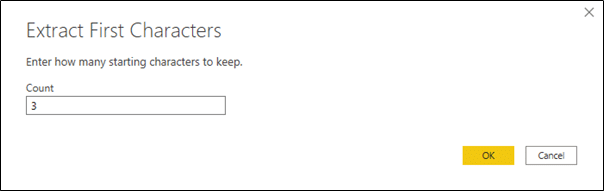
Step 10: Format month name
Most of the time, the full month name is too long for visualizations. To show only the first three letters:
- Select the Month Name column
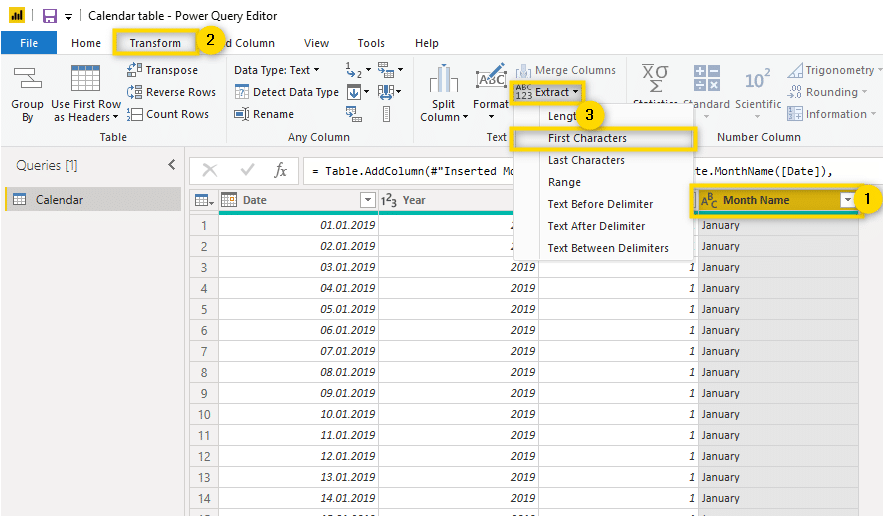
- Go to the Transform menu (not Add column, since we're modifying an existing column)
- Select Format > First Characters
- Limit it to 3 characters
Performance tip: There are many more columns you could add to this table, but it's best to have narrow tables for performance reasons. Start with only a small number of columns and add additional ones only if they're really needed.
Once you're done with the calendar table and would like to reuse it for your next report, go back to the Advanced Editor, copy the M code, and save it in a text file for later use.
Method 2: Create a calendar table using DAX
This method uses the CALENDARAUTO function, which automatically determines the date range based on your data model.
Understanding CALENDARAUTO
The CALENDARAUTO function creates a calendar table with a range calculated as follows:
- The earliest date in your model (excluding calculated columns and tables) is taken as the MinDate
- The latest date in your model (excluding calculated columns and tables) is taken as the MaxDate
- The date range spans from the beginning of the fiscal year associated with MinDate to the end of the fiscal year associated with MaxDate
Example:
- If dates in your model are between July 1, 2018, and June 30, 2019
- CALENDARAUTO() returns all dates between January 1, 2018, and December 31, 2019
- CALENDARAUTO(3) returns all dates between March 1, 2018, and February 29, 2020
Step 1: Create a new table
In the Data view, click New table in the ribbon.
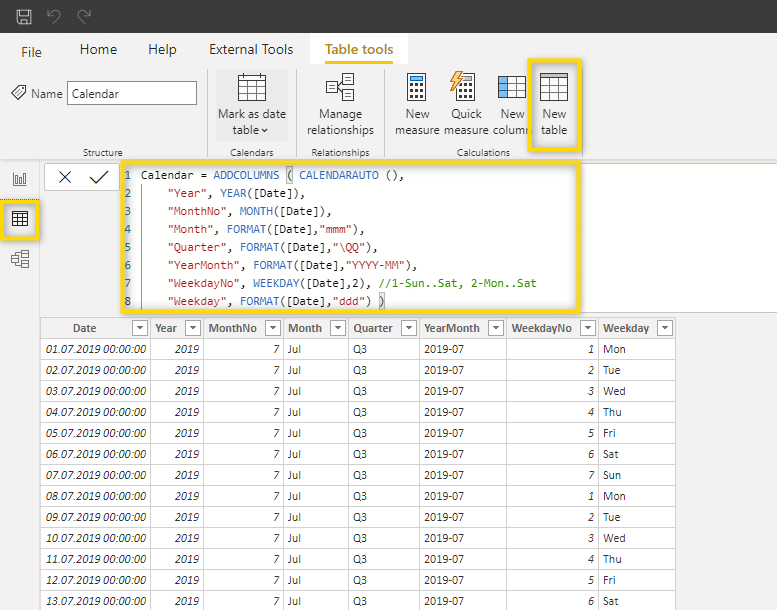
Step 2: Enter the DAX formula
Copy and paste the following DAX formula and confirm with Enter:
Calendar =

ADDCOLUMNS (

   CALENDARAUTO (),

   "Year", YEAR([Date]),

   "MonthNo", MONTH([Date]),

   "Month", FORMAT([Date],"mmm"),

   "Quarter", FORMAT([Date],"QQ"),

   "YearMonth", FORMAT([Date],"YYYY-MM"),

   "WeekdayNo", WEEKDAY([Date],2),

   "Weekday", FORMAT([Date],"ddd")

)
This formula creates a calendar table with the most commonly used columns.
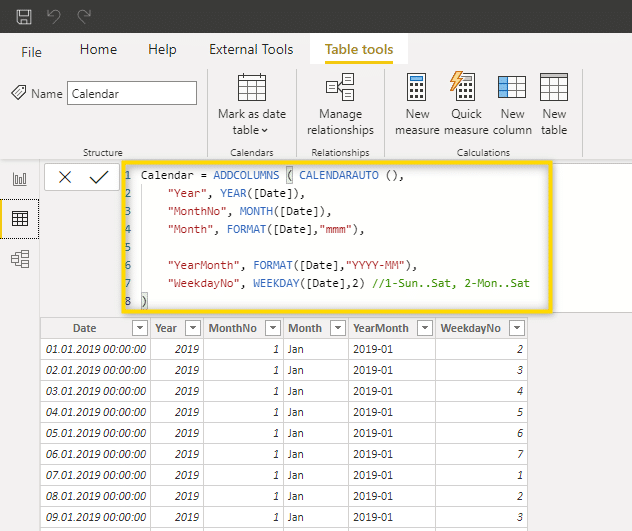
Step 3: Remove unnecessary columns
To keep your data model small and efficient, remove columns you don't need by deleting the respective lines from the DAX formula. For example, if you don't need Quarter and Weekday columns, remove those lines.
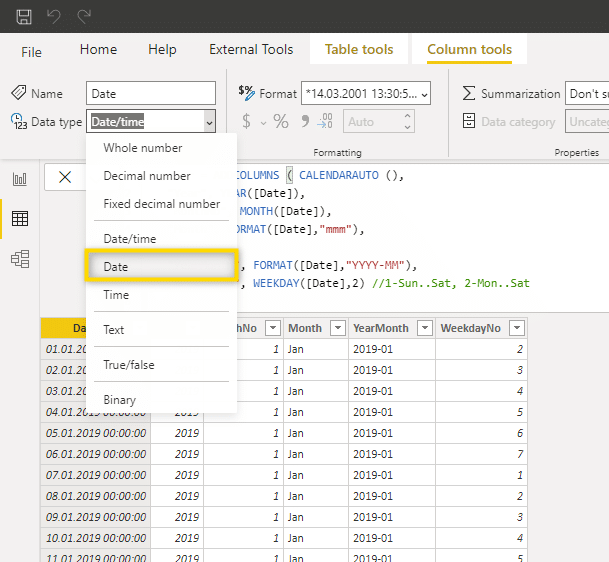
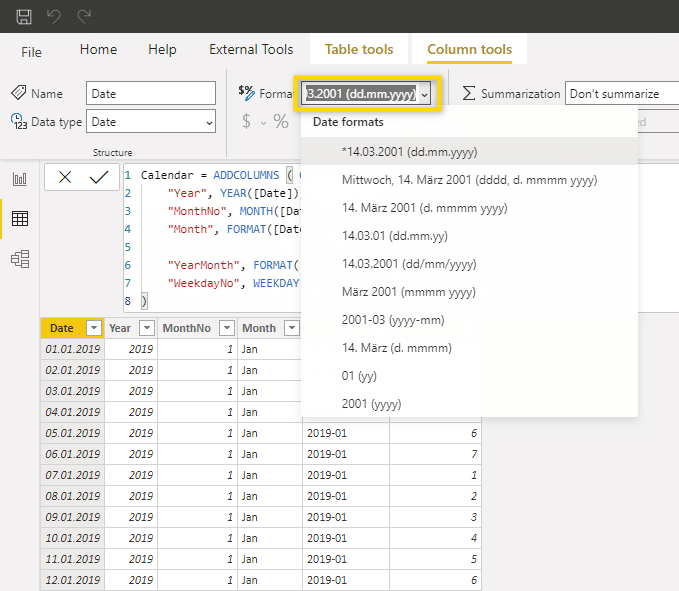
Step 4: Format the date column
Since the Date column shows both date and time by default, change the format to Date only and select your preferred date format from the formatting options.
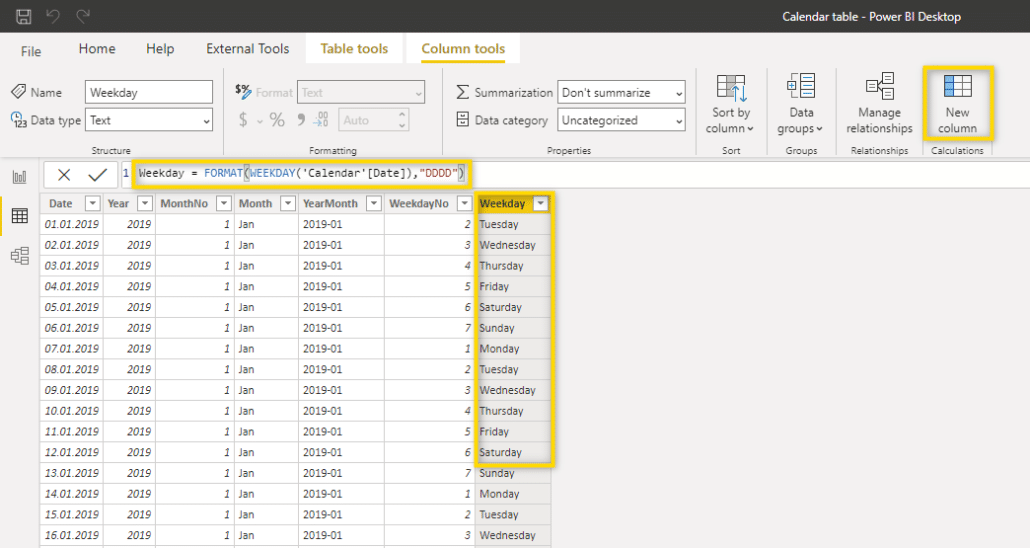
Step 5: Add additional columns (optional)
If you need additional columns, you can either:
- Copy and paste an existing line in the formula and modify it
- Use the New column option to add calculated columns using DAX
Step 6: Mark as date table
Once your calendar table is created, go to Modeling > Mark as Date Table and select your Date column. This tells Power BI to treat this table as the official date dimension for your model.
Advanced scenarios with Zebra BI
Once your calendar table is in place, Zebra BI visuals unlock powerful analytical capabilities that go far beyond basic reporting.
Automatic variance calculations
Zebra BI visuals automatically calculate absolute and relative variances when you have a proper calendar table. Compare this year to last year, actual to budget, or any custom comparison—the visuals handle the calculations seamlessly and display them in intuitive formats.
These variance calculations are the backbone of financial reporting, helping you quickly identify where performance is exceeding or falling short of expectations.
Hierarchical drill-downs
With your calendar table properly configured, users can explore data hierarchically. Start with annual totals, drill down to quarters, then months, and even daily details if needed. This intuitive navigation helps users discover insights at the level of detail that matters most to them.
The hierarchical structure makes it natural to answer questions like "Which quarter drove the annual variance?" or "What happened in March that caused the spike?"
Dynamic time comparisons
Zebra BI visuals leverage your calendar table to enable dynamic time frame switching. Users can instantly toggle between different comparison periods—current month vs. same month last year, quarter-to-date performance, or rolling 12-month trends—without needing to rebuild visualizations.
This flexibility empowers business users to analyze data from multiple perspectives without waiting for report developers to create new views.
Best practices for calendar tables
Following these best practices ensures smooth reporting and optimal performance for your Power BI models.
Use continuous dates with no gaps
Your calendar table must contain every single day within your date range—no exceptions. Missing dates will cause time intelligence functions to produce incorrect results or fail entirely.
Define fiscal year settings correctly
Align your calendar table to your organization's fiscal year. If your fiscal year starts in July, configure your table accordingly. This ensures that fiscal year calculations like "Fiscal YTD" work correctly.
Add custom columns thoughtfully
While you can add many columns to your calendar table (holidays, week numbers, business days, custom periods), only include what you actually need. Extra columns increase model size and can slow performance.
Common useful additions include:
- Fiscal year and fiscal quarter
- Week numbers
- Holiday flags
- Business day indicators
- Custom period groupings
Looking for the right Power BI dashboard? Check out our guide on Power BI dashboard examples to get some inspiration.
...Or just go to our Power BI templates section, grab one, and customize it for your needs. We have heaps of them, for any need you may have!
Keep it simple with one master calendar table
Use a single calendar table that connects to all your fact tables. Creating multiple calendar tables creates confusion, makes maintenance harder, and can lead to inconsistent results across reports.
Establish clear relationships between your calendar table and fact tables through the date column to ensure time intelligence functions work correctly.
Common mistakes to avoid
Even experienced Microsoft Power BI developers sometimes make these calendar table mistakes. Avoid them to ensure reliable reporting.
Relying only on Auto Date Hierarchy
The most common mistake is bypassing a calendar table entirely and relying on Power BI's Auto Date Hierarchy. While it seems convenient, Auto Date Hierarchy creates hidden tables for each date column, bloats your model, and can't handle fiscal years or custom calendars.
Always disable Auto Date Hierarchy in Power BI options and create a proper calendar table instead.
Missing fiscal year alignment
If your organization operates on a fiscal year that doesn't match the calendar year, failing to configure this correctly leads to incorrect year-over-year and year-to-date calculations. Define your fiscal year explicitly in your calendar table structure.
Need a quicker, cleaner, and more efficient way to build your Power BI income statements? We got you! Check out our guide on income statements in Power BI(explained A to Z, so you can make the most out of them!)
Not connecting the calendar table properly
Your calendar table must have active relationships to your fact tables through the date column. Without proper relationships, time intelligence functions won't work, and Zebra BI visuals won't be able to calculate variances correctly.
Creating multiple calendar tables unnecessarily
Some developers create separate calendar tables for different fact tables. In most cases, this is unnecessary and creates maintenance headaches. One well-designed calendar table can serve your entire model.
Need a more technical overview of how to build a calendar in Power BI? Check out our Calendar Table in Power BI Help Article.
Try a custom calendar table with Zebra BI
A proper calendar table is the foundation of time intelligence in Microsoft Power BI. Combined with Zebra BI visuals, it transforms your dashboards into powerful, decision-ready reports that provide instant insights into variances, trends, and performance.
Whether you're building financial statements, sales dashboards, or operational reports, the combination of a well-structured calendar table and Zebra BI's intelligent visuals helps you deliver analysis that drives business decisions.
Ready to experience the difference?