How to Create a Date Hierarchy in Power BI: Complete Guide
PRO Trial
Are you struggling to organize and analyze time-based data in Power BI? The Power BI date hierarchy feature is one of the most valuable tools for working with dates, allowing you to easily drill down and analyze data at different time intervals, from years to minutes.
This guide covers everything you need: what date hierarchies are, where to create them in your data model, how to build custom hierarchies, and when to remove unwanted automatic hierarchies. You'll learn to handle standard calendar years, fiscal periods, and week-based reporting for maximum analytical power.
What is a date hierarchy in Power BI?
A date hierarchy is a structured, multi-level organization of date data that enables drill-down navigation through time periods: Year → Quarter → Month → Day. Power BI supports multiple levels of time periods, including year, quarter, month, week, and day.
One of the benefits of using date hierarchies is the ability to drill down into specific time periods—start with the entire year, then drill to quarters, months, and days. This allows you to identify trends and compare data across time periods, like comparing current quarter sales to the previous year's quarter.
Automatic vs. custom hierarchies
Power BI offers two types:
- Automatic hierarchies: Generated automatically for any date column.
- Custom hierarchies: User-created in the data model with complete control over levels, naming, and structure. Essential for fiscal years, week-based analysis, or non-standard calendars.
Examples of custom hierarchies include:
- Fiscal Year: FY2024 → FQ1 → Period 1 → Date
- Week-Based: Year → Week Number → Day
- Retail Calendar: Retail Year → Retail Quarter → Period → Week → Day
Choose automatic hierarchies for quick exploratory analysis with standard calendar years. Choose custom hierarchies for production reports, fiscal years, week analysis, or when you need full control over structure and performance.
Why date hierarchies matter for your reports
Date hierarchies provide several critical benefits: intuitive one-click drill-down navigation, reduced clutter in slicers, multi-level time analysis without multiple filters, and improved report performance through efficient filtering.
A date hierarchy allows you to apply time-based calculations to your data. For example, you can calculate year-to-date or month-to-date revenue using the date hierarchy and DAX formulas. Using a date hierarchy can also improve the performance of your Power BI report by organizing data into time levels, reducing rows and columns for faster performance.
Additionally, date hierarchies help identify outliers or anomalies. By drilling down into specific time intervals, you may notice unusual spikes or dips requiring further investigation.
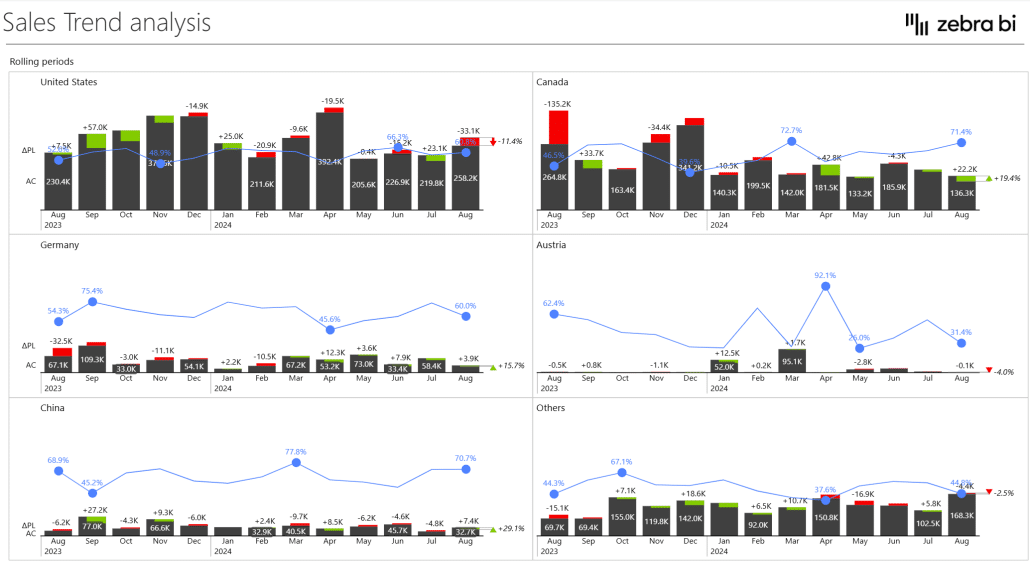
Common use cases include sales trend analysis, financial period reporting, project timelines, and seasonal pattern identification.
Without hierarchies, reports become cluttered with multiple date filters, users struggle to navigate time-based data, and time comparisons become inconsistent.
Where do you create hierarchies in the data model?
Understanding location is critical: where you create a hierarchy determines its availability and reusability.
Data model (Fields pane) - the right location
It is advised to create permanent hierarchies in Model view or Data view that appear in the Fields pane for your entire report:
- Switch to Model view in Power BI Desktop
- In the Fields pane, locate your date table
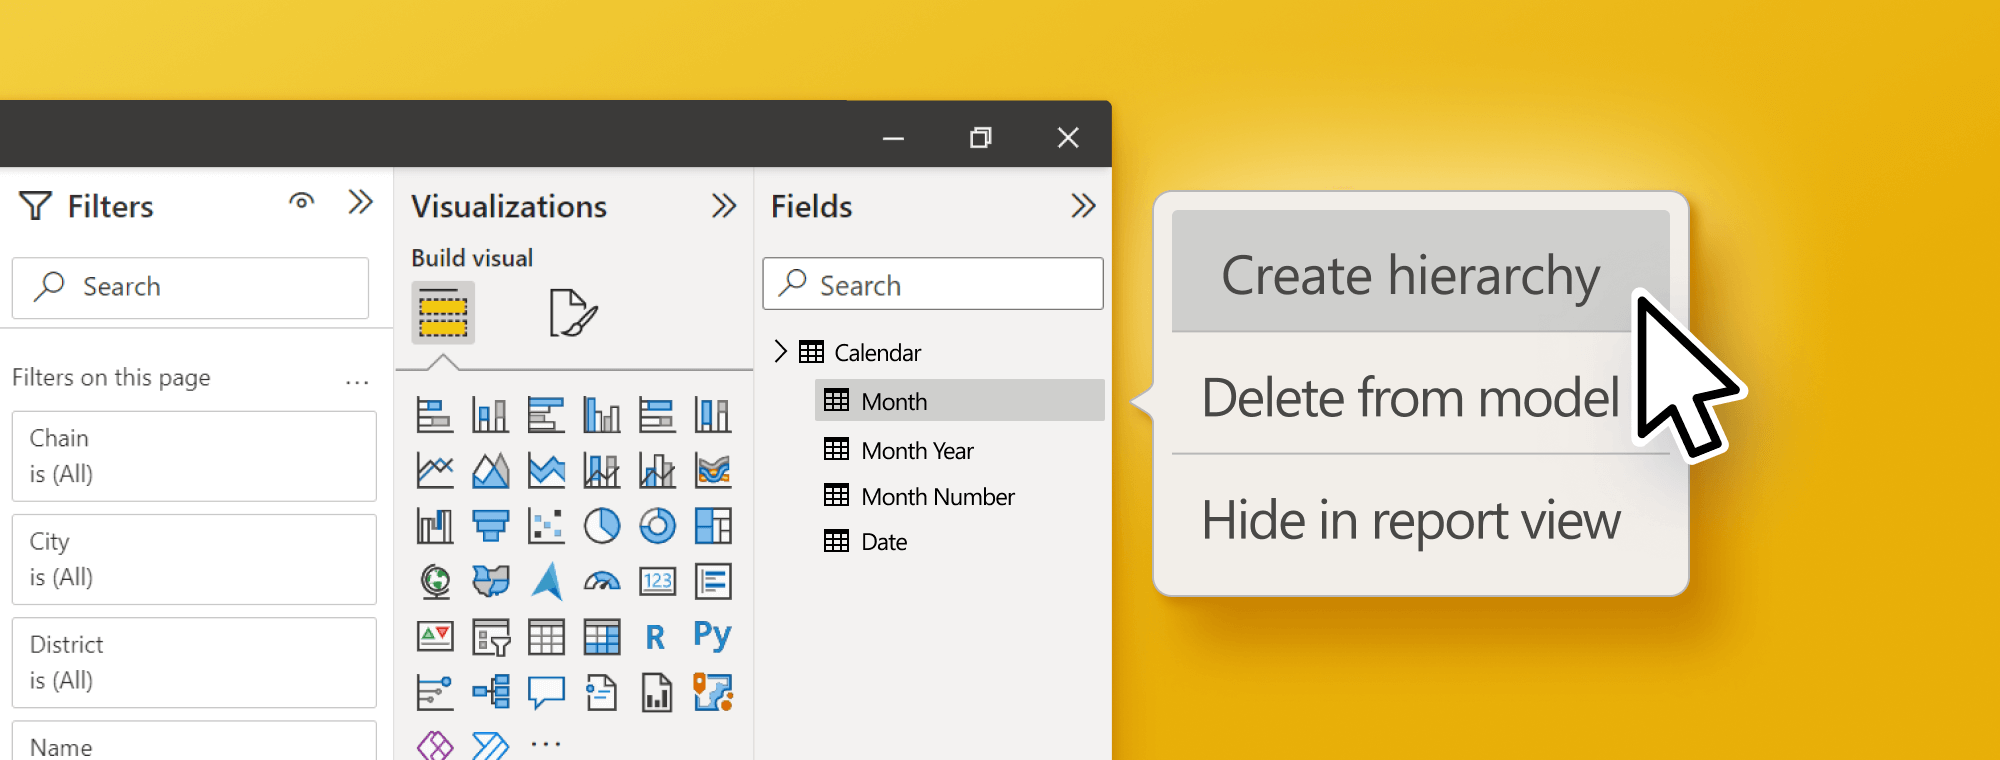
- Right-click your top-level column (e.g., Year)
- Select "New hierarchy"
- Drag additional columns (Quarter, Month, Day) onto the hierarchy
These hierarchies are available to all visuals and persist across your report—the best practice for shared hierarchies.
- Visual-level hierarchies are temporary drill-down paths specific to individual visuals. They're created by adding multiple columns to a visual's axis. While functional, they're not reusable and don't appear in the Fields pane.
Generally, you want to use data model hierarchies for production reports. They're permanent, reusable, and provide centralized control. Reserve visual-level hierarchies only for quick, ad-hoc analysis.
- Auto-generated hierarchies are created automatically by Power BI in hidden tables when it detects date columns. They're convenient but can't be customized and may cause performance issues.
Step-by-step guide: How to create a custom date hierarchy
Before you proceed with creating a custom date hierarchy, make sure you have clean, consistent date data. A proper calendar table is recommended for professional implementations.
[Here's a guide on how to build a robust calendar table first →]
Once that's all covered, go on and:
- Open Power BI Desktop and switch to Model view or Data view
- In the Fields pane, locate your date table and expand it
- Right-click your top-level column (typically Year)
- Select "New hierarchy"
- Drag Quarter, Month, and Day columns onto the new hierarchy
- Drag levels up or down to reorder if needed (Year → Quarter → Month → Day)
- Double-click the hierarchy name to rename it (e.g., "Calendar Hierarchy")
- Test by creating a visual and dragging the hierarchy onto it
To validate, create a sample chart, verify drill-down works through all levels, and check that data relationships make sense (quarters show correctly within years, months within quarters, etc.).
It is important to note that creating a date hierarchy can significantly enhance the functionality and visual appeal of your Power BI report. With a date hierarchy, you can easily drill down into specific time periods and analyze your data more granularly.
Customizing your date hierarchy to suit your business needs
Power BI allows you to customize your date hierarchy to suit your business needs. There are several customization options available, including:
- Formatting options for each level of the hierarchy
- Naming options for each level of the hierarchy
- Adding custom columns to the hierarchy
By customizing your date hierarchy, you can make it easier to understand and analyze your data.
One of the critical benefits of customizing your date hierarchy is that it allows you to view your data in the most relevant way to your business. For example, if your business operates in a fiscal year starting in July, you can customize your date hierarchy to reflect this. This will allow you to easily analyze your data based on your fiscal year rather than the calendar year.
Creating a week-based date hierarchy
Sometimes, in fields like operations, logistics, weekly sales cycles, manufacturing schedules, and payroll systems, you may need to create week-based date hierarchies.
Week hierarchies are tricky because weeks don't fit into the standard Year → Quarter → Month structure—weeks can span two months or even two years.
There are a few solutions to this, though:
- Parallel hierarchy: Year → Week Number → Day (bypasses quarters and months)
- ISO Week standard: ISO Year → ISO Week → Day (weeks always belong to one year)
- Week of Month: Year → Month → Week of Month → Day (for monthly-aligned reporting)
Keep in mind week hierarchies need a date table with pre-calculated week columns: WeekNumber, ISOWeek, ISOYear, WeekStartDate, WeekEndDate. These require DAX formulas to handle year boundaries and week numbering standards.
How to remove or disable date hierarchies
There are many reasons you may want to remove or disable date hierarchies: performance optimization, data model cleanliness, avoiding conflicts with custom calendar tables, and eliminating user confusion.
Removing automatic hierarchies - Method 1 (global setting)
- Click File → Options and settings → Options
- Navigate to Data Load → Time intelligence
- Uncheck "Auto date/time"
- Click OK
This prevents new automatic hierarchies but doesn't remove existing ones. Applies to the current file only.
Deleting custom hierarchies
- Navigate to Model view or Data view
- Right-click the hierarchy in the Fields pane
- Select "Delete hierarchy"
Visuals using the deleted hierarchy will need reconfiguration. Press Ctrl+Z immediately to recover an accidental deletion.
When NOT to remove date hierarchies: Keep hierarchies for quick ad-hoc analysis, when you lack a custom calendar table, in small data models where performance isn't critical, or for training environments.
Using hierarchy slicers for interactive navigation
A hierarchy slicer is a filtering visual with built-in drill-down capability, displaying your hierarchical structure with expand/collapse functionality—like a folder tree in Windows Explorer.
Hierarchy slicers offer several benefits, including visual representation of the hierarchy, space efficiency by replacing multiple individual slicers, an improved user experience through contextual filtering, and a single point of interaction.
Setup steps
- Add a Slicer visual to your canvas
- Drag your date hierarchy onto the slicer's Field well
- Configure settings: single vs. multi-select, enable search, customize formatting
Hierarchy slicers are ideal for executive dashboards with high-level views and drill-down capabilities, as well as for self-service reports, interactive presentations, and comparative analyses using multi-select.
Hierarchy slicer vs. alternatives
Both hierarchy slicers and other alternatives can be good for specific use cases:
- Hierarchy slicer: Best for navigating pre-defined time structures
- Date range slicer: Better for arbitrary date ranges ("March 15 to April 23")
- Relative date slicer: For dynamic periods ("Last 30 days," "Current month")
Consider using the relative date slicer to allow users to easily filter data based on relative time periods (such as the last 30 days or the current month). Note that relative date slicers are different from hierarchy slicers.
Customizing, best practices & troubleshooting
Customization, best practices, and troubleshooting are key to maximizing the effectiveness of date slicers and ensuring an optimal user experience.
Here's what you need to keep in mind:
Customization options
Power BI allows you to customize your date hierarchy to suit your business needs through naming and formatting:
- Rename hierarchies and levels: Double-click names to change (e.g., "Calendar Year" instead of "Year")
- Fiscal year hierarchies: Create hierarchies from fiscal year columns for non-January year starts
- Business calendar customizations: 13-period calendars, 4-4-5 retail calendars require calendar table setup
One of the critical benefits of customizing your date hierarchy is that it allows you to view your data in the most relevant way to your business. For example, if your business operates in a fiscal year starting in July, you can customize your date hierarchy to reflect this.
All of these things can be solved by using a calendar table. [Master calendar tables for bulletproof date hierarchies →]
Best practices for date hierarchies in Power BI
When organizing your data with date hierarchy in Power BI, keep the following tips in mind:
- Choose the right date column and ensure data is clean and consistent
- Use calendar tables as your foundation—they provide continuous dates, pre-calculated periods, and support for fiscal calendars
- Arrange levels in logical order (Year → Quarter → Month → Day)
- Disable automatic hierarchies when using custom calendar tables
- Use clear, business-friendly naming aligned with your organization's terminology
- Limit hierarchy depth to 4-5 levels for optimal performance
- Use the drill-down feature to analyze data at different time intervals.
- Use DAX formulas to perform time-based calculations, such as year-to-date or month-to-date revenue.
- Consider using the relative date slicer to allow users to easily filter data based on relative time periods (such as the last 30 days or the current month).
- Use visualizations such as line or area charts to highlight trends over time.
- Create custom date tables. This allows you to have more control over your data's date ranges and granularity. You can add columns to your custom date table, such as fiscal year or quarter, to better align with your organization's reporting needs. To create a custom date table, you can use the "Enter Data" feature in Power BI and manually enter the dates and corresponding columns, or you can use a DAX formula to generate the table automatically.
Troubleshooting common issues
If you are experiencing issues with your date hierarchy:
- Ensure data in your date column is clean and consistent
- Check that levels are ordered correctly with no missing levels
- Verify the data type of your date column is set correctly
Furthermore, here are some more specific scenarios to check for:
- Hierarchy doesn't appear: Likely created at the visual level instead of data model. Create in Model view.
- Drill-down shows wrong data: Check parent-child relationships and sort order. Verify all columns are from the same table.
- Week level not available: Weeks require calculated columns in a calendar table. See: [Calendar Table guide →]
- Fiscal year issues: Using calendar hierarchy for fiscal data. Create dedicated fiscal hierarchy from fiscal year columns.
- Performance problems: Automatic hierarchies creating hidden tables. Disable auto date/time and use custom calendar table.
Advanced techniques
If you have mastered the basics of using a date hierarchy in Power BI, you can use several advanced techniques to analyze time-based data. These include:
- Using advanced DAX formulas to perform complex time-based analysis.
- Creating custom visualizations with the Power BI developer tools.
- Using machine learning algorithms to forecast future trends.
- Multiple hierarchies: Create separate hierarchies for different date roles (Order Date, Ship Date) with clear naming prefixes
- Time intelligence integration: Hierarchies support DAX time intelligence functions (TOTALYTD, SAMEPERIODLASTYEAR) for period comparisons
- Custom visualizations: Zebra BI visuals provide professional time-based charts that seamlessly integrate with hierarchies
Professional time-based reporting with Zebra BI
Consider using Zebra BI visuals to create a more engaging user experience.
Zebra BI provides purpose-built visuals for professional business reporting in Power BI, designed specifically for time-based analysis that centers on financial reporting, management dashboards, and executive presentations.
Remember your key advantages with date hierarchies in Zebra BI:
- Automatic period comparisons: YoY and MoM comparisons with automatic variance calculations
- Professional formatting: IBCS-compliant charts that meet CFO and board-level expectations
- Zero configuration: Add your hierarchy and get professional results immediately
- Waterfall charts: Show how values change across time periods with hierarchical drill-down
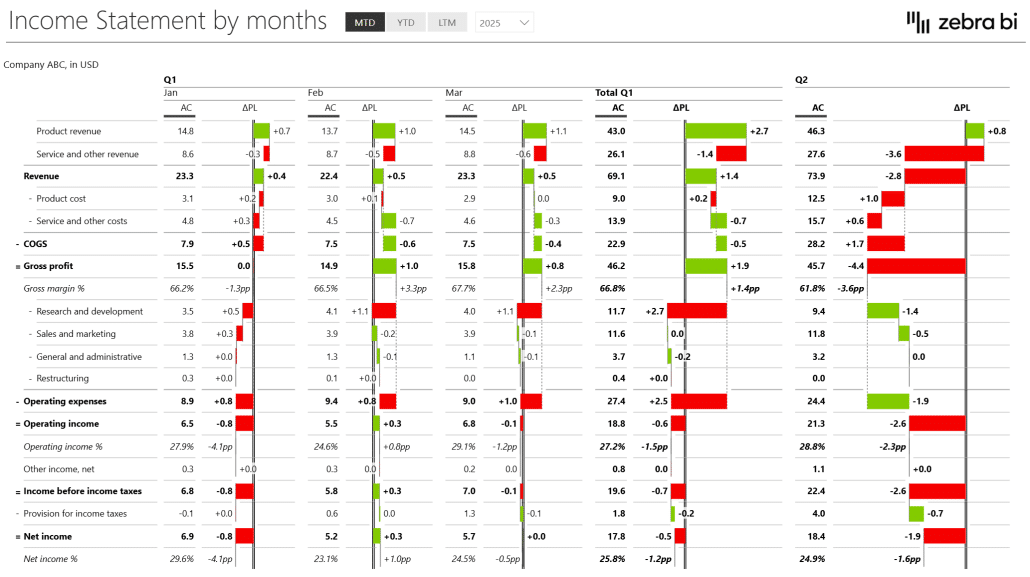
- Variance reports: Actual vs. Budget by time period with clear visualization
Use cases include financial reporting, such as income statements and budget versus actual comparisons. It also covers performance dashboards with KPI tracking and year-over-year comparisons. Additionally, it is ideal for board presentations, offering professional, drill-capable charts. Lastly, it supports management reporting with automated period comparisons.
Combined with the hierarchy skills from this guide and a proper calendar table foundation, Zebra BI transforms Power BI into a professional financial and management reporting platform.