Creating good Power BI dashboards requires you to think hard about time. What are the periods you want to show? What is the starting date of your data series. How long is the period you want to study? That's where time intelligence in Power BI comes in.
Time intelligence in Power BI (with DAX) is something that will make your reports and dashboards much more dynamic, flexible, understandable, and readable. However, it's also something that's actually pretty hard to get right. Most people start having issues once they move beyond the basic standard calendar that we all have in our Power BI models.
This post will look at how you can use time intelligence DAX functions to work with time periods that allow you to eliminate any seasonality or fluctuations from your reports by using rolling or moving averages.
Note: make sure you also check out our Power BI DAX guide to learn the 5 essential DAX tricks you should have in your reporting arsenal.
Examples of time intelligence in Power BI
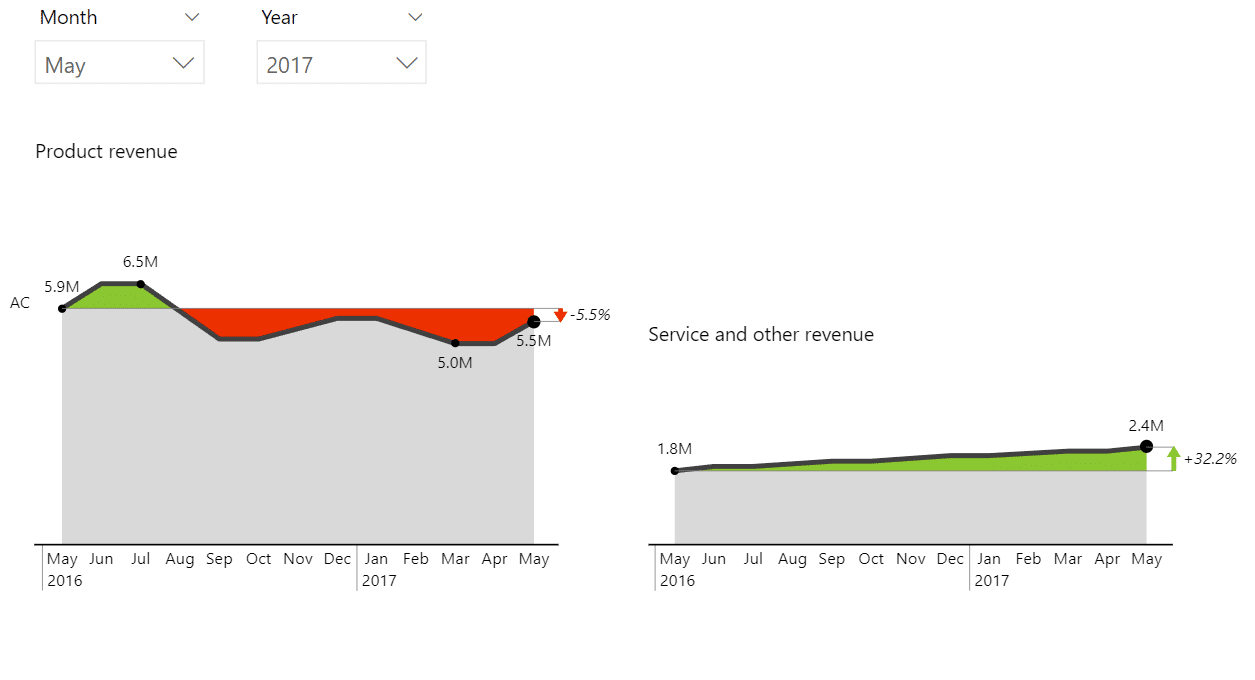
First, let's look at the basics you need to get right. Below is an example of a dashboard that uses slicers to switch between dates, months, or years.
Now, when you switch from April to May, you want everything on your report to change, including charts. In a typical business report, you may want to show the results for your month-to-date or year-to-date periods and perhaps even for the full year where you compare forecasts to plan.
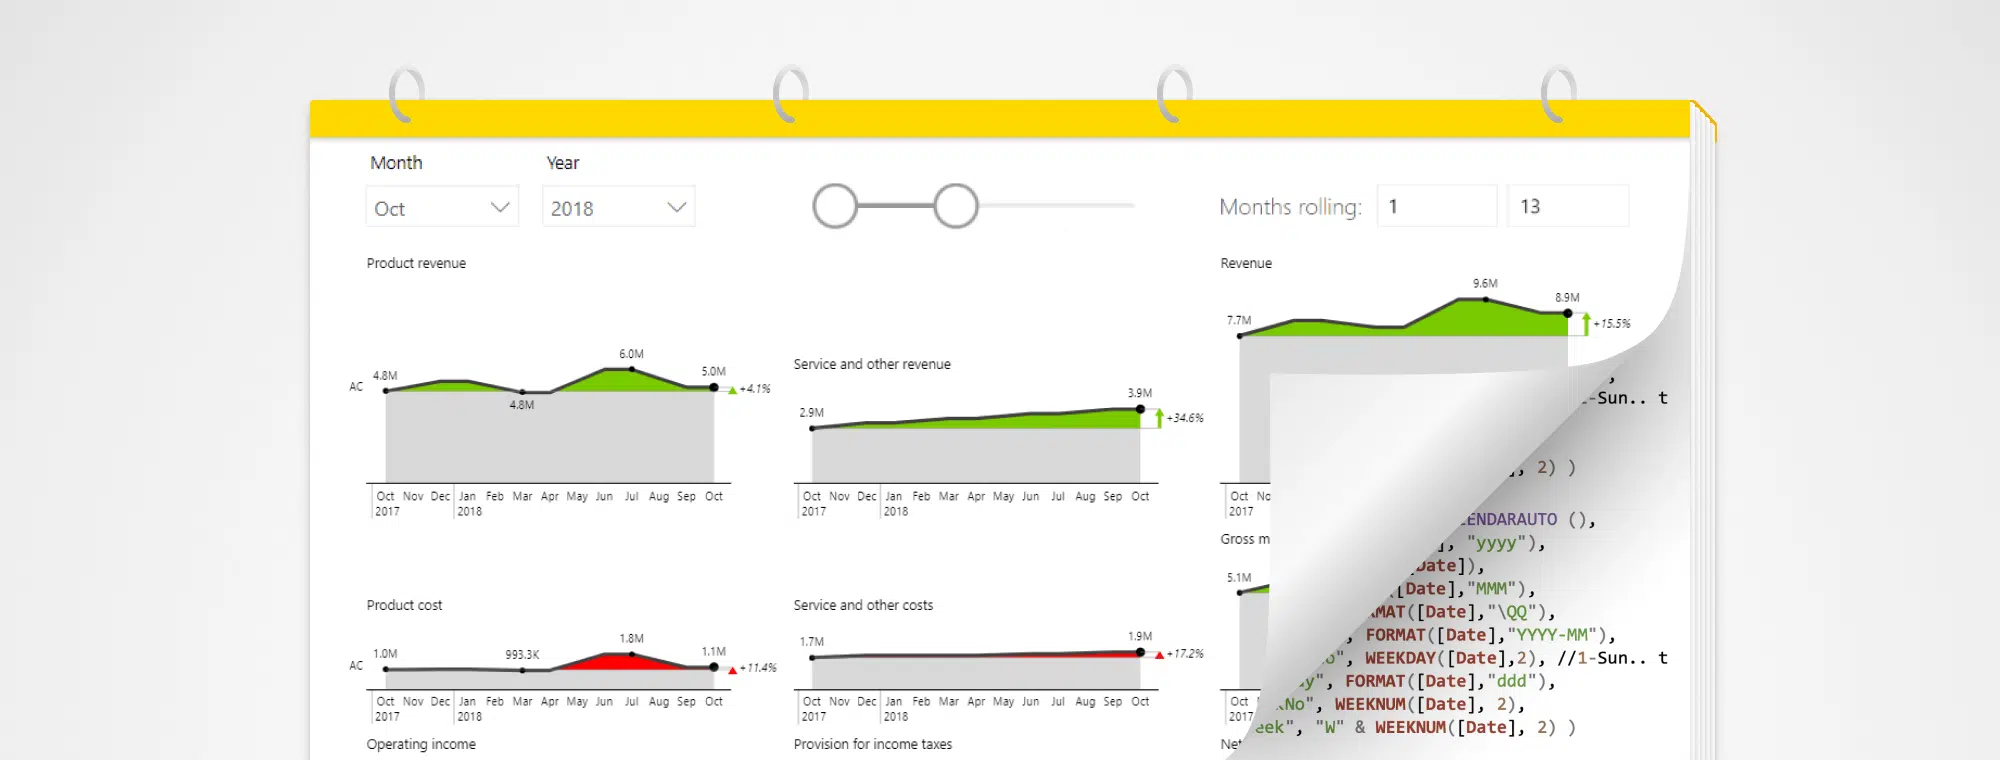
For a more advanced take on time intelligence, you could use rolling periods. This means that instead of having a chart show data from January to December, you could have a chart displaying data for a 13-month rolling period from May to May the next year. And when you change the starting point to June, you want the chart to reflect that.
In this instance you control the month as well as the year and the two slicers (Month and Year) give you dynamic 13-month rolling periods on your axis that you control. This is very useful for marketing dashboards with data like market share, because you want to actually compare the June of this year to June of last year. It also works for operational reports showing data like on-time delivery in percentages and similar.
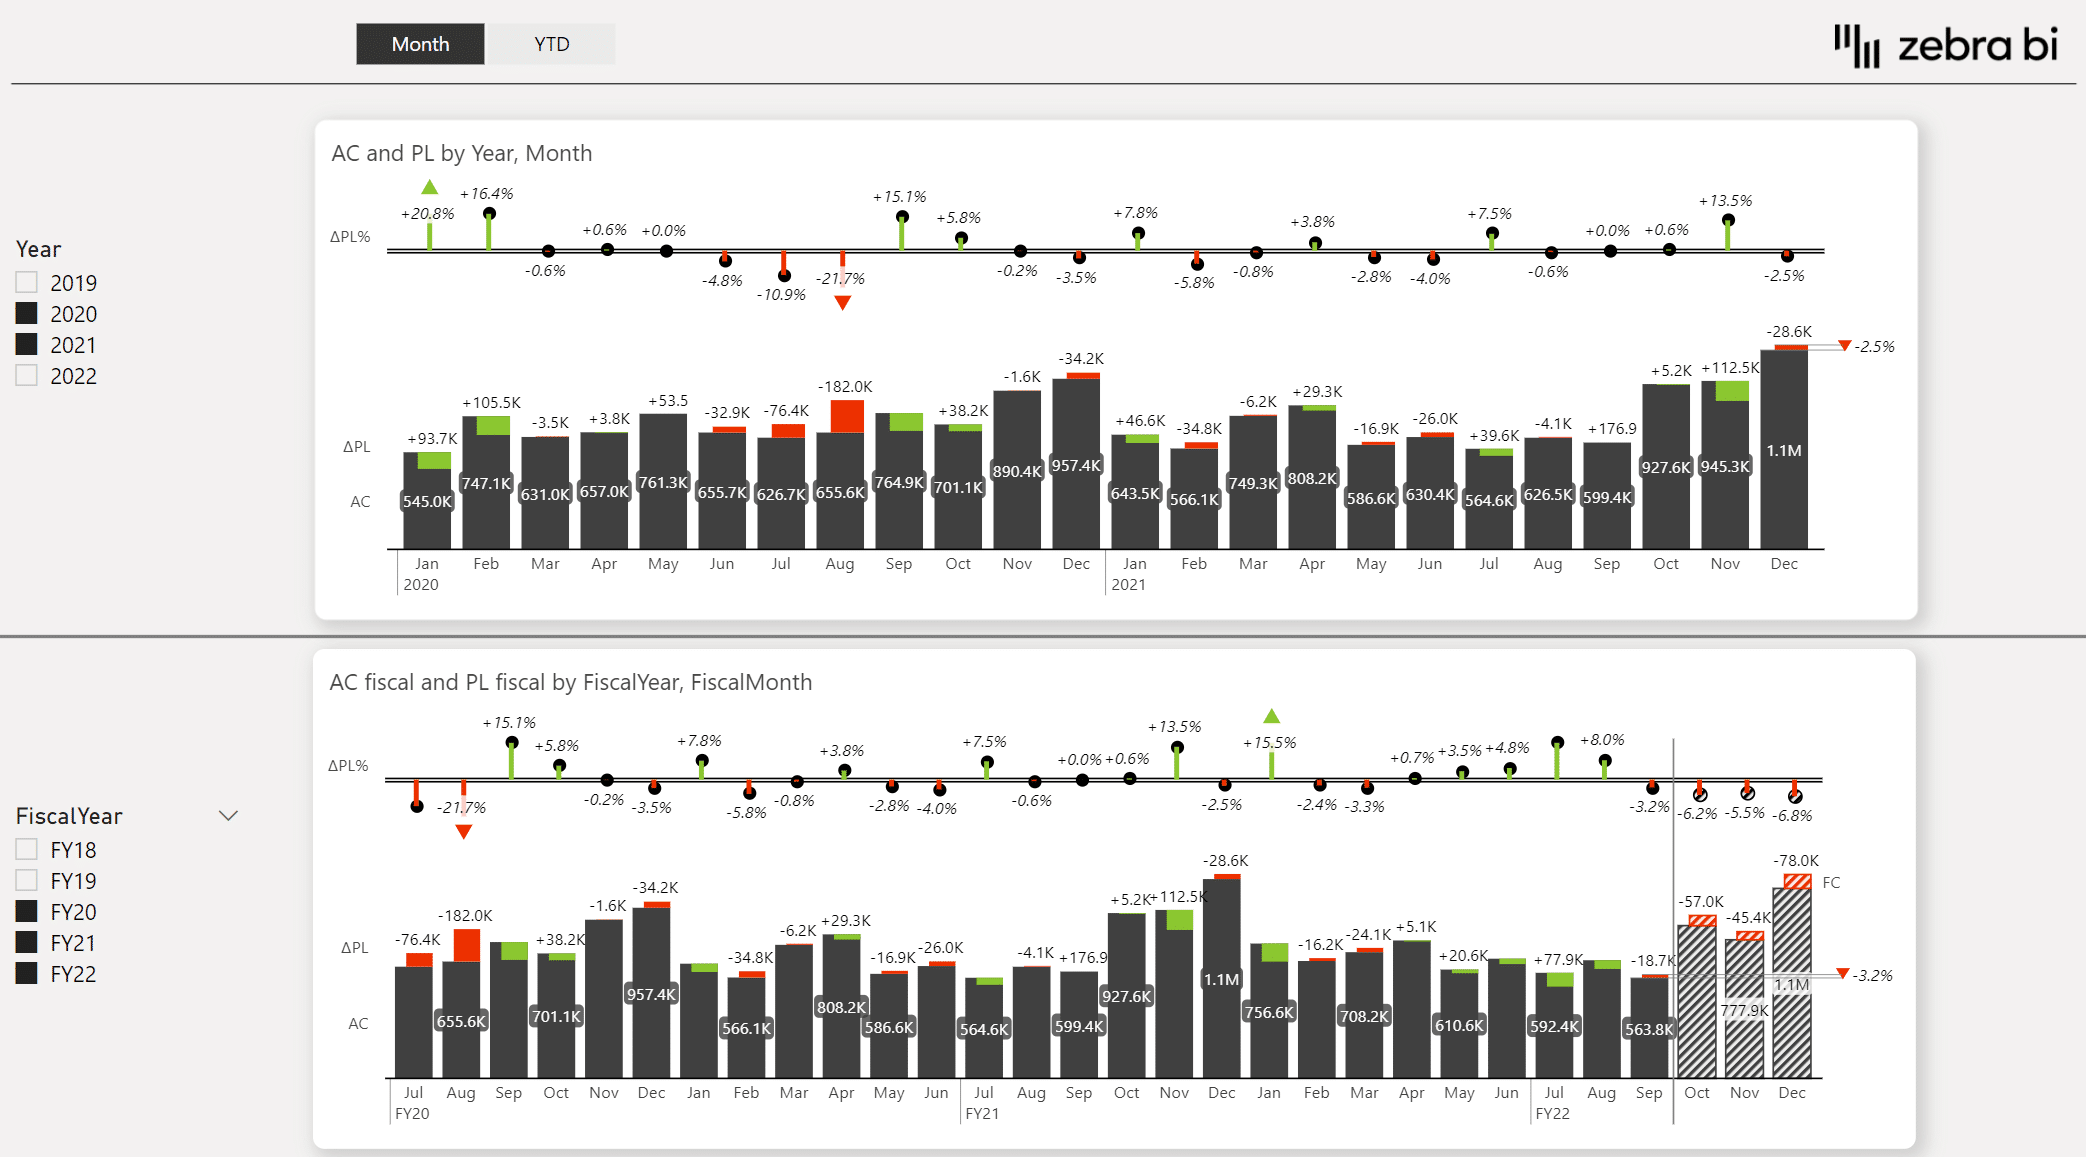
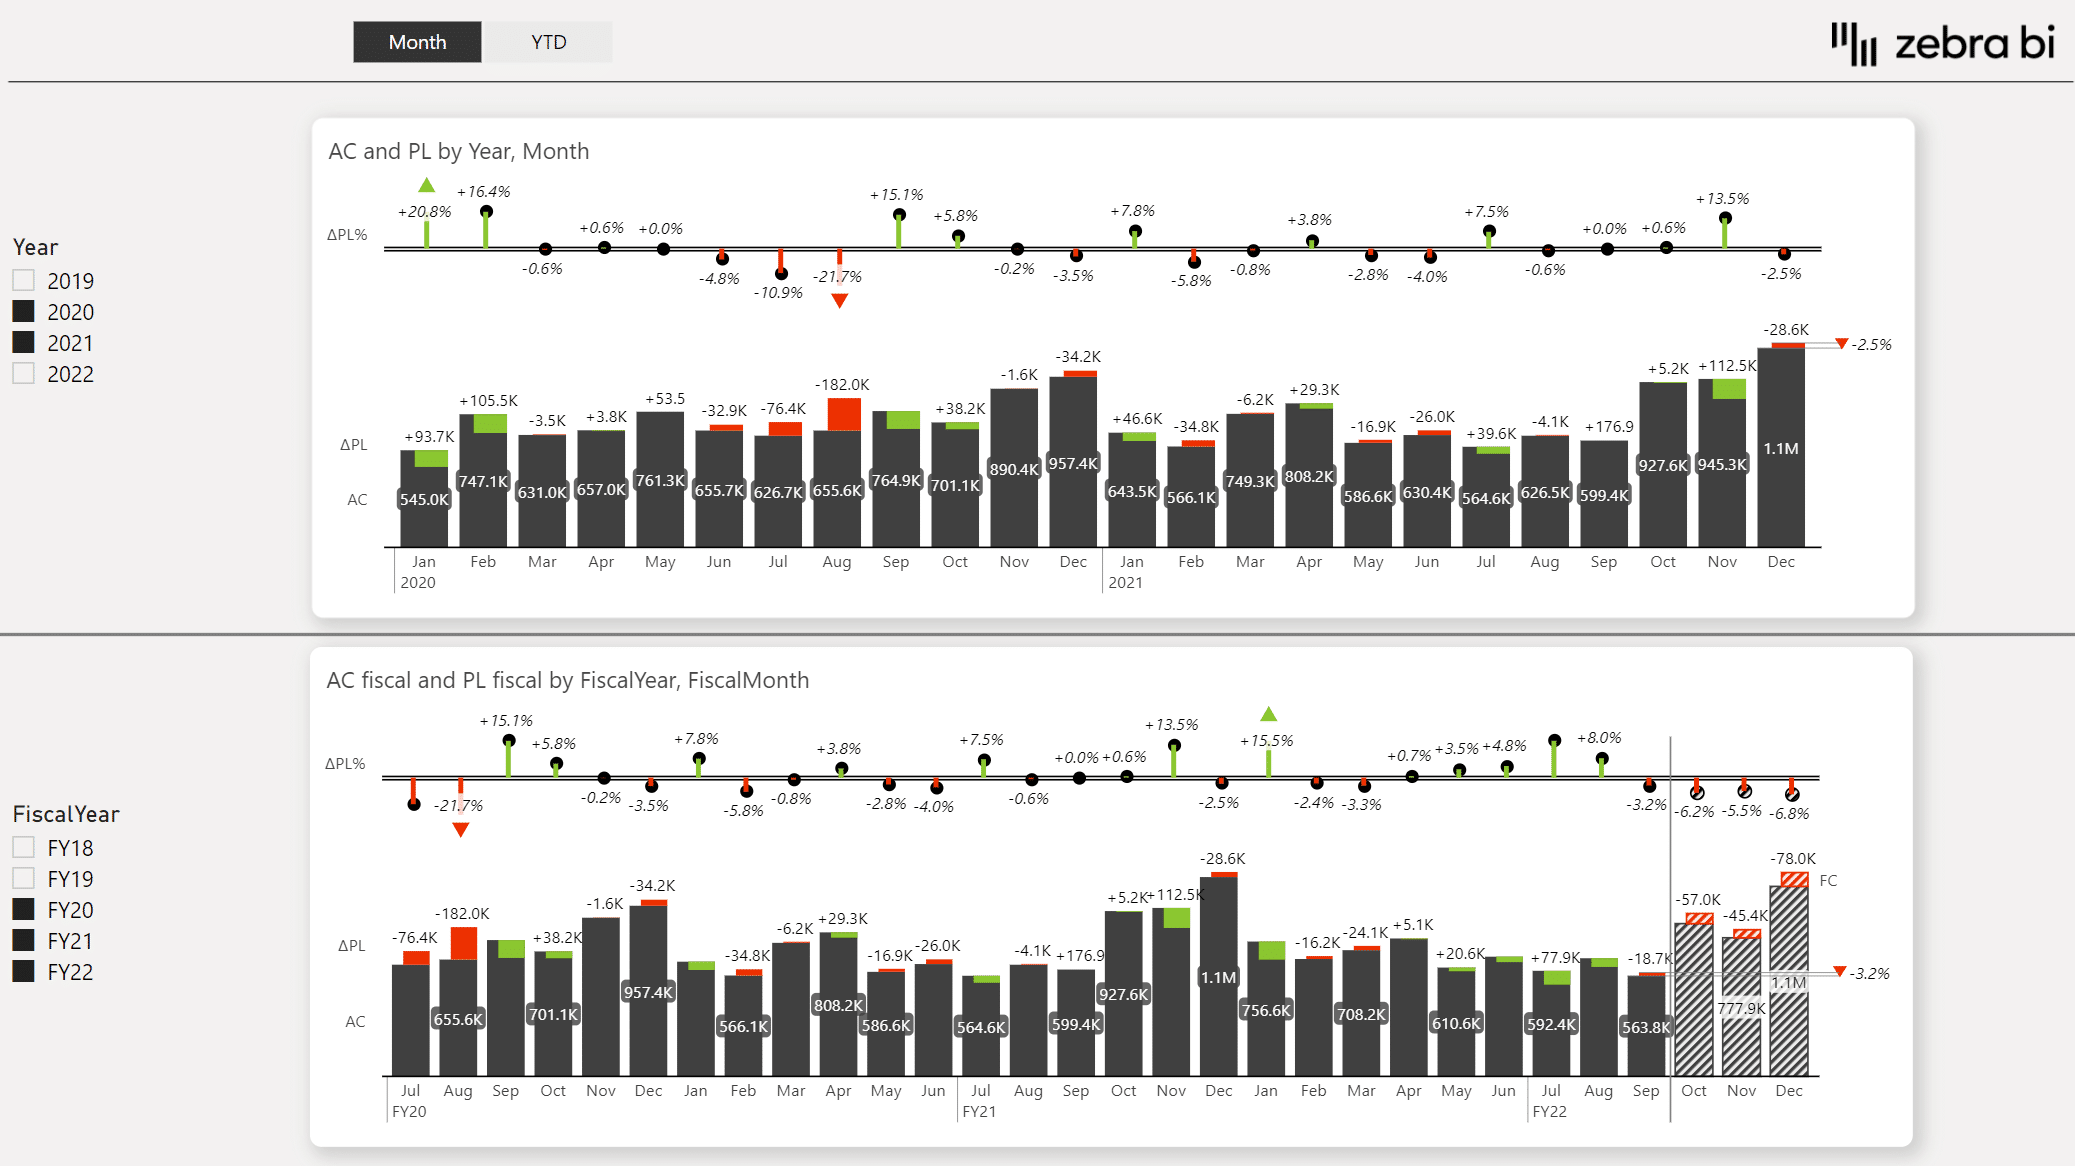
Here's another interesting example. It uses the regular calendar and the fiscal calendar in a single dimension in a Power BI model. The top chart shows calendar years and the bottom one displays fiscal years that start in a particular month (July in this example).
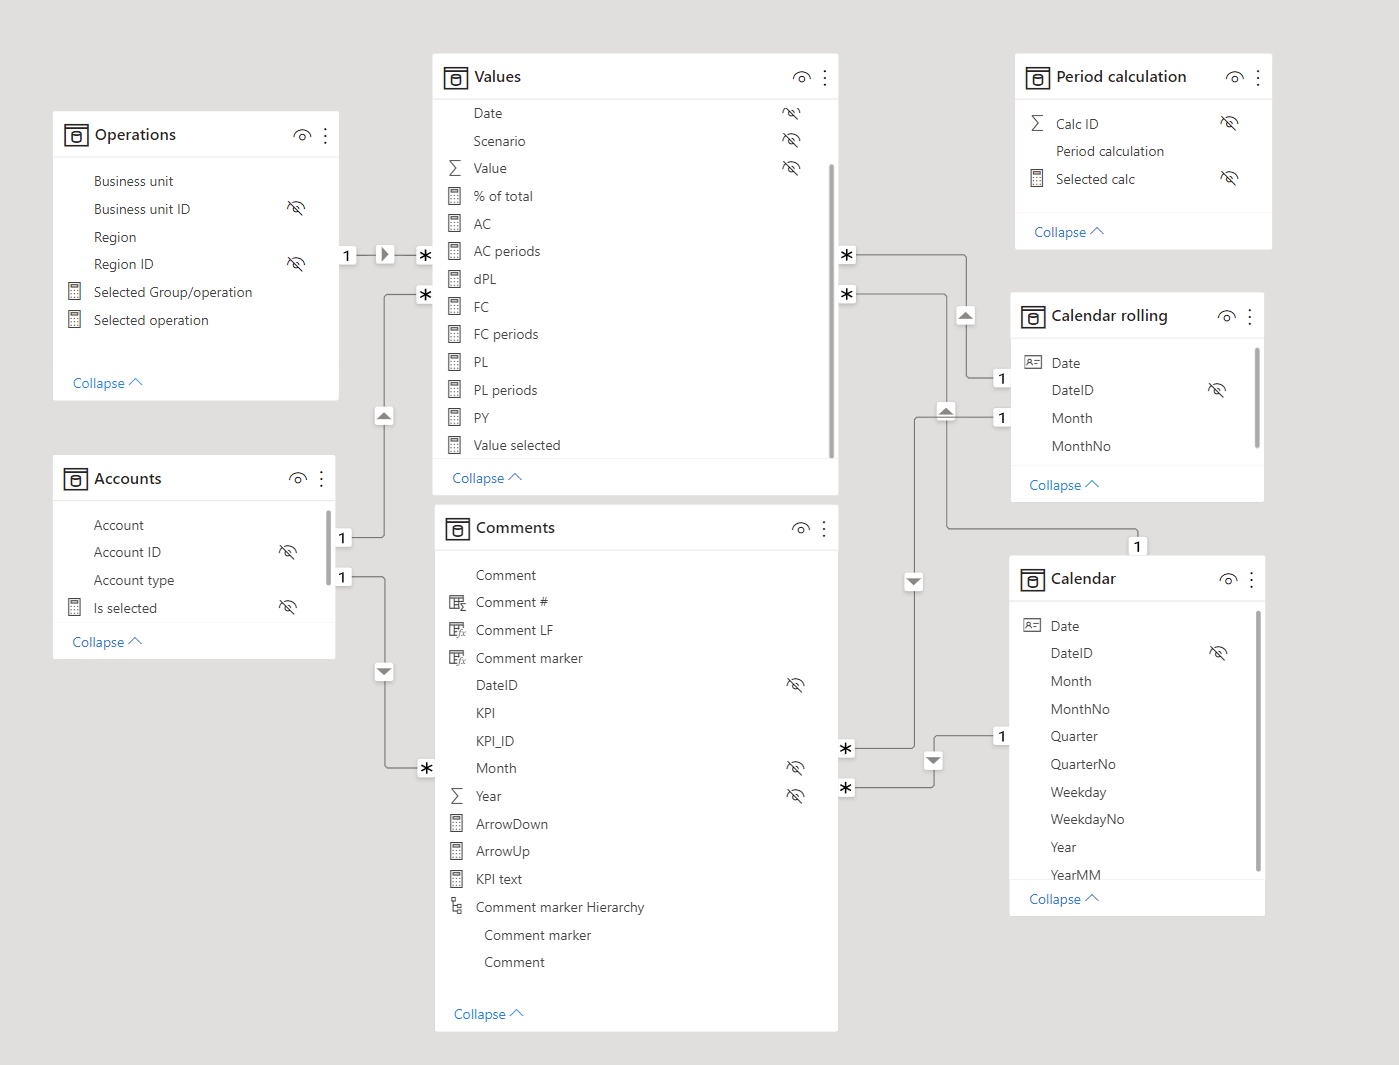
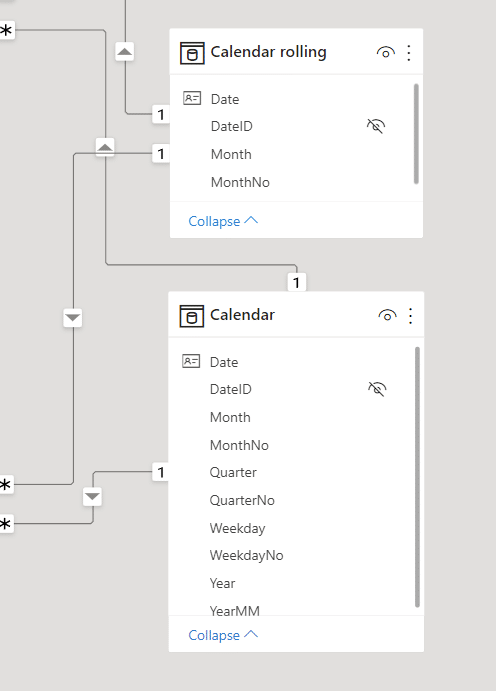
The table titled Calendar is the standard calendar that has the dates, date ID, month, month numbers, quarters, year and other calendar values. The second table is Calendar rolling, which is needed for rolling periods. The last calendar table is Period calculation, which is a disconnected table.
The standard calendar table was generated with DAX, even though you can also do it in PowerQuery, which is the recommended method because it's much faster. Let's look at the DAX command briefly:
The AddColumns command was used to add several columns. Date field was generated with CalendarAuto function. DateID is very important because you use it to create all the relationships between your calendar and your fact tables. This is then followed by years, months, dates and quarters to generate a standard calendar.
Period calculation
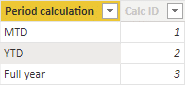
Now let's look at the Period calculation disconnected table. It's a very short and simple table that contains just a list of all the options for period calculations for different time calculations that we will use in our reports. So, we have month-to-date, year-to-date and full year data. Essentially, it just holds your period options.
The period calculation table allows you to switch between different periods (month-to-date, year-to-date, full year). One way you could use it is to drop the measure down on your dashboard and use it as a slicer.
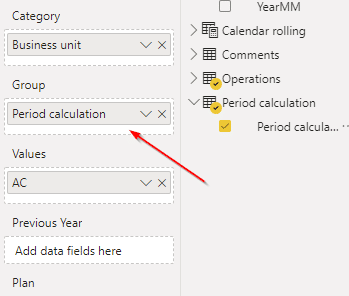
The second way to use it is to display all of those period calculations in one table. Now that you have the calculations, you can just use this period calculation column to group the table. Simply drop the Period calculation measure into your Group placeholder to put groups in the table.
This now shows the performance for month-to-date, the year-to-date performance and full-year performance.
How does period calculation work?
The table Period calculation uses a measure which returns the selection of period calculation.
For example, if you clicked the year-to-date option in a slicer, this formula will return 2 as its value. It would then filter everything in the chart based on this value. If nothing is selected, then the minimum is the minimum of all the options in the table, which is 1.
Now we need to make sure that once the period is selected, the correct values are returned. This is done by using a switch statement:
If you selected the month-to-date option (returning 1), this option performs a regular sum of all values. If you selected the year-to-date option, the formula again performs a sum while using the DATESYTD function. The third option is the full year. For the full year, you simply ignore the selection of your month and calculate the sum across all months.
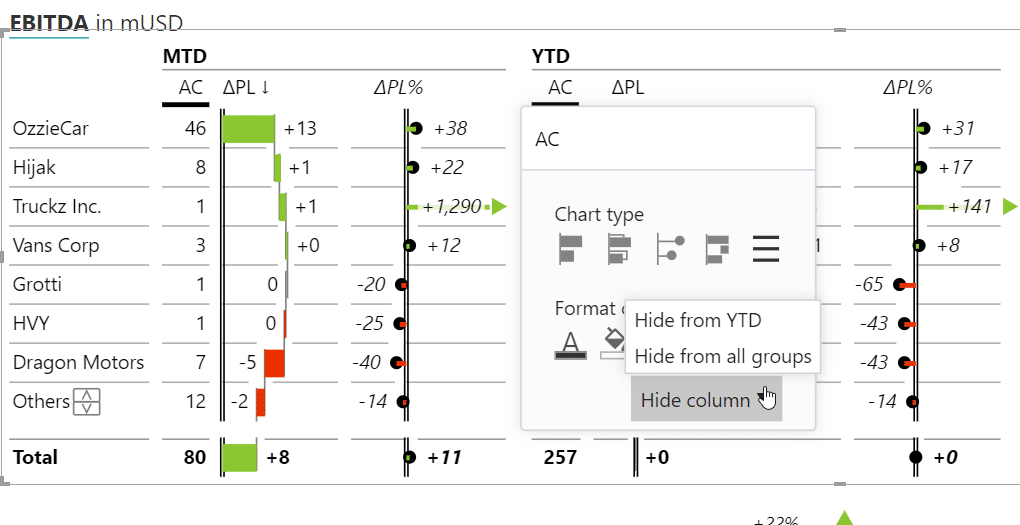
Zebra BI tip: In a typical business report you might encounter a situation where you are in the middle of a year and don't have actual data for the full year. Zebra BI offers a special feature where you can hide or show specific columns in a table. You simply hide the actual data for the full year chart. You can simply hide certain columns from any of the groups.
Filter based on the selected month
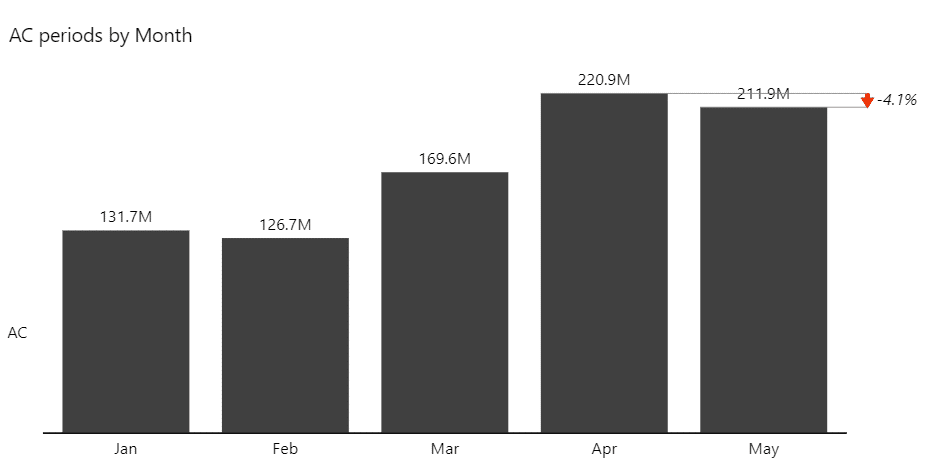
The second thing we'll be handling now is how to filter based on the selected month. If you click on the chart in your PBIX example, you'll see that actual data is displayed up until the month you selected. If you select April, it will show up until April. Once you switch it to May, it will display it until May.
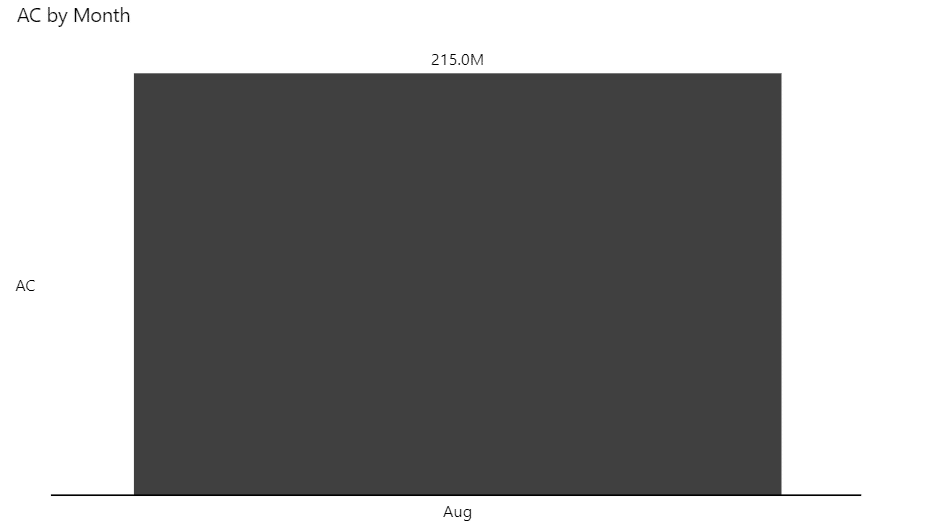
To do this, you need to take a slightly different approach. When you drop a chart into your report and filter it by the selected month, it will only display a single month, like this:
You could select Format tab on your ribbon and then select Edit interactions to turn of the filter. But in this case, the chart will simply not be filtered, which is not what we are looking for.
What we want to do is to show the values up to the month we selected. To do this, you have to first realize that when you're using time filters, there is no way to dynamically choose your periods as long as you have just one calendar. So what we need is a second calendar.
Adding a second calendar to your dashboard
Add a second calendar to your data model.
It can be just a copy of your regular calendar. In our example, it is named "Calendar Rolling"because we'll also use it for rolling periods like the 13-month period. Here is the DAX code for it.
It just adds date, date ID, year, month, and month number columns. Keep in mind that you do need the month number because you will need to sort your charts by your months.
Zebra BI tip: Use short names. It will help you keep your charts cleaner and more legible. For the month, we used the three-letter abbreviation here.
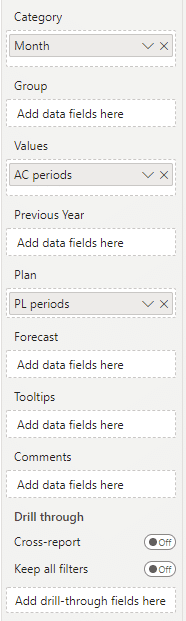
That was the first part. If you want to create a dynamic chart, you need to put Month measure from your new calendar under the Category placeholder. The next step is to create a DAX statement that will return the data for the right number of periods. Let's create a new measure called "AC periods".
Here is how it looks:
AC periods = CALCULATE('Values'[AC], DATESINPERIOD('Calendar'[Date], STARTOFYEAR('Calendar'[Date]), MAX('Calendar'[MonthNo]), MONTH))
Here is how this calculation works: First it does the sum of values (CALCULATE). Then, it gets all the periods up until the selected month. It does this using the DATESINPERIOD function that returns a table with several rows.
We also need the start date, which we get from our regular calendar. We want to get the months from January up until current month. The function for that is called STARTOFYEAR. This is followed by MAX function which returns the largest value in the MonthNo column. The last part specifies the interval and in this case, we used MONTH.)
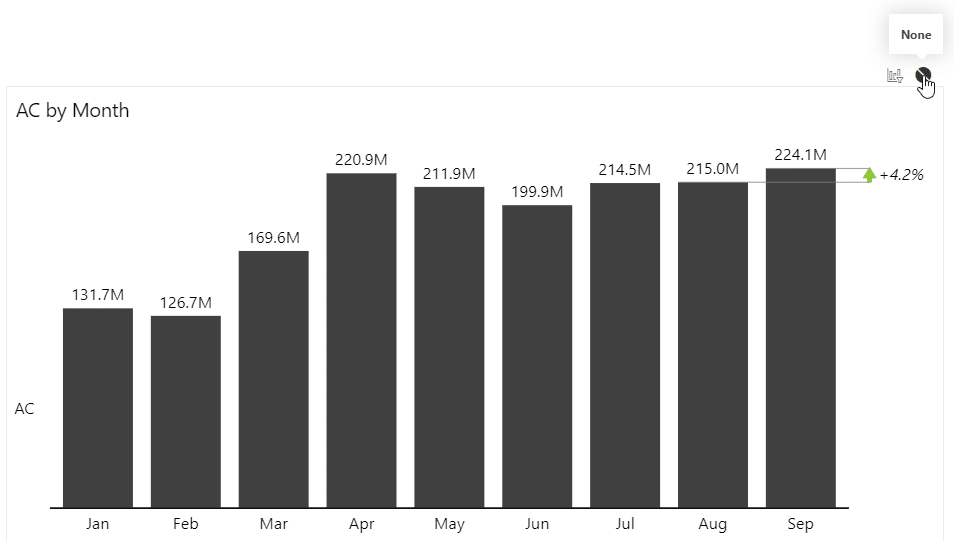
Drop this measure under Values placeholder and you'll get a chart that only shows the values up to the month you selected in your slicer.
Adding plans and forecasts
This technique is useful for other time views as well. Let's say you want to show a 12-month period because you are working on a plan. Your next measure will be very similar:
PL periods = CALCULATE([PL], DATESINPERIOD('Calendar'[Date], STARTOFYEAR('Calendar'[Date]),12,MONTH))
The first part is essentially the same. You calculate the Plan measure and then use DATESINPERIOD and set the start of the year in January with STARTOFYEAR. After this, you simply need to return 12 periods at the month interval and you will get the final result.
If you wanted to get a five-year rolling period, just replace "12, MONTH" with "5, YEAR" and you will be able to filter by year.
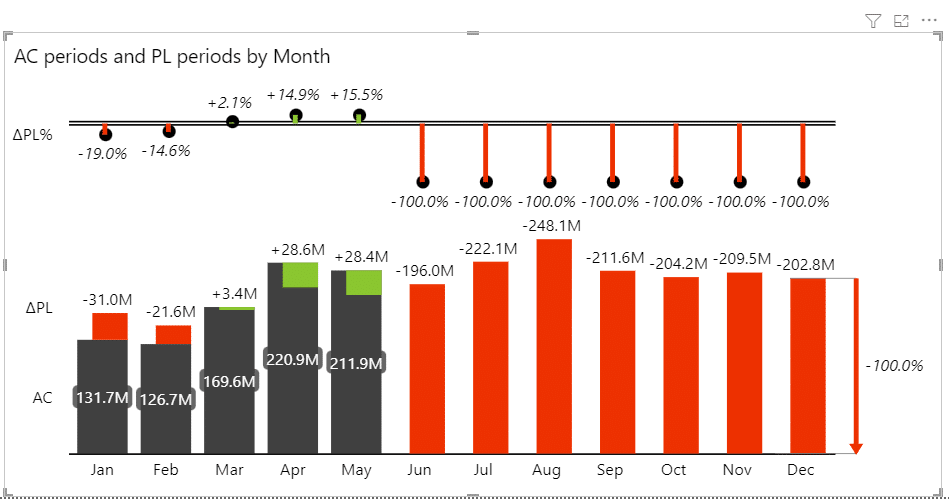
Name this value PL periods in your project and drop it into the Plan placeholder.
While this works with native visuals in Power BI, it looks great when you are using with Zebra BI custom visuals.
The next step would be to add forecasts (FC periods measure) to your Forecast placeholder, so you can always see the forecasts up to the end of the year. This is what we were working towards. This chart shows actuals up until the current month and then the forecast and plan. It always shows the full year of data.
Rolling periods
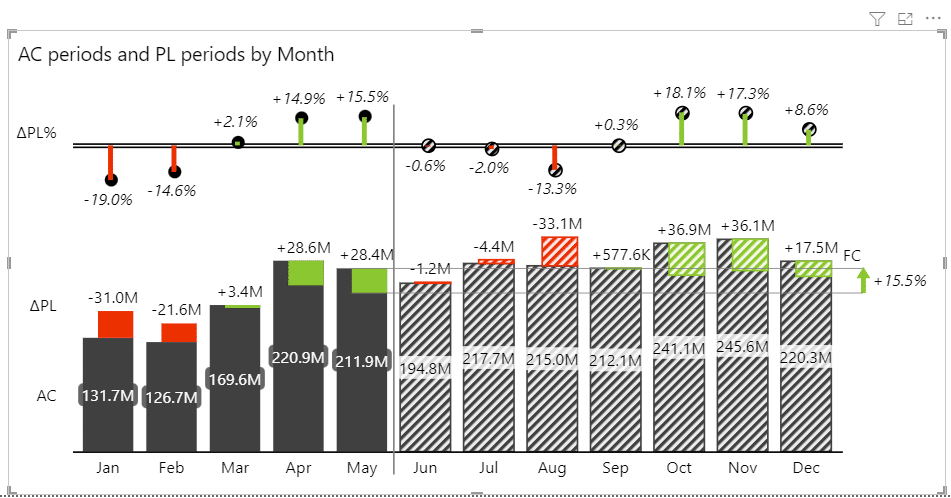
The same function is also used for rolling periods. Let's review the dashboard from the start of the post.
These three charts are showing a 13-month rolling period. This means that if you select May as your starting month in the slicer, it will show data for the 13 following months. If you switch to September, the chart will show 13 months from September.
Here is how the DAX formula looks for the measure that makes this possible.
Rolling AC = CALCULATE('Income Periodical'[Value AC], DATESINPERIOD(Periods[Date], MAX(Periods[Date]), -13, MONTH))
This formula essentially shows data for 13 months prior to the selected date, hence the "-13." It looks at the maximum date, which is the month you selected in the slicers, and then shows data for the preceding 13 months. You could also set this value to -12 to show the previous 12 months. And again, you can switch months to days or years to examine other periods.
Fiscal calendars
Fiscal calendars are a frequently requested topic in Power BI time intelligence.
Standard calendars don't always cut it, because in some companies, fiscal years start in April. This is not hard to do in Power BI, so let's look at how. This is the DAX we use to create a second calendar:
In addition to the standard calendar, here is a second calendar, called Fiscal Calendar. First, let's look at the months. The MonthNo value in the regular calendar returns the number of the selected month. For example, March returns "3", April returns "4" and so on.
When your fiscal calendar is shifted, you also need to shift month numbers. Let's say April is the start of your fiscal year. This means that this function must now return value "1" for April, "2" for May and so on. We need to shift the date and we do this by setting the value of FiscalShift. In our case, we are using a measure that is defined in a separate table. However, you can also hard code your shift manually into every line, so for a fiscal year that starts in March, you would just put "3".
"FiscalMonthNo", MONTH(EDATE([Date], 3)),
If you look closely, you see that we used the EDATE function in our expression. After you shift your month number, you also need to shift your year, which you also do with EDATE. Overall, you need to shift all your values (fiscal quarter and fiscal year month) apart from fiscal month names.
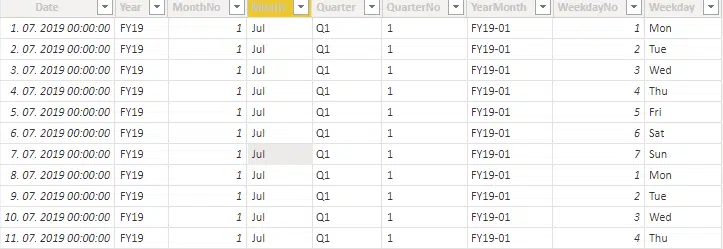
This is what our calendar looks like in data view:
July is the first month of the fiscal year and is therefore the first month of the calendar.
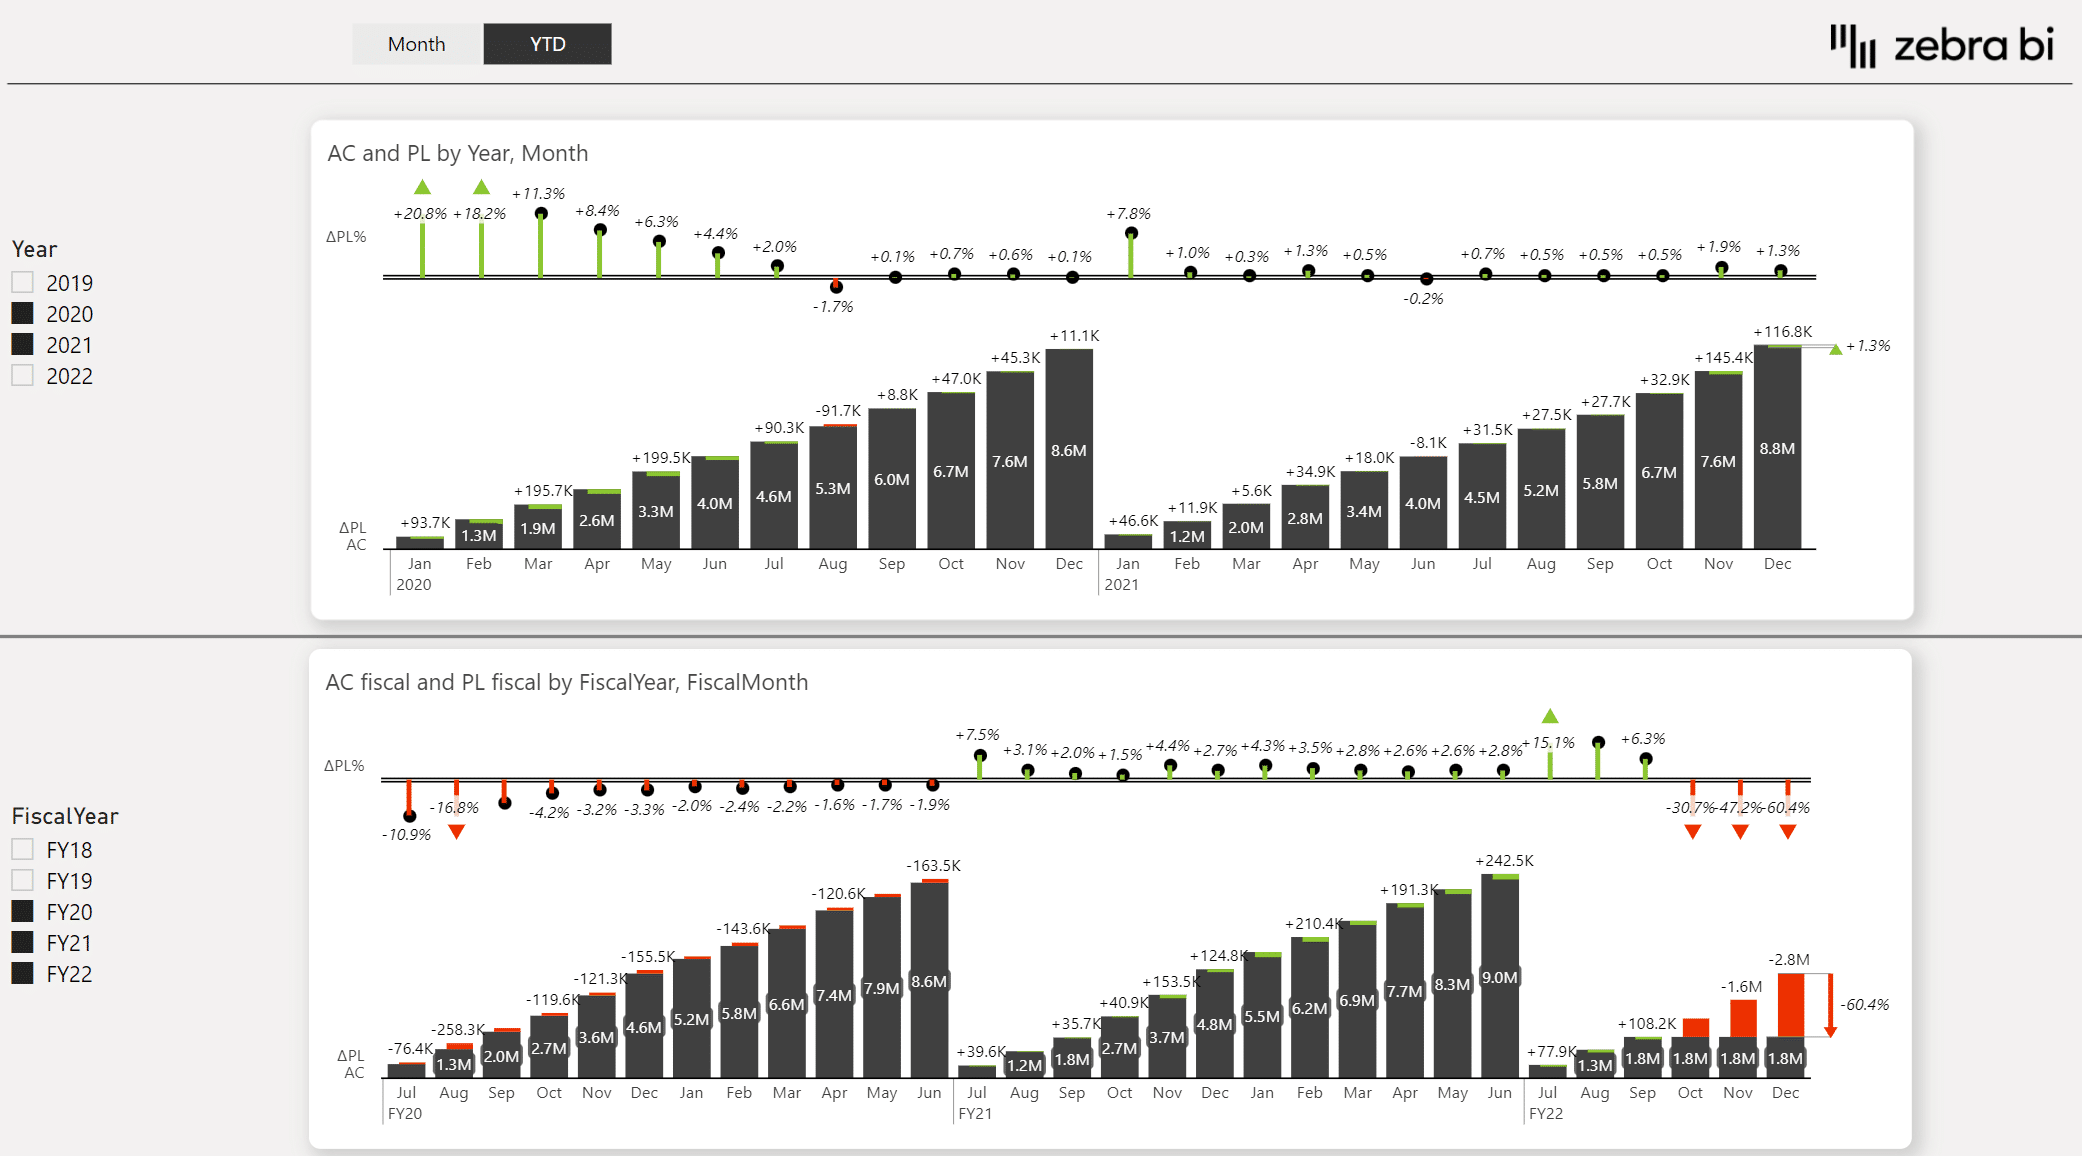
Making it work with the Year-to-Date view
So, here are the two charts we are working with now:
We still need to adjust your measures. While basic measures will work, once we start working with year-to-date calculations, we will need to modify them a bit to work.
Once we switch to the year-to-date view, we want the chart to reflect our values correctly.
To achieve this, we need to adjust actuals, forecasts and plans, so they start on a specific date, which is the start of our fiscal year. Here is the DAX function for actuals:
The new thing here is the date "6/30" which tells Power BI that it should calculate year-to-date and full years using the correct months.
To achieve the above result, you will need to have two sets of measures in your dashboard - one for your regular years and one for your fiscal years.
Time intelligence in Power BI - PBIX Example file
When working with time intelligence in Power BI, you need to know your way around DAX functions. Hopefully, this post explained how to create better views of your data that help you understand your business better.
To get an even better idea of how you can work with these features, enter your data below and download our PBIX example file.
Get follow-along PBIX example
If you'd like to try all of this yourself, enter your data below to get immediate access to all PBIX examples used in the this tutorial and the full 1-hour video recording of the webinar with Zebra BI's CEO & Founder Andrej Lapajne.
 September 8th
 February 22nd