How to Use Excel for Inventory Management: The Essential Guide for 2023
In today's competitive business landscape, effective inventory management is crucial to maintaining a company's financial health. That's where understanding how to use Excel for inventory management comes in. Excel, a powerful and widely-used tool, can significantly streamline your inventory management processes and improve your company's overall financial performance.
In this comprehensive guide, we'll walk you through the ins and outs of using Excel for inventory management, covering essential techniques, tools, and strategies. With the knowledge and skills acquired from this guide, you'll be well-equipped to manage your inventory efficiently, optimize cash flow, and make data-driven decisions that boost your company's success.
Let's dive in and explore how to use Excel to elevate your business to new heights.
The role of inventory in a company's financial health
Inventory plays a significant part in a company's financial health, and understanding how to use Excel for inventory management can help you optimize this vital aspect of your business. Efficient inventory management impacts cash flow, ensures financial statement accuracy, and enables businesses to maintain appropriate inventory levels to meet customer demand while avoiding overstocking or stockouts.
In the sections that follow, we will delve into the various ways Excel can be used for inventory management, providing you with valuable insights and tools to help you maintain a healthy inventory and enhance your company's financial performance.
Setting up an Excel inventory management system
To harness the power of Excel for inventory management, you'll want to set up a well-organized spreadsheet to keep track of your inventory. Kick things off by making a list of all your inventory items, noting down their names, quantities, and values. Arrange this info in a clean and logical layout, using rows for individual inventory items and columns for each type of data (for example, item name, quantity, and value).
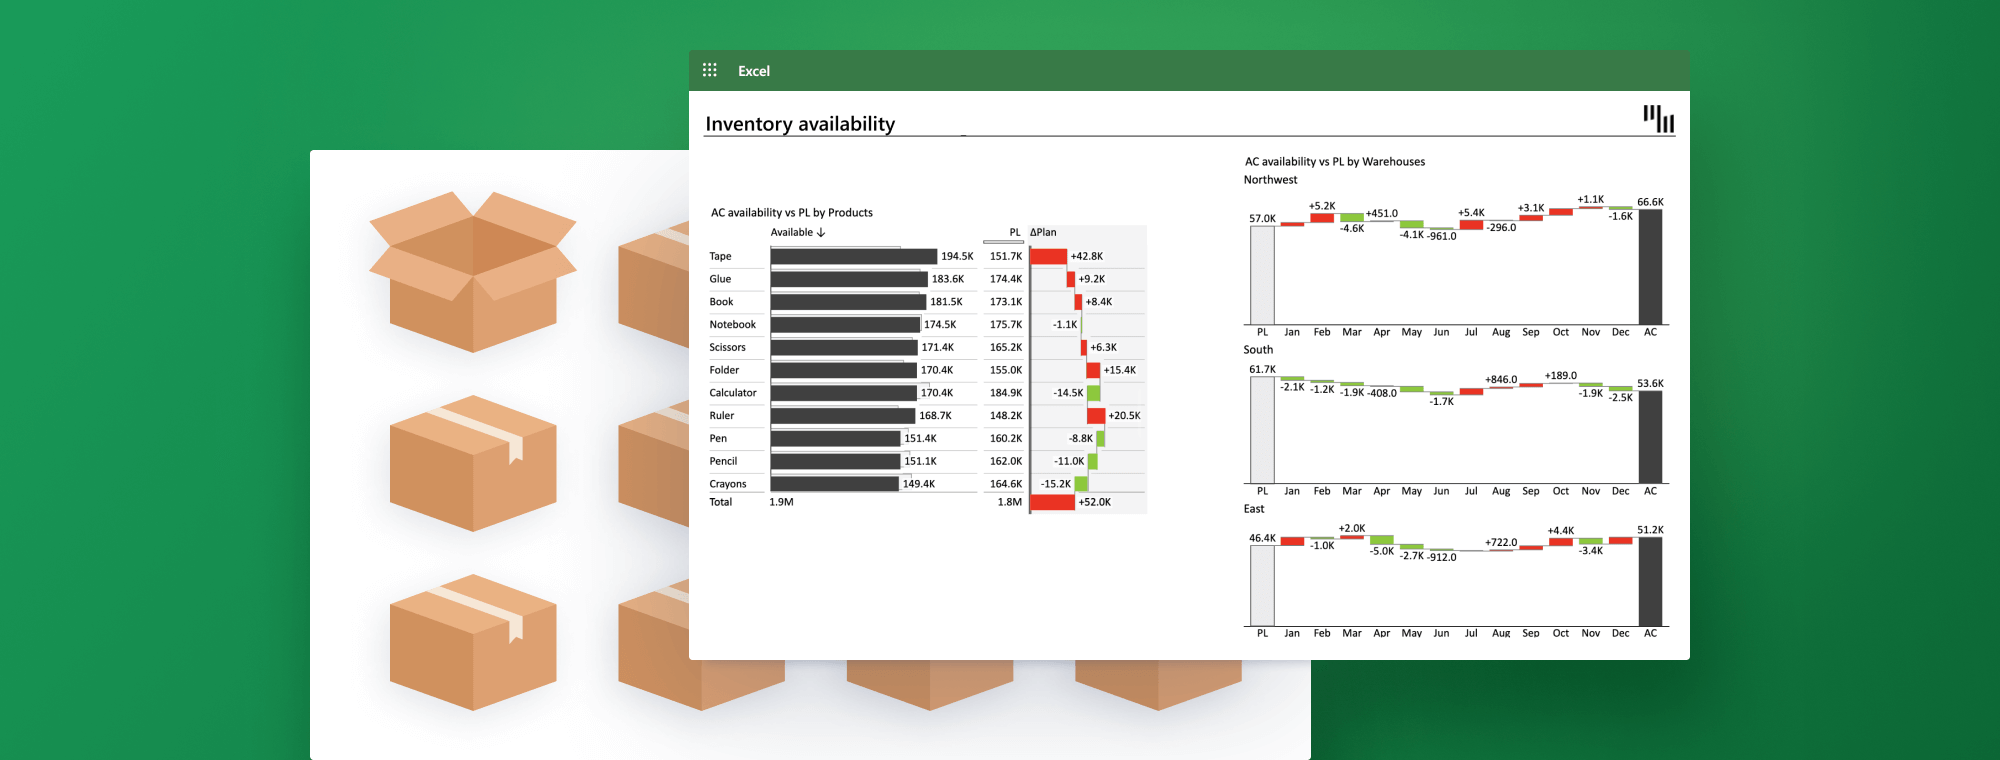
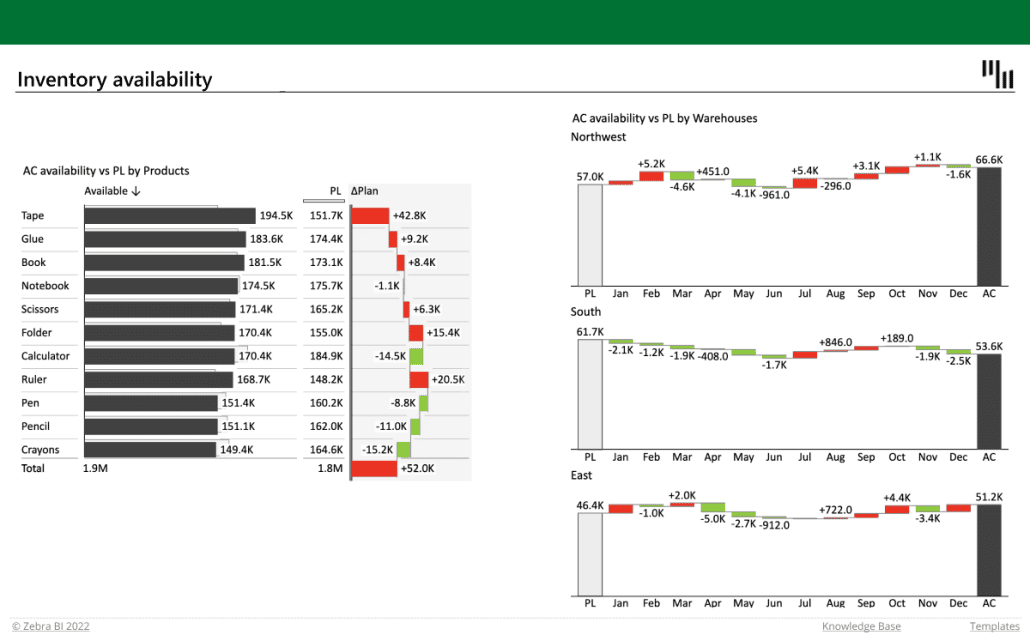
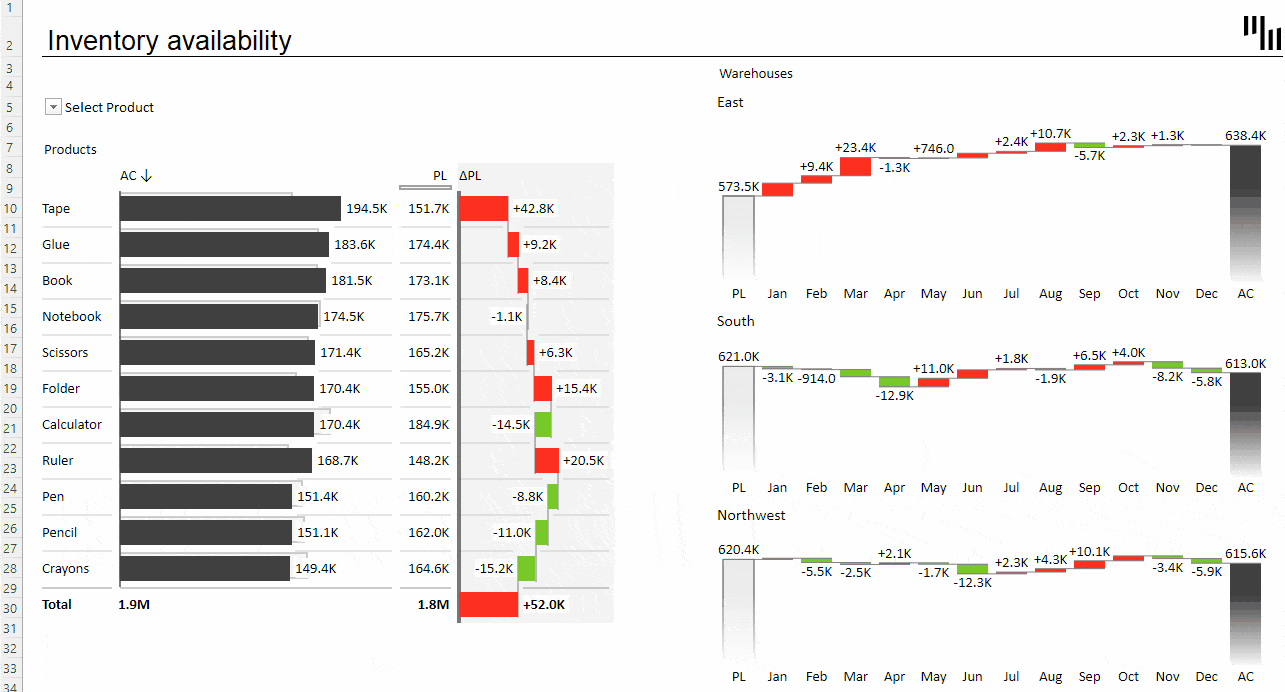
For a smoother inventory management experience, consider Zebra BI's Inventory Management template. This ready-made template offers a pre-structured format for entering and examining inventory data, plus some handy visualizations to help you act. Using a well-crafted template can save you time and make your inventory management system more efficient and effective.
With your inventory data inputted into the spreadsheet, you can tap into Excel's impressive features and functions to analyze and fine-tune your inventory management process, as we'll delve into in the sections that follow.
Key components of effective inventory management
Creating an efficient inventory management system with Excel involves focusing on several essential areas while emphasizing the use of Excel for inventory management. These areas include comprehensive tracking, purchasing management, shipping, order management, transfer management, and measurement and analysis.
Boost your inventory turnover by using Excel for in-depth tracking and seamless data collection. Utilize Excel for purchasing management, working with current datasets to plan purchases, connect with suppliers, and submit orders. Streamline shipping and generate tracking codes using Excel. Effortlessly track and manage new customer orders with Excel and improve transfer management for businesses with multiple locations.
Lastly, while managing these activities using Excel for inventory management, record data in the background and generate insightful reports at the end of each tracking period. Employ these metrics to identify potential issues, assess your strategy's cost-effectiveness, and make better decisions moving forward.
Analyzing inventory data in Excel
With your inventory data neatly arranged in a spreadsheet, you're all set to use Excel's built-in functions and features to examine your inventory's efficiency and profitability. Here's a rundown of the key steps:
- Calculate key inventory metrics
Use Excel formulas to calculate crucial metrics like inventory turnover, days sales of inventory, and gross margin return on investment (GMROI). These metrics shed light on inventory management efficiency and profitability, helping you pinpoint areas that could use some fine-tuning.
- Inventory turnover ratio: This metric reveals how frequently your inventory is sold and replenished over a specific period. A high inventory turnover rate implies robust sales and effective inventory management, while a low rate may signal overstocking or weak sales performance. The ideal inventory turnover ratio for most industries is typically between 5 and 10, indicating that companies should aim to sell and restock their inventory every one to two months
- Days on hand: This metric shows the average number of days it takes for your inventory to sell. It is generally recommended that shorter days on hand indicate quicker inventory turnover and less capital commitment.
- Gross margin return on investment (GMROI): This metric assesses the profitability of your inventory by comparing the gross margin generated from sales to the cost of goods sold (COGS). A higher GMROI indicates better profitability and more efficient inventory management.
- Create charts to visualize your inventory data
Visualizing your inventory data can help you get a handle on its composition and spot trends easier. Use Excel to whip up charts like bar charts for inventory levels, which showcase your inventory breakdown by product. Check out Zebra BI's Inventory Management template for examples of these visualizations.
Utilizing Excel's sorting and filtering tools
One of the standout benefits of Excel for inventory management is its mighty sorting and filtering tools. These nifty features help you swiftly analyze your inventory data, spot trends, and make well-informed decisions to fine-tune your inventory management process.
Here's how to use these tools to improve inventory management:
- Sort your inventory data: Excel's sorting function lets you reorganize your data based on particular criteria, such as arranging your inventory items by quantity, value, or alphabetical order. Sorting your data this way helps you quickly pinpoint top-selling or highest-value items in your inventory, enabling you to allocate resources more effectively and concentrate on high-performing products.
- Filter your inventory data: Excel's filtering feature allows you to display only certain rows in your dataset that meet specific criteria, temporarily hiding the rest. For instance, you can filter your inventory data to show only items with low stock levels or items from a specific product category. Filtering helps you zero in on particular aspects of your inventory and spot potential issues or opportunities that demand immediate attention.
By skillfully using Excel's sorting and filtering tools in your inventory management process, you can uncover valuable insights into your inventory's performance, identify trends, and find areas that could use some tweaking or optimization. Incorporating these tools into your everyday inventory management routine will empower you to better manage your inventory and, ultimately, boost your company's financial performance.
In other words, learning how to use Excel for inventory management not only keeps your inventory in tip-top shape but also sharpens your overall analytical skills.
The role of inventory in the balance sheet
As highlighted earlier, inventory holds considerable weight in a company's financial health, particularly on the balance sheet. A balance sheet captures a company's financial standing at a specific moment, offering insights into its assets, liabilities, and equity. Inventory is usually listed as a current asset on the balance sheet, and its valuation directly affects the accuracy of this financial statement.
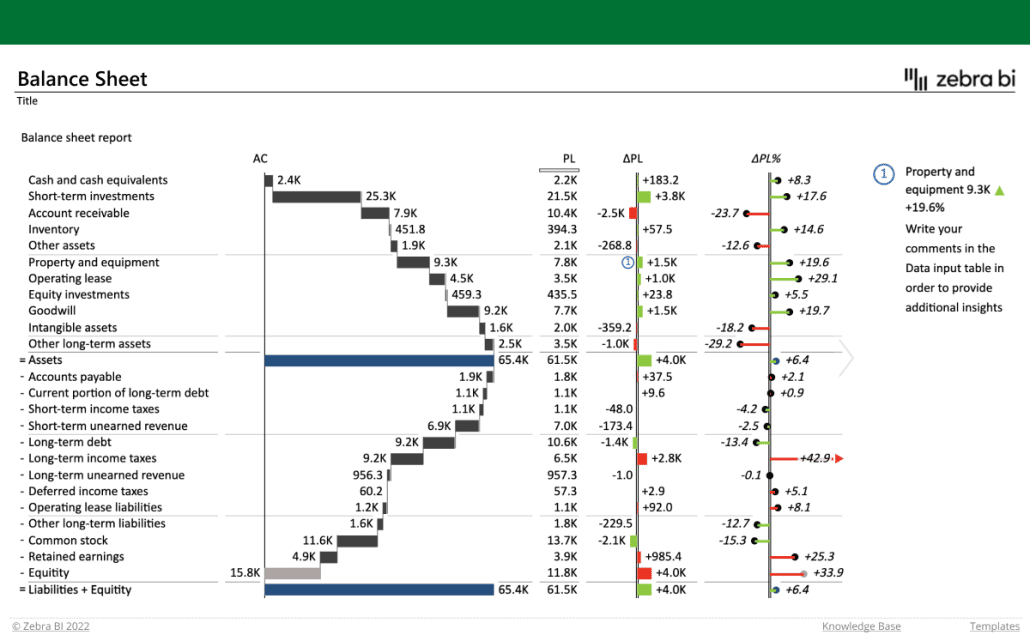
Grasping the role of inventory on the balance sheet helps you truly understand the significance of effective inventory management. This is crucial for maintaining an accurate and robust financial position. To assist, you might want to use Zebra BI's Balance Sheet template. It delivers a clear and detailed snapshot of your company's financial situation, including inventory's impact on the balance sheet.
By expertly managing your inventory in Excel and examining its influence on the balance sheet, you can uncover valuable insights into your company's financial health. This, in turn, enables you to make well-informed decisions to optimize your business's performance.
Conclusion
To wrap it up, learning how to use Excel for inventory management can be a game-changer for businesses aiming to simplify their inventory processes and enhance financial performance. Equipped with the powerful tools and techniques covered in this guide, you'll be well-prepared to efficiently manage your inventory, optimize cash flow, and make data-driven decisions that fuel your company's success.
Keep in mind that consistent and accurate inventory management is vital for business growth, and Excel stands as an indispensable tool to help you accomplish this objective.
Boost Your Inventory Management with Zebra BI
Embrace Excel's capabilities and elevate your inventory management in 2024 and beyond with our step-by-step instructional file for Zebra BI for Office.