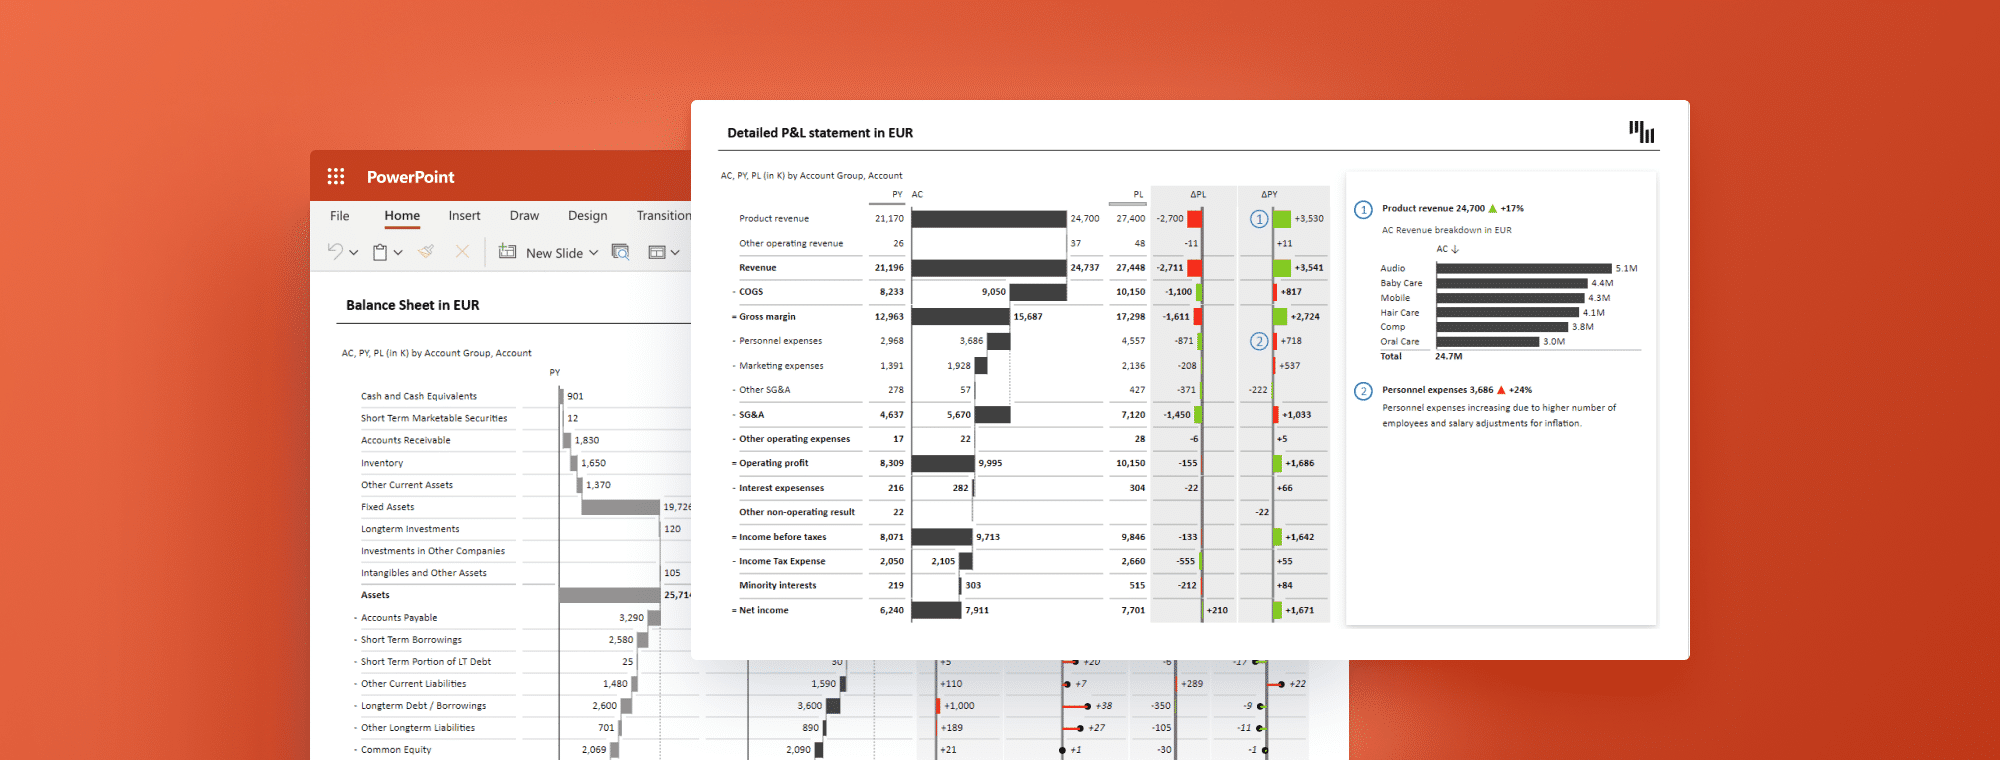
How to Prepare Financial Statements in PowerPoint
Creating accurate and visually appealing financial statements is crucial for effective communication with stakeholders. One way to accomplish this task is by using PowerPoint. PowerPoint is a powerful tool that can allow you to create sophisticated financial statements with ease. In this article, we will guide you on how to prepare financial statements in PowerPoint by explaining the main components of financial statements, how to set up your PowerPoint presentation, and how to create the income statement slide and balance sheet slide.
Understanding Financial Statements
Before diving into creating financial statements in PowerPoint, it’s important to understand their main components.
Financial statements are formal documents that show the financial activities of a business. Typically, financial statements include an income statement, a balance sheet, and a statement of cash flows.
The income statement shows the revenue and expenses incurred during a specific period and the resulting net income or loss. The balance sheet displays a company's financial position by showing assets, liabilities, and equity. The statement of cash flows indicates the inflow and outflow of cash.
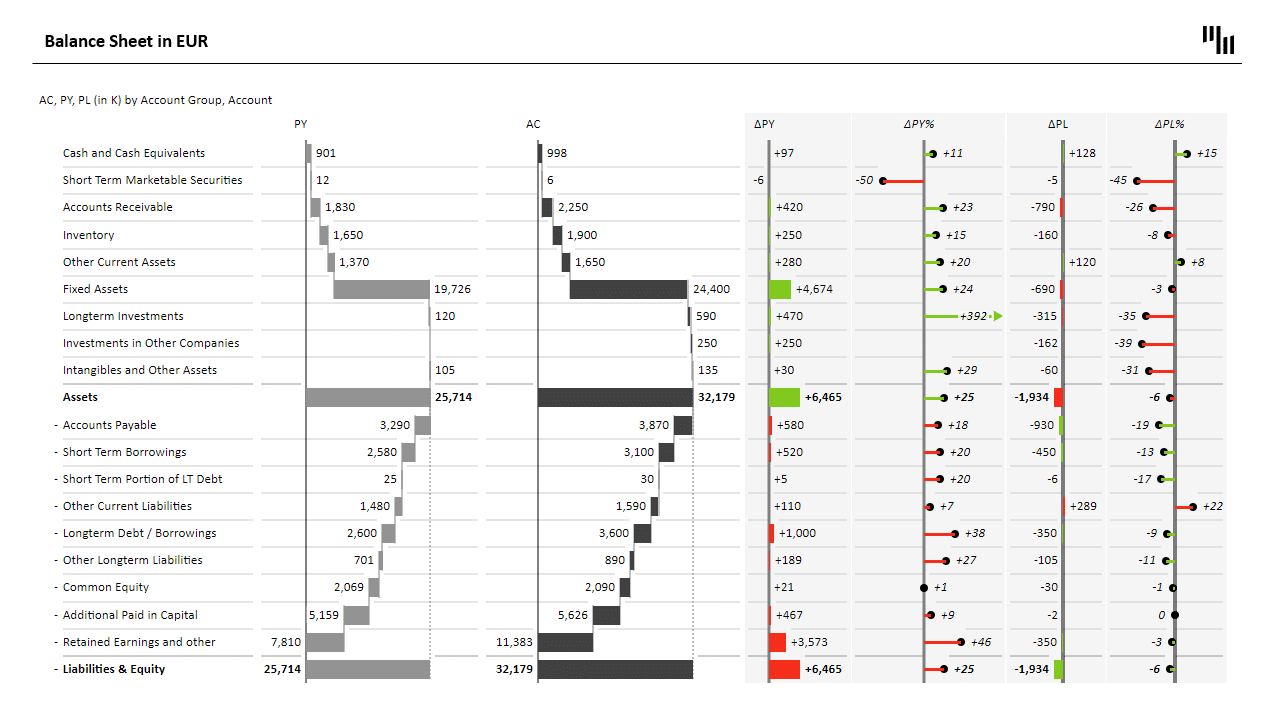
An example of a Balance Sheet in PowerPoint:
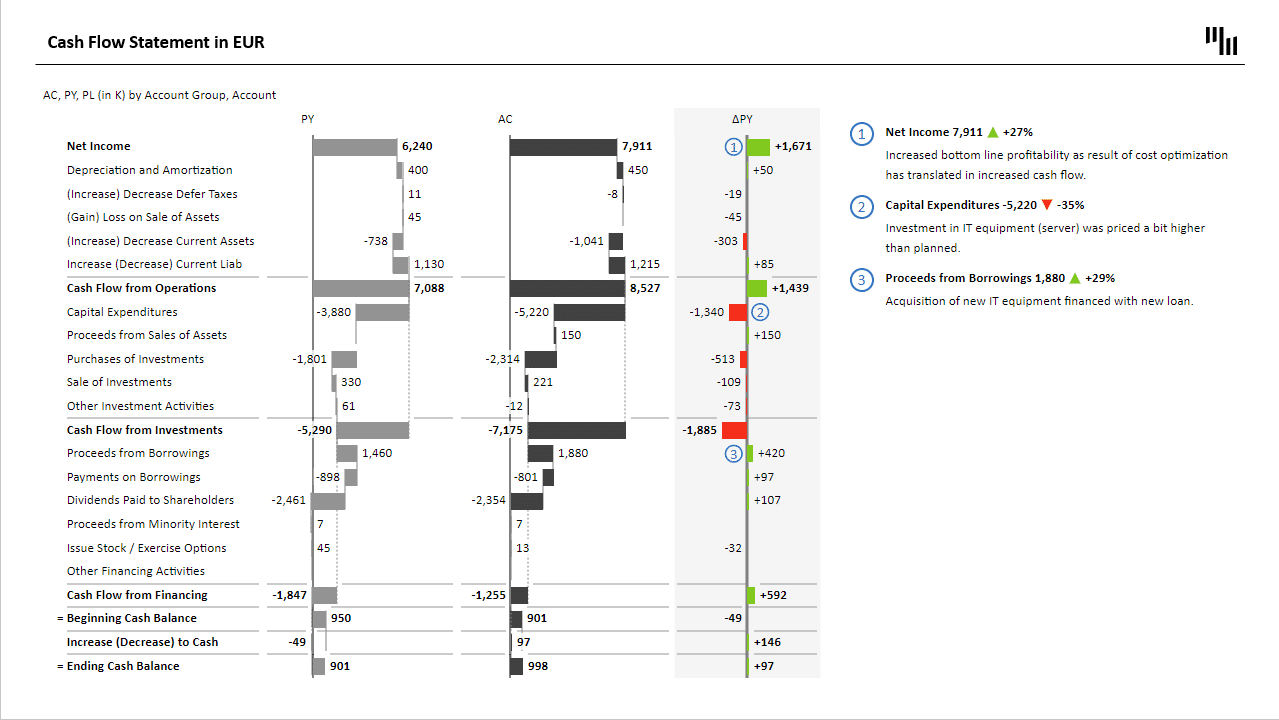
An example of a Cash Flow Statement in PowerPoint
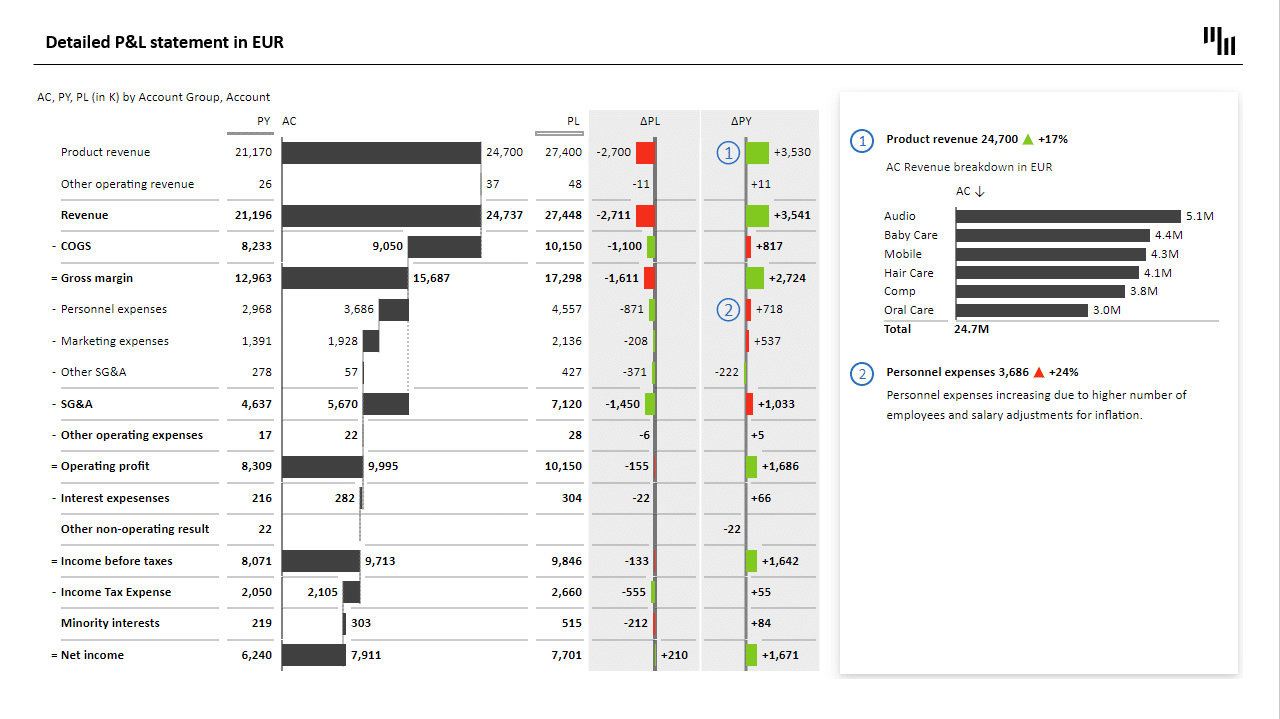
An example of a P&L (or Income) Statement in PowerPoint:
Download the free PowerPoint template from the Zebra BI library: Business Plan PowerPoint Template
Financial statements are essential for businesses to keep track of their financial health. They provide a snapshot of the company's financial status at a specific point in time. This information is crucial for businesses to make informed decisions about their operations, investments, and growth strategies.
Components of Financial Statements
The income statement usually has two main components: revenue and expenses. Revenue represents the money received from selling goods or services. Expenses, on the other hand, are the costs incurred when generating revenue. They can be categorized as operating or non-operating expenses. Operating expenses are expenses incurred while producing goods or services, while non-operating expenses are costs incurred from other activities such as interest, taxes, and depreciation.
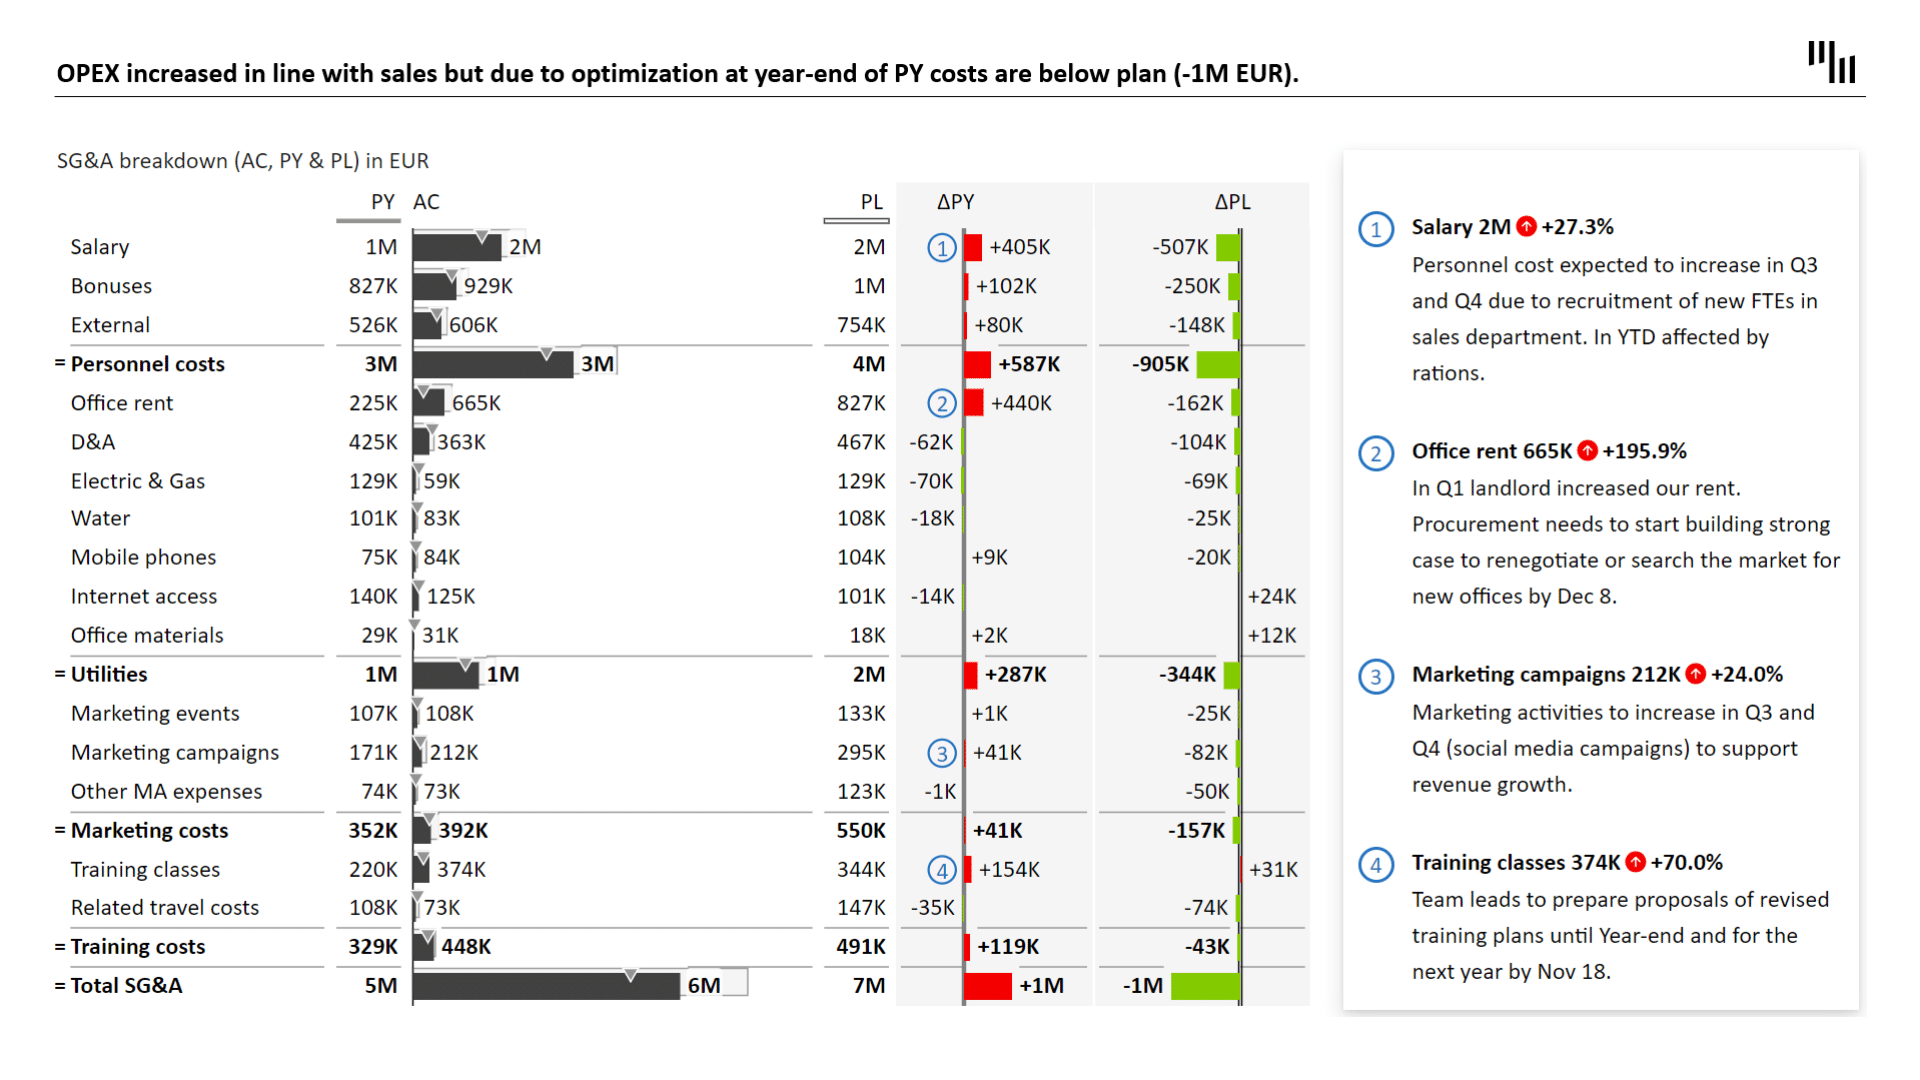
Download the free PowerPoint template: OPEX and Marketing Budget Report
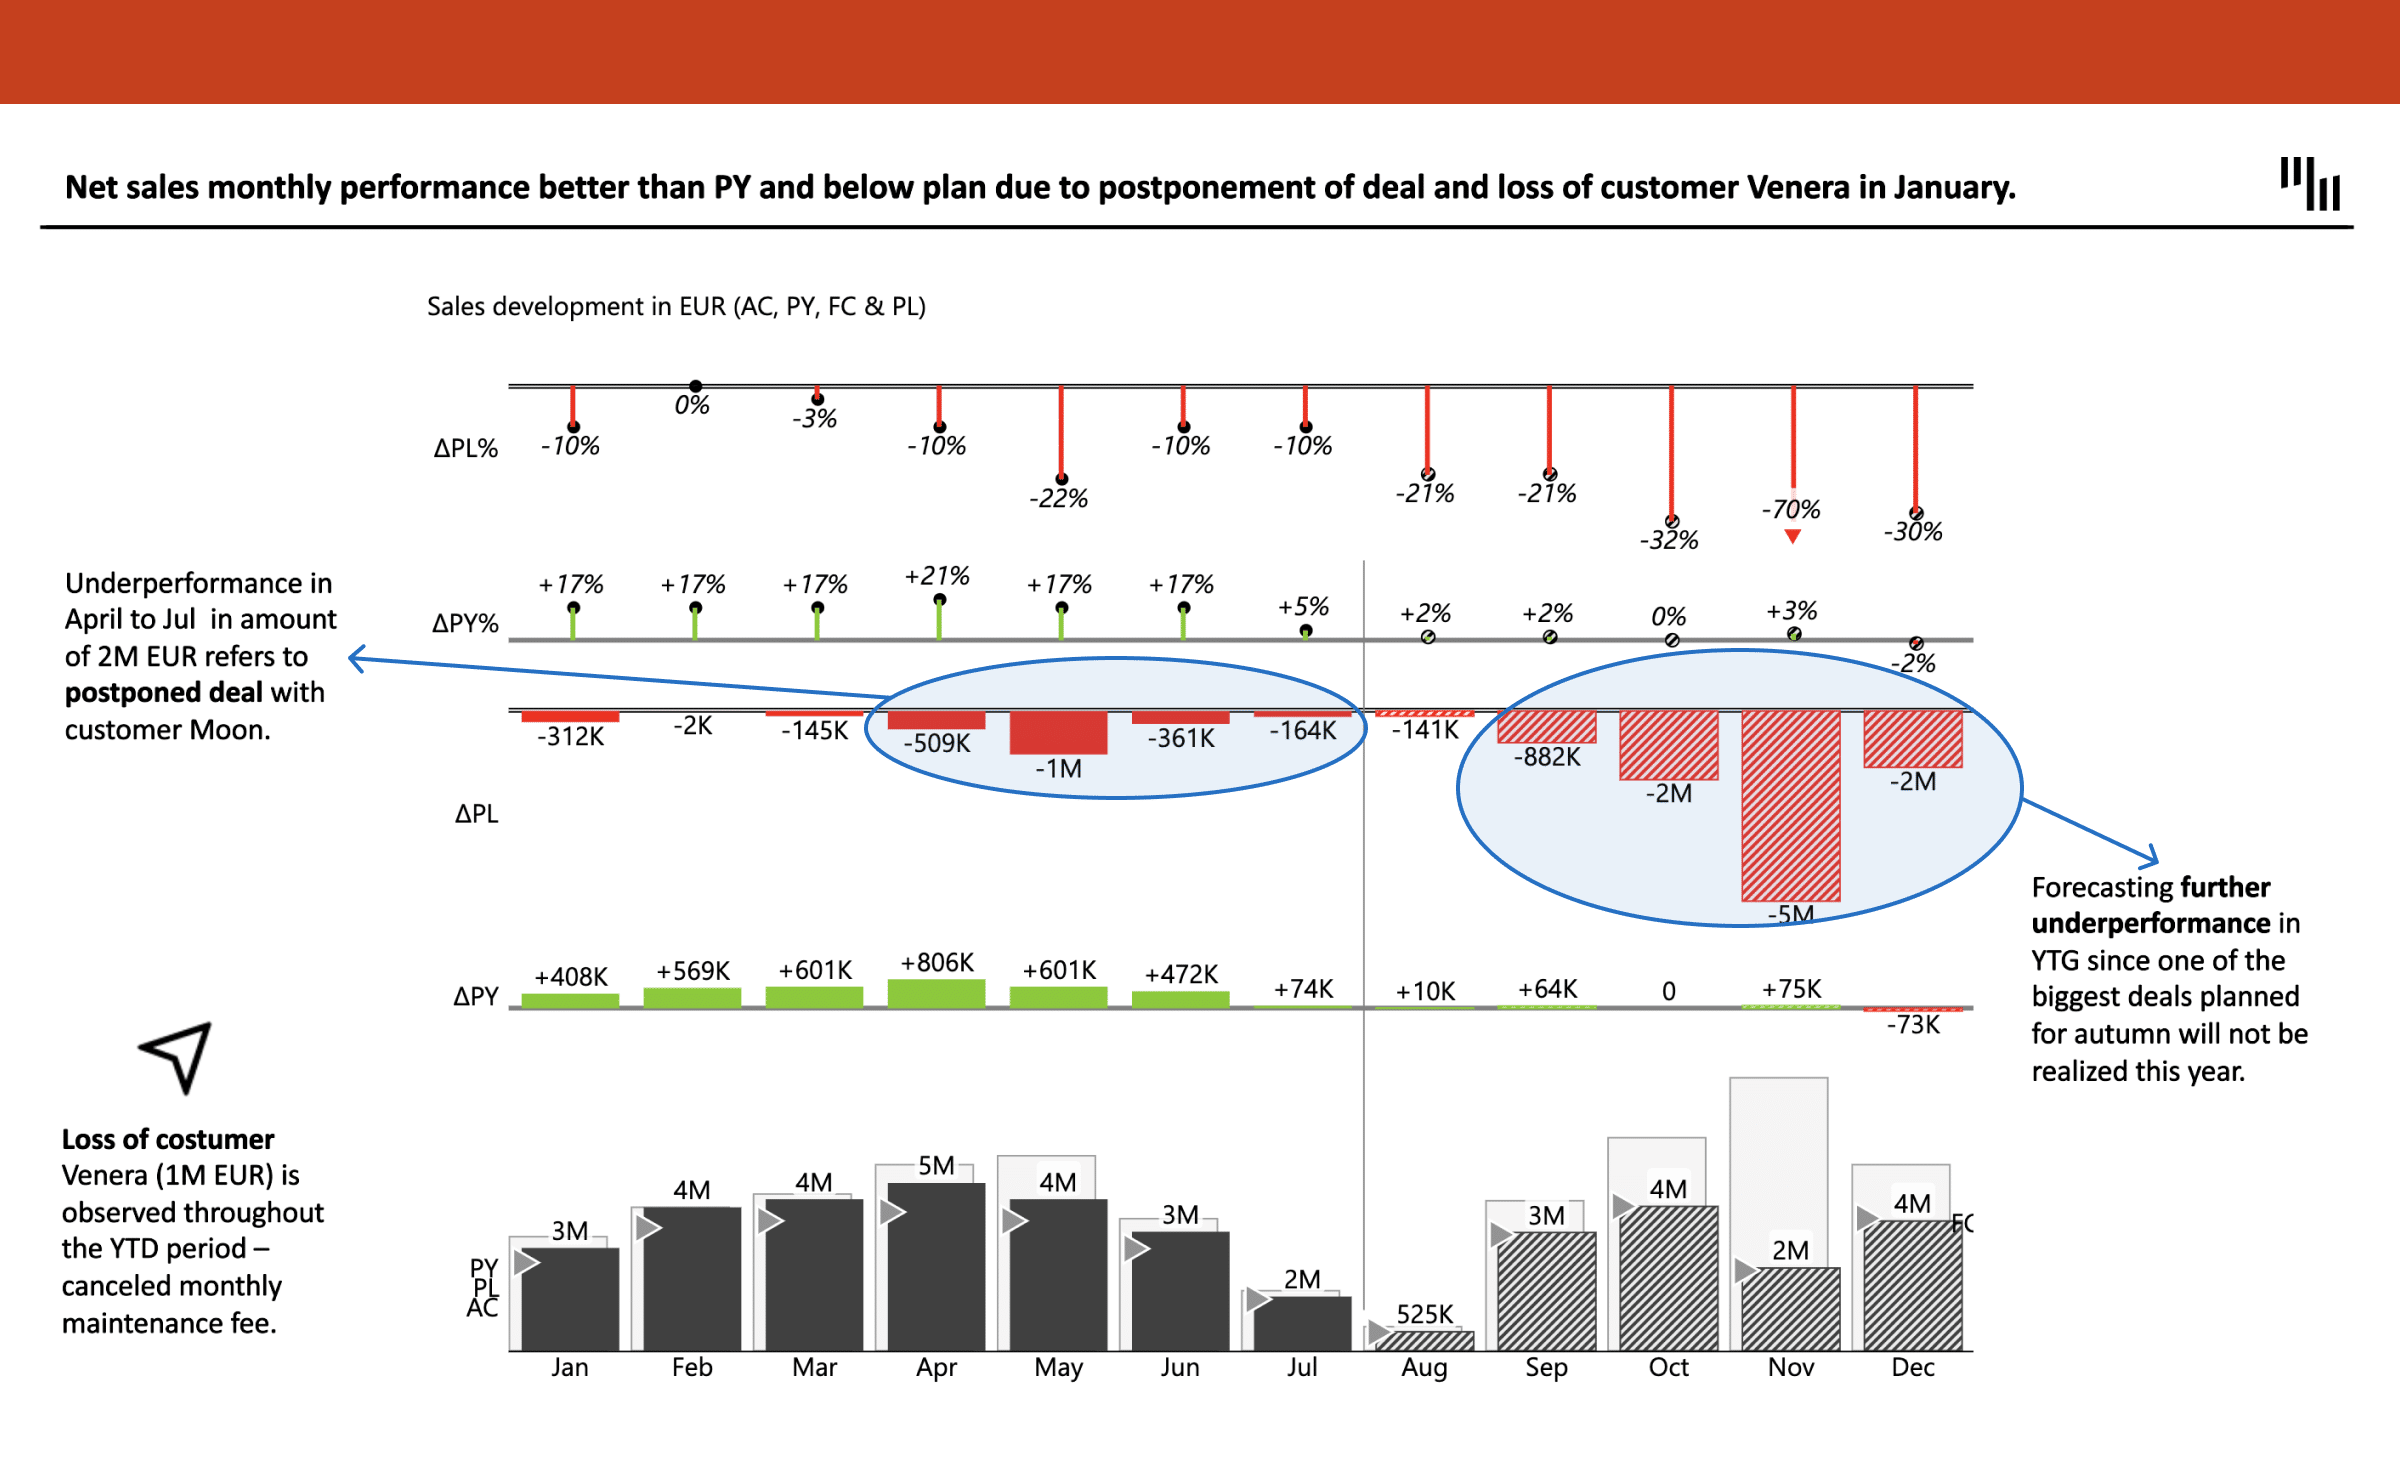
Download the free template: Sales Report PowerPoint Charts
The balance sheet displays three types of accounts: assets, liabilities, and equity. Assets are the resources owned by a company. They can be classified into current or long-term assets. Current assets are assets that can be converted into cash within a year, while long-term assets are those that will last longer than a year. Liabilities, on the other hand, represent the obligations of a company. They can also be classified as current or long-term liabilities. Current liabilities are obligations that must be paid within a year, while long-term liabilities are those that will be paid back after a year. Lastly, equity represents the residual interest in the assets after deducting liabilities.
Understanding the different components of financial statements is crucial for businesses to track their financial status accurately. It allows them to identify areas of improvement and make informed decisions about their future financial strategies.
Importance of Accurate Financial Statements
It’s important to prepare accurate financial statements as they provide stakeholders with relevant information on the company's financial position. Financial statements help stakeholders make informed decisions about a company, such as investing or lending money. Additionally, financial statements are also required by regulatory bodies such as the Securities and Exchange Commission. Inaccurate financial statements can have legal ramifications and damage the company's reputation.
Accurate financial statements are also crucial for businesses to attract potential investors. Investors rely on financial statements to make informed decisions about investing in a company. Inaccurate financial statements can lead to a loss of investor confidence and negatively impact the company's ability to secure funding for future growth.
Setting Up Your PowerPoint Presentation
Understanding the components of financial statements is crucial when it comes to creating an effective PowerPoint presentation. Financial statements provide a snapshot of a company’s financial health, and presenting them in a clear and concise manner is essential to conveying important information to stakeholders.
Download the free template: Financial Management Report in PowerPoint
Bonus:
- How to Design Income Statements in Excel
- Top 3 Financial Statements in Excel: Income Statement, Balance Sheet & Cash Flow
Once you have a solid understanding of financial statements, you can start setting up your PowerPoint presentation. Here are a few tips on how to create an effective financial statement PowerPoint presentation:
Choosing the Right Template
Choosing the right template is the first step in creating an effective financial statement PowerPoint presentation. There are various templates you can choose from, including financial report templates, budget templates, and business plan templates. It’s important to choose a template that suits the purpose of your presentation. For example, if you’re presenting a financial report, choose a template that is specifically designed for financial reports. Ensure that the template you choose has a professional look and feel, as financial statements are formal documents.
Zebra BI templates for PowerPoint are all crafted in compliance with IBCS standards to ensure the best possible transfer of relevant information; this is what we call meaningful insights. Learn more on our webpage: Zebra BI for PowerPoint.
Customizing Your Slide Design
Customizing your slide design is the next step in creating an effective financial statement PowerPoint presentation. Adding charts, tables, and graphs can help you present financial data visually, making it easier for your audience to understand. PowerPoint has various chart options that make it easier to present financial data in a visual format. Make sure to use different colors and fonts to make your slides stand out and easier to read. However, be careful not to overdo it with the design, as too many colors and fonts can make the presentation look cluttered and unprofessional.
With the use of Zebra BI visuals (Charts and Tables), consistency in design and style is easy. Set up your style once, and all your new visuals will have the same style thereafter. Standardization and consistency are key to effective reporting and presentation.
Organizing Your Slides
Organizing your slides is essential to creating a clear and concise financial statement PowerPoint presentation. Group your slides into sections, starting with an introduction slide that overviews the company’s financial position. Then, move on to the income statement, followed by the balance sheet and the statement of cash flows. Use section headers to guide your readers through the presentation and make it easier for them to understand the information presented.
Overall, creating an effective financial statement PowerPoint presentation requires a combination of understanding financial statements, choosing the right template, customizing your slide design, and organizing your slides. By following these tips, you can create a presentation that effectively communicates important financial information to your audience.
Creating the Income Statement Slide
The income statement is a crucial component of financial statements that provides valuable insights into a company's financial performance. It shows the revenue earned and expenses incurred during a specific period, ultimately calculating the net income or loss. In this article, we will discuss how to create an income statement slide that effectively communicates this information.
Inputting Revenue and Expense Data
The first step in creating an income statement slide is to input the revenue and expense data into PowerPoint. You can use tables or charts to display the data, depending on your preference and the amount of information you want to convey. However, it is essential to ensure that your data is accurate and up-to-date and that your financial statement is reliable. Inaccurate data can lead to incorrect conclusions and misinformed decisions.
When inputting the revenue and expense data, it is also a good idea to provide context and additional information, such as the period covered by the statement, any significant events or transactions that impacted the results, and any relevant industry benchmarks or comparisons.
Calculating Net Income
The next step in creating an income statement slide is to calculate the net income. This is done by subtracting the total expenses from the total revenue. Net income can be positive or negative, depending on the revenue and expenses incurred during the period. It is essential to provide an explanation of the net income figure and any significant changes from previous periods.
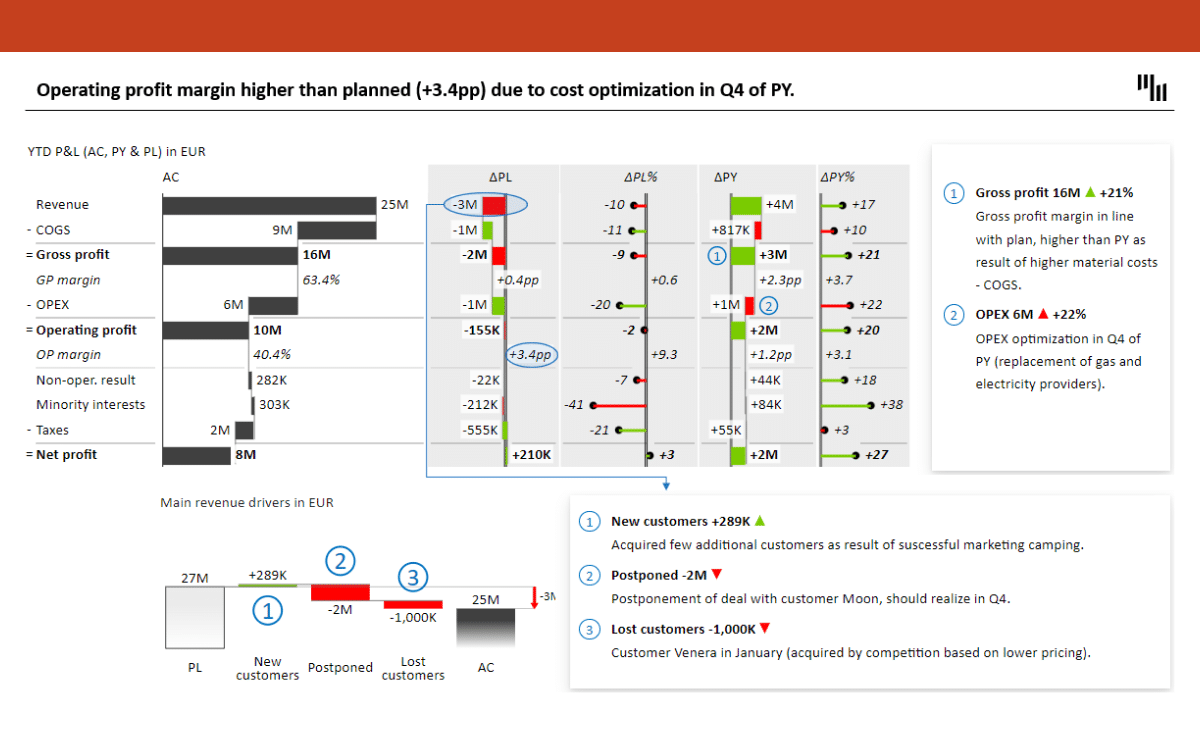
You may want to use Zebra BI Tables with integrated waterfall charts to showcase how your net income is calculated, i.e., how revenue positively contributes to the bottom line and how expenses decrease the profit. In that way, the income statement will also be understandable to people who don’t have an extensive financial background.
Additionally, it is crucial to highlight any non-operating income or expenses, such as gains or losses from the sale of assets, interest income, or interest expenses. These items can significantly impact the net income figure and provide valuable insights into the company's financial performance.
Formatting the Income Statement
Once you have inputted the revenue and expense data and calculated the net income, the next step is to format the income statement. This involves adding color and company branding to make the slide visually appealing and consistent with your overall presentation. It is essential to ensure that the formatting is consistent throughout your presentation, including font size, color, and style.
Formatting Tables and Charts is easy with Zebra BI; use Style Editor and be sure that all financial statements follow the same styling.
Furthermore, it is crucial to ensure that the income statement has a professional look and feel. This can be achieved by using clear and concise language, avoiding jargon or technical terms that may be unfamiliar to your audience, and providing explanations or definitions for any terms or concepts that may be unclear.
In conclusion, creating an income statement slide requires careful attention to detail and a thorough understanding of financial statements. By inputting accurate data, calculating net income, and formatting the statement effectively, you can create a slide that effectively communicates your company's financial performance and provides valuable insights into its operations.
Developing the Balance Sheet Slide
The balance sheet is a crucial component of financial statements that provides a snapshot of your company's financial position at a specific point in time. It includes a list of assets, liabilities, and equity. Here's how to develop a balance sheet slide:
Listing Assets, Liabilities, and Equity
When listing assets, consider including both tangible and intangible assets such as property, equipment, patents, and trademarks. Liabilities can include both short-term and long-term debts, such as loans and accounts payable. Equity represents the residual value of assets minus liabilities, including items such as retained earnings and common stock.
When creating your balance sheet slide in PowerPoint, you can use tables or charts to make the data easier to read. Remember to categorize the assets and liabilities into current and long-term categories, as discussed earlier.
With Zebra BI, you can expand and collapse hierarchical tables in PowerPoint (in the case of a balance sheet), even during the presentation mode.
Balancing the Balance Sheet
One of the most important aspects of the balance sheet is ensuring that it balances. The total assets must always equal the total liabilities and equity. If the balance sheet doesn't balance, check the figures and adjust them accordingly. This is a critical step in ensuring the accuracy and reliability of your financial statements.
Notice how Assets and Liabilities balance out in the Zebra BI Table with the integrated chart and automatically calculated variances.
Formatting the Balance Sheet
Like the income statement, the balance sheet should have a professional look and feel. Use colors and fonts that match your company branding. Make sure that your formatting is consistent throughout the presentation. Consider including a brief explanation of each item on the balance sheet to help your audience understand the significance of each item and how it contributes to your company's financial position.
It's important to note that the balance sheet is just one component of financial statements. To gain a complete understanding of your company's financial health, it's essential to review all financial statements, including the income statement and cash flow statement. By presenting a well-formatted and accurate balance sheet slide, you can help your audience gain a better understanding of your company's financial position and make informed decisions based on this information.
Conclusion
Creating financial statements in PowerPoint can be a daunting task, but it doesn't have to be. Understanding the components of financial statements, as well as how to set up your PowerPoint presentation, can make the process easier. By following the steps outlined in this article, you can create visually appealing and accurate financial statements that can help your stakeholders make informed decisions.