Top 3 Financial Statements in Excel: Income Statement, Balance Sheet & Cash Flow
Financial reporting is a critical component of managing a business's finances. To gain insight into their financial health and progress, most companies must prepare three essential reports – income statement, balance sheet, and cash flow statement. Read on to explore them one by one and learn how to create these financial statements in Excel easily.
But before we dive in, let's take a look at who they mainly cater to.
Audience for your reports
Income statements, cash flow, and balance sheet reports are useful in many business contexts. Typically, they are intended for the following groups:
- Investors. Investors use financial statements to evaluate a company's financial health, profitability, and potential for growth.
- Creditors. Creditors, such as banks and other lending institutions, use financial statements to evaluate risk, a company's creditworthiness, and its ability to repay loans.
- Regulators. Regulatory agencies in most countries require publicly traded companies to file financial statements on a regular basis. These agencies use financial statements to ensure that companies comply with accounting and reporting standards.
- Management. Company management cannot fly blind, and they use financial statements to monitor the company's financial performance and make strategic decisions. These reports provide the tools needed to assess how effective their strategies are and identify the areas for improvement.
Now that we've covered the main target groups let's dive into the financial statements individually.
Get Your Financial Statement Templates Now
Jump into action with our free templates bundle for Income Statement, Balance Sheet, and Cash Flow. Streamlined, efficient financial reporting starts here.
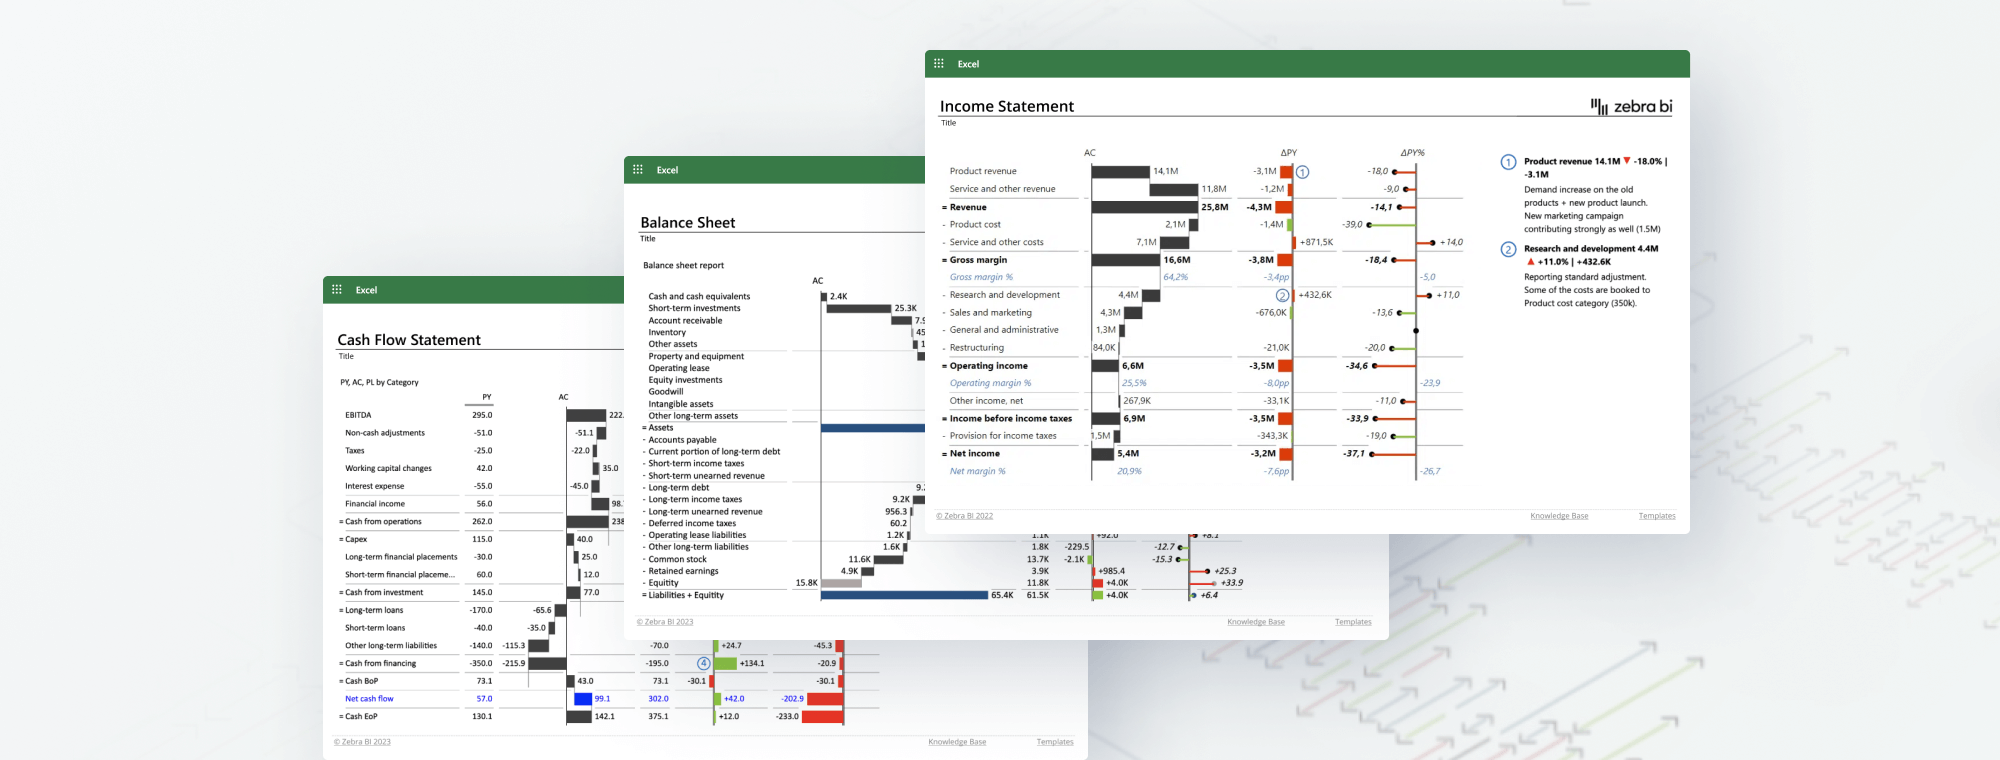
1. Income statement
An income statement is also known as a profit and loss statement and reports revenues and expenses over a specific period of time, typically a quarter or a year. It shows whether a company has made a profit or incurred a loss during the period covered by the statement.
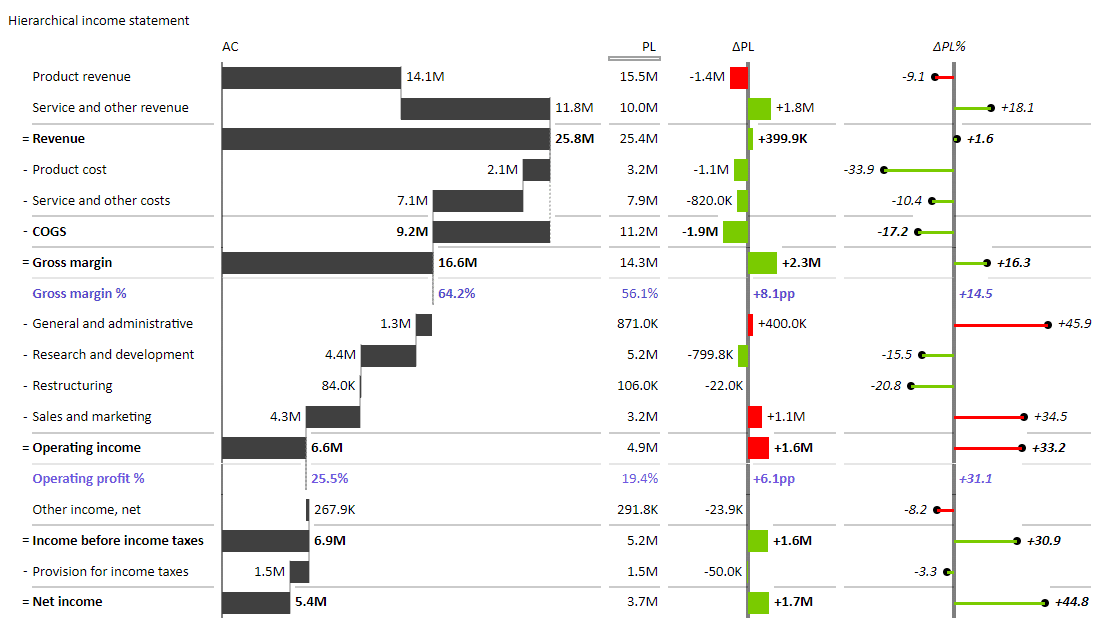
An income statement contains most KPIs you want to track.
First, we have revenue and cost of goods sold (COGS). They represent the revenue from services and products and the direct costs associated with producing the goods or services sold during the period. The gross margin is the difference between revenue and COGS and shows the profit earned from the sale of goods or services before deducting the operating expenses, such as general and administrative expenses, those from research and development, restructuring, and sales and marketing.
Next, we have operating income (the difference between the gross margin and operating expenses) and other income and expenses. The final item is net income, which shows the profit or loss earned by the company during the period after deducting all expenses, including taxes.
Elements of an effective income statement
To communicate your information clearly, you should focus on several elements when designing your income statement, starting with hierarchy. This means your report should be structured to display how different items contribute to your numbers clearly. We suggest you also rely on subtotals, essentially calculations of your rows.
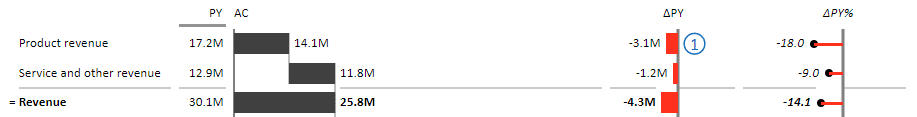
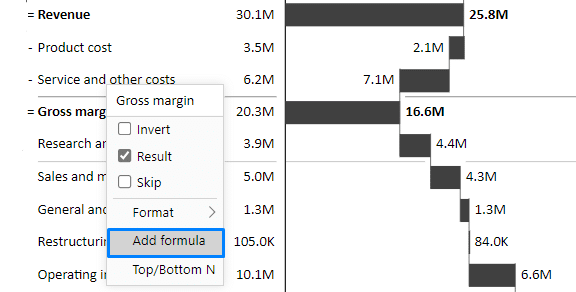
In the example below, you can see that the Cost of goods sold item is a total of two separate cost items: product cost and service & other costs.

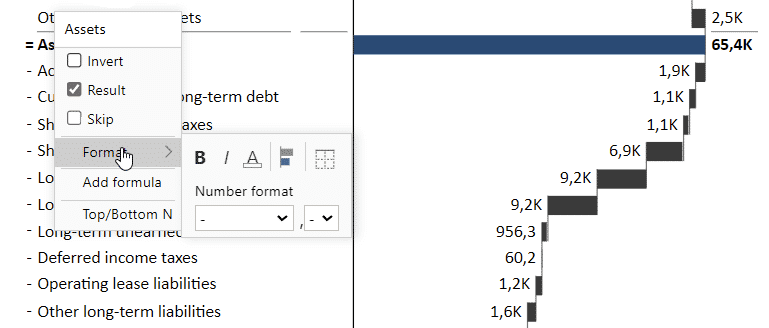
Another feature that comes in handy is Results. While similar to subtotals, they not only aggregate existing items but also act as calculations. Zebra BI Tables visual allows you to apply different calculations on rows. By right-clicking on any row, you can mark the row as a Result or Invert. The result defines a total of items, while Invert subtracts the item in the income statement.
The gross margin row in the report is an example of the Result feature and is a calculation of revenue minus the cost of goods sold.

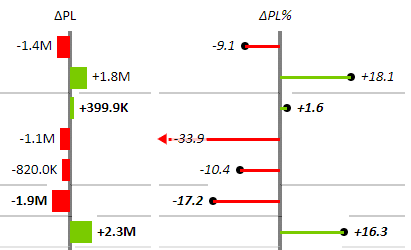
Variances are another feature that takes your income statements to the next level. Looking at the data is not very helpful if you're missing valuable context. Variances show how your actual results stack against your plans or the previous year's results. Zebra BI visuals automatically calculate the variances between different measures so that you know exactly where you stand at a single glance.
The best part is that building such income statements can be super simple. See for yourself. 👇
Creating an income statement
You can easily make great-looking and engaging financial statements in Excel using Zebra BI for Office. The add-ins allow you to quickly replace difficult-to-read data tables with visual reports that highlight crucial information and present a compelling narrative.
Inserting the Zebra BI for Office add-ins
Two Zebra BI add-ins are available for Excel: Zebra BI Charts for Office and Zebra BI Tables for Office. Both add-ins are available on Microsoft AppSource and work in Excel or PowerPoint. They are available as either a free version for personal use or a paid license for professional use.
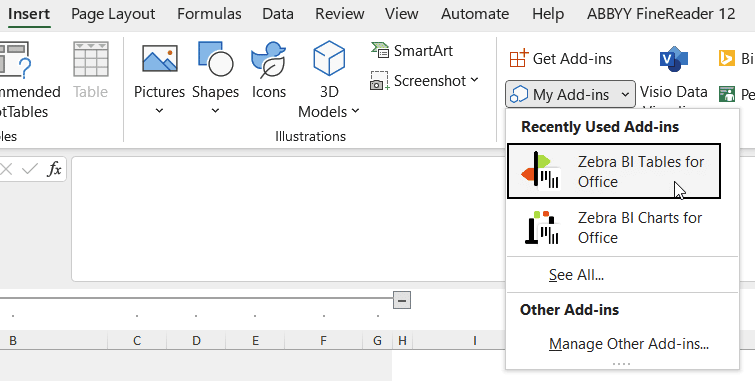
To insert the add-ins into Excel, go to your Excel > Insert > Get Add-ins > search for "Zebra" > click Add, next to Zebra BI Tables for Office and/or Zebra BI Charts for Office.
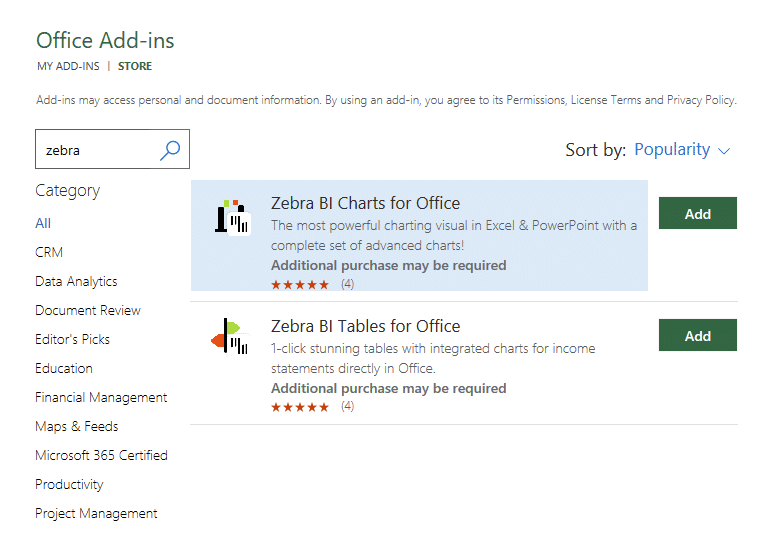
Once the add-in is installed, you simply need to click on the data and then insert the add-in. You do this by selecting Insert on your tool ribbon and then clicking the My Add-ins button. Select the desired add-in from the available options.
Once you've inserted the add-in, let's create an effective income statement.
Designing a next-level income statement
Zebra BI for Office add-ins are just what you need to design effective financial statements in Excel quickly. They provide all the functionalities you need for actionable income statements, such as waterfall charts for showing contributions, calculations, subtotals, dynamic comments, and automatic variance calculations.
Take a look at how easy it is to create an income statement using Zebra BI for Office.
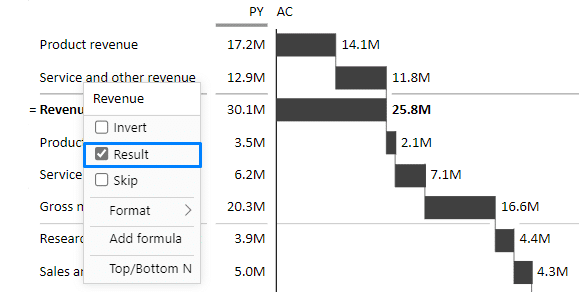
The video showcases several benefits of Zebra BI for Office that make it a particularly good choice for income statements. Even though the source table here is set up as a single category, the visual allows you to set custom calculations on rows (Results), which causes a hierarchical appearance of data.
In this example, you can see that the revenue comprises product and service revenue. It is only set as a result to be included as a subtotal, but it does not contribute to the final result. You can easily do this by right-clicking on a value and setting it as a Result.
Similarly, you can invert the negative items that represent costs. This way, their values are deducted instead of added. To do this, just right-click on the relevant rows and click Invert.
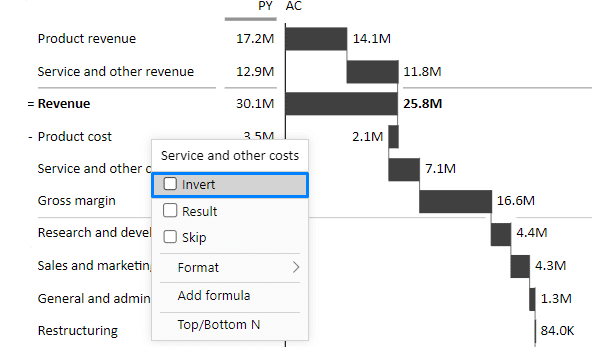
In the report, the inverted values are marked with a minus (-) sign in front to indicate that they represent deductions.
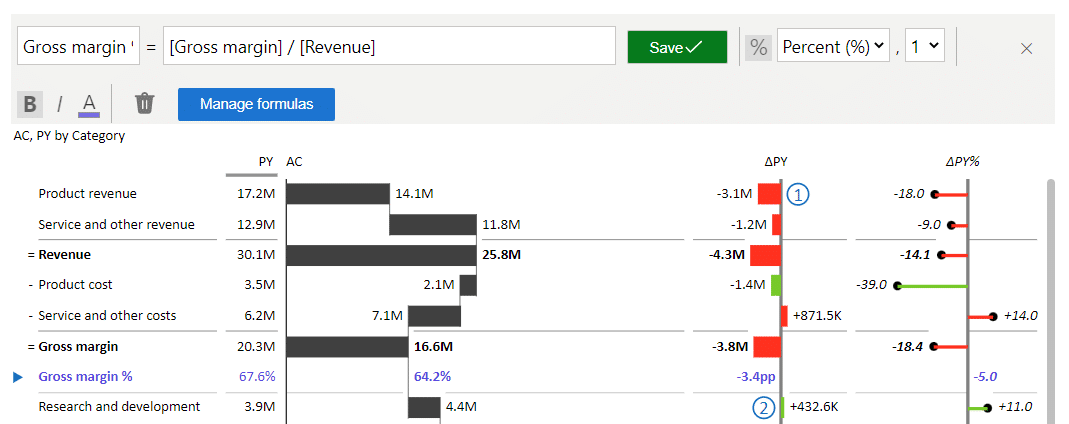
Custom formulas are another great feature that will help you create advanced reports. The gross margin expressed in percentage, for instance, is a calculation made on the fly within the report. All it takes is for you to right-click on the visual and select the Add formula option in the menu.
This prompts the Formula Manager to open up so you can easily insert the formula you need.
Ready to try it yourself?
Create Your Income Statement Report Instantly
Simplify your financial analysis with our ready-to-use Income Statement template. Tailored for accuracy and efficiency.
The next financial statement we'll focus on is ... 🥁🥁
2. Balance sheet
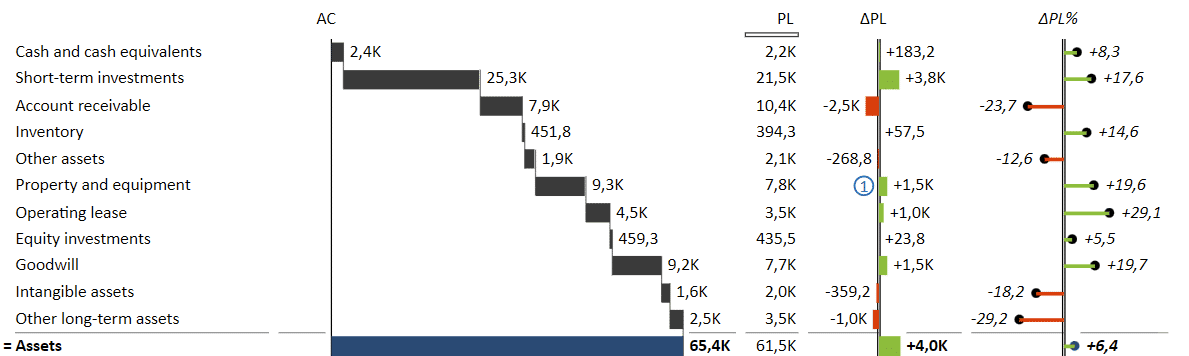
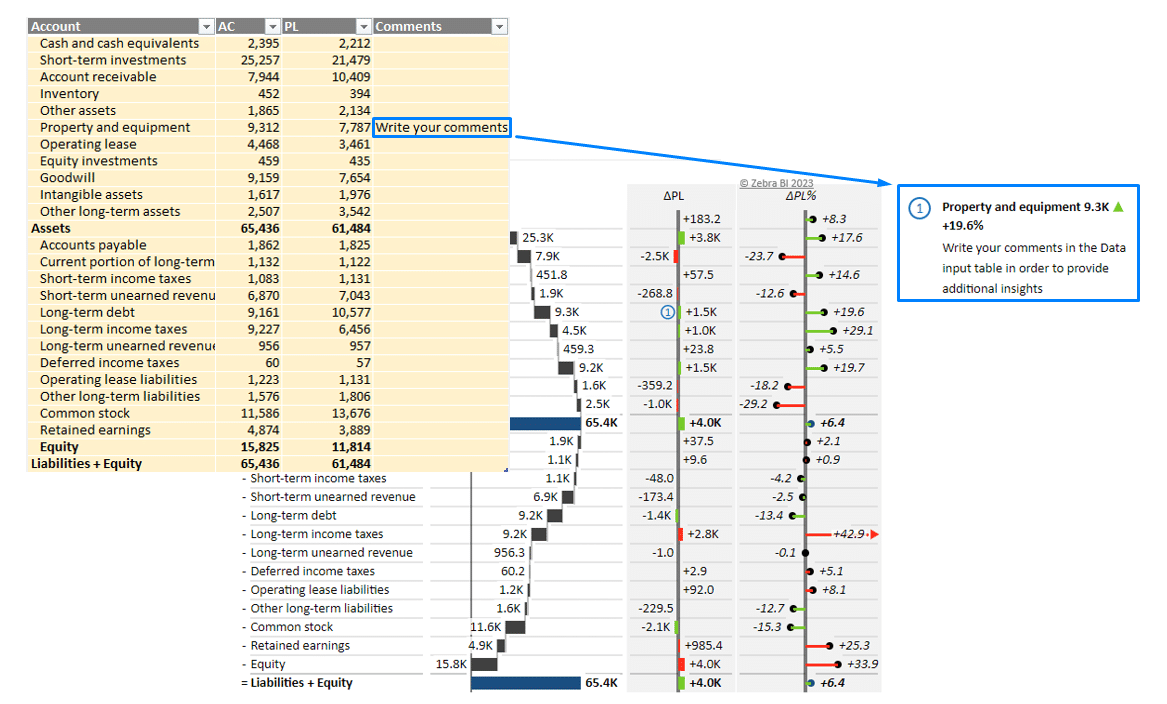
A balance sheet presents a snapshot of a company's financial position at a particular point in time by displaying information about a company's assets, liabilities, and equity.
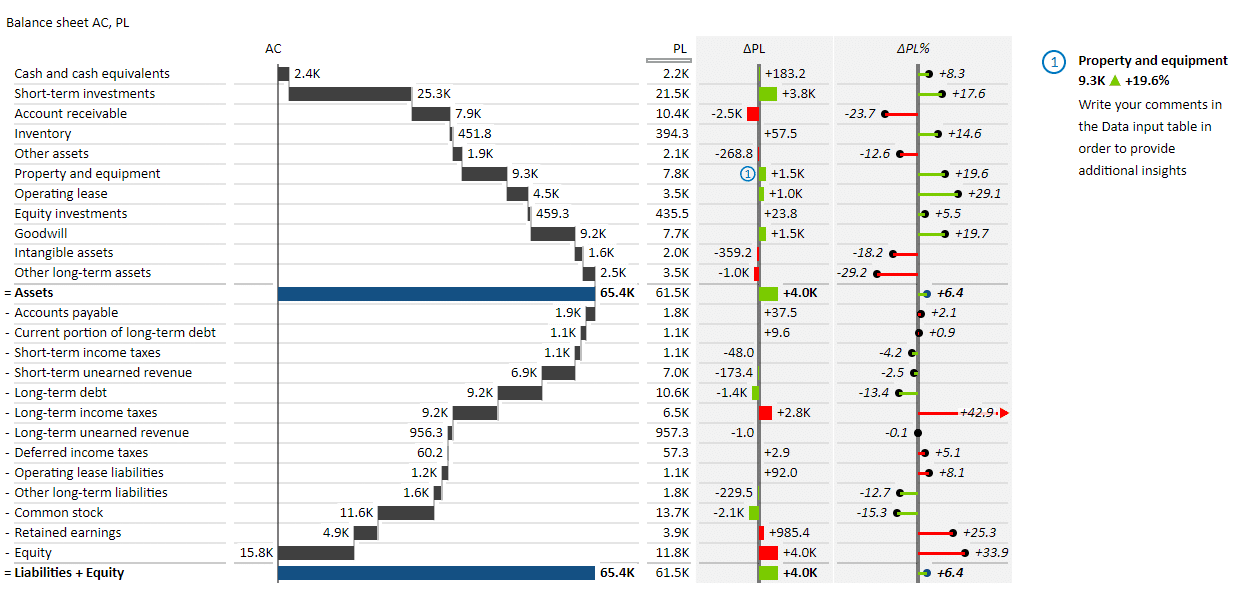
Assets are owned resources, such as cash and cash equivalents, accounts receivable, inventory, property, plant and equipment, and investments.
Liabilities are a company's obligations towards suppliers, lenders, and employees. Examples of liabilities include accounts payable, loans, bonds, and accrued expenses.
Equity is the residual interest in the assets of the company after deducting liabilities. Equity includes common stock, retained earnings, and other comprehensive income.
The balance sheet provides important information about a company's liquidity, solvency, and financial flexibility. It is used by investors, creditors, and management to evaluate a company's financial health and decide about its future.
The main components of a balance sheet
A good balance sheet will visually display how individual items make up the categories of assets, liabilities, and equity. Using waterfall charts is the perfect way to achieve this.
Just like the income statement above, this report also uses subtotals and results to great effect. It also uses variances to provide valuable context, not just bare numbers.
Building your own balance sheet statement
With Zebra BI for Office, a balance sheet statement is just as easy to create as an income statement. Once you’ve inserted the visuals, it takes a couple of clicks. Check out the video below & see for yourself:
The main thing you'll notice in this statement is the heavy use of the waterfall chart. Essentially, the entire chart is a waterfall chart since you want to see how individual items contributed to the final result.
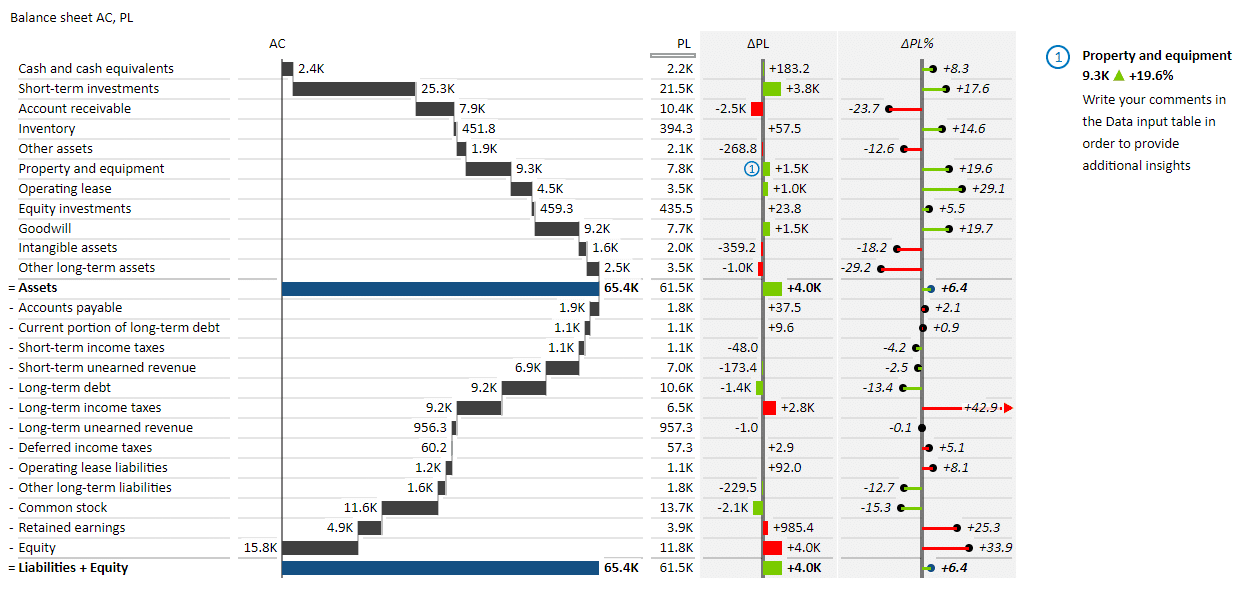
This balance sheet also uses inverted values and subtotals to showcase how assets equal liabilities and equity. The chart includes absolute and relative variances to show how actual values differ from the plan clearly.
Another thing to note is using the formatting options to highlight individual elements. The two most important values (assets and liabilities + equity) are highlighted in blue to stand out for easier reading. Zebra BI makes it easy to change the color of individual bars by making formatting options accessible from the right-click menu.
All the statements also include dynamic comments, and here's why. Financial reports are typically delivered to the top management. Having comments displayed in the report allows them to understand what is going on with their company quickly. That's why comments are a crucial part of your interactive data story, and you should include them whenever possible and necessary.
Creating such comments is super simple. Just add a column to your data table, name it "Comments," and start typing your observations into the rows next to the relevant items. The comments will appear in your visual automatically.
Create a balance sheet just like this one
Elevate your financial reporting with our intuitive Balance Sheet template. Quick to implement, easy to master.
On to the last financial statement, Excel edition.
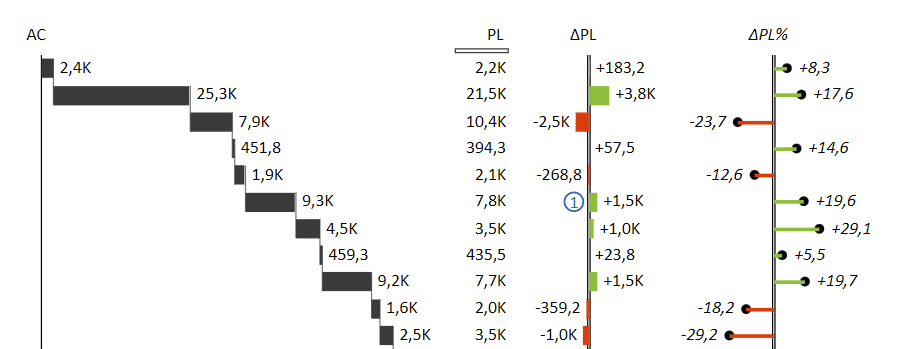
3. Cash flow statement
The cash flow statement shows how a company's cash and cash equivalents have changed over a specific period of time. It provides invaluable insight into a company's liquidity and ability to generate cash flow.
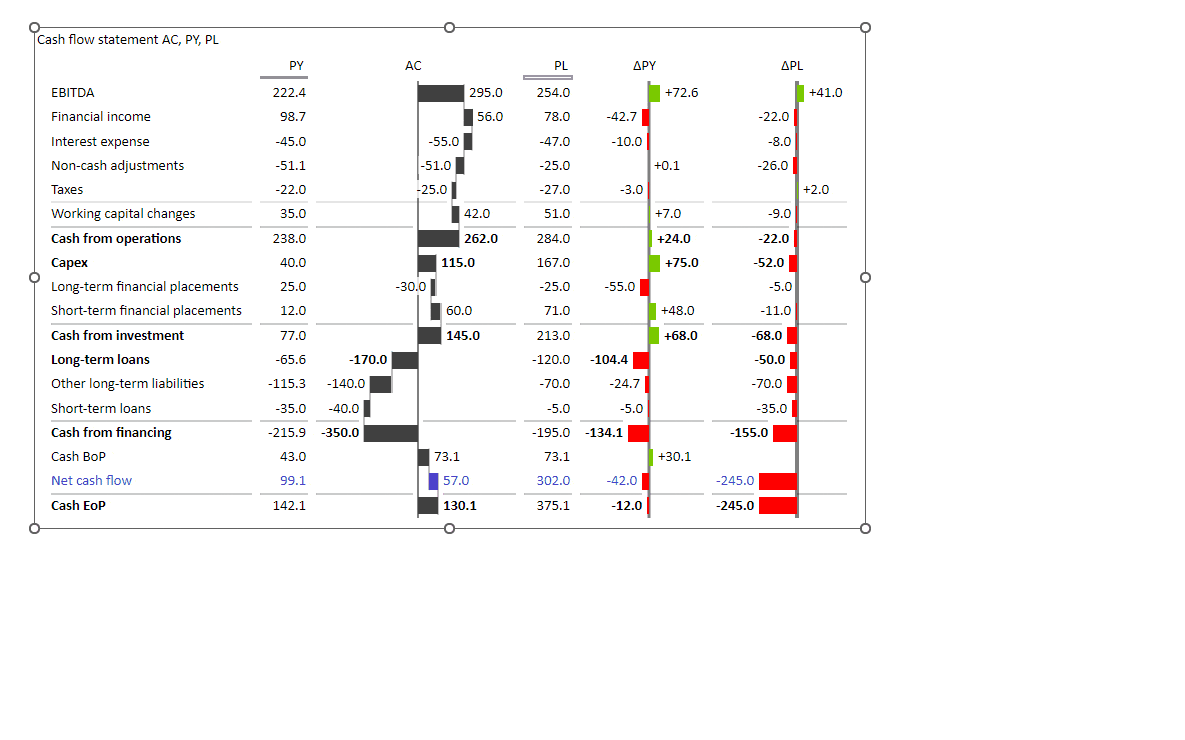
Let's have a look at how this works in the example below.
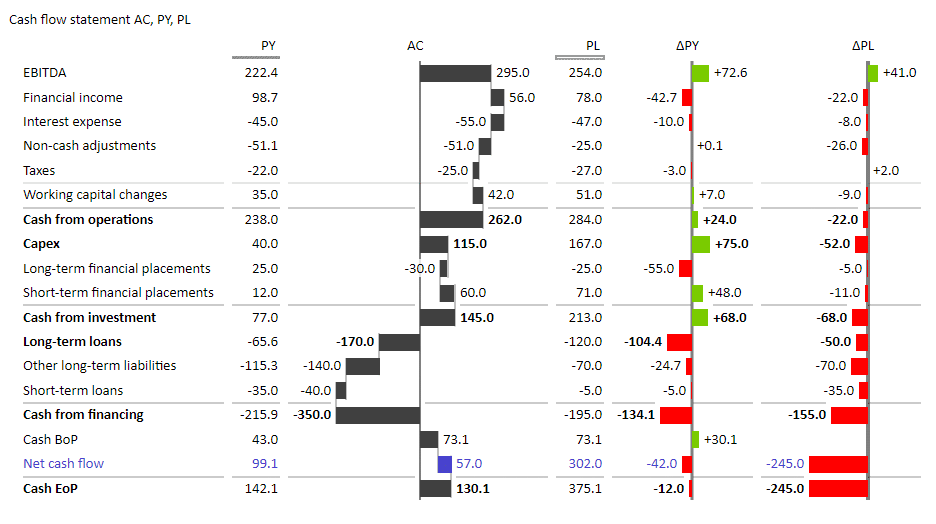
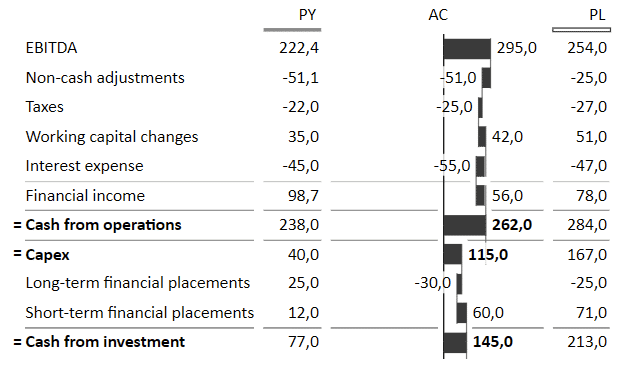
We can see that an actionable Excel cash flow statement displays cash inflows and outflows from operations, investments, and financing activities. The final items clearly display the amount of cash and cash equivalents that a company had at the beginning of the period and at the end of it.
But the report you see in the image above is not your regular cash flow statement. Most cash flow statements contain nothing but plain numbers in a chart, making them extremely difficult to read. This one, on the other hand, includes powerful elements that make it easily understandable at just a glance. Let's have a look at what some of them are.
Key elements of an actionable cash flow statement
The above cash flow statement is a feature-rich report that uses a waterfall chart on the actual value to illustrate how various categories affect cash flow. Additionally, it displays absolute variances, which show how actual results deviate from the plan and the previous year's numbers.
Once again, the report is structured to clearly show how individual elements combine into larger groups, using subtotals and calculations.
Having a clear picture of your cash flow allows you to quickly gauge the overall financial health of your business and make better decisions regarding hiring, equipment purchases, expansion, or salaries.
Creating a cash flow statement
Now, let's create a simple cash flow statement. Open the Excel spreadsheet with your data and insert a Zebra BI Tables visual. To do that, click on Insert on your tool ribbon and then click the My Add-ins button. Select Zebra BI Tables for Office. This will insert a table with an overlay, where you should click Continue with a free license.
Once the Zebra BI Tables visual is inserted, expand it and then click on the AC column to change it into a waterfall chart.
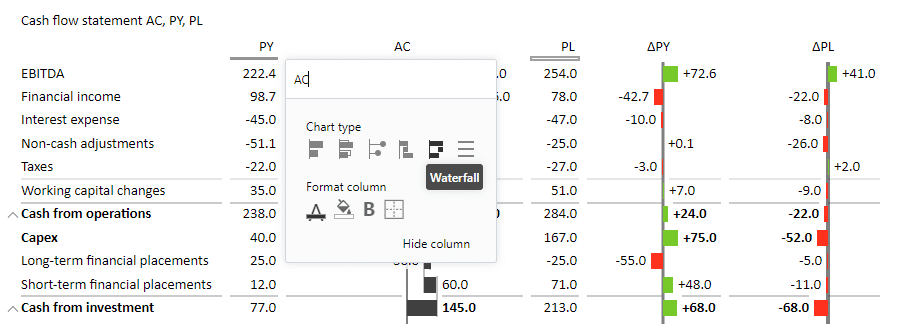
The next step is to change the selected values to Results.
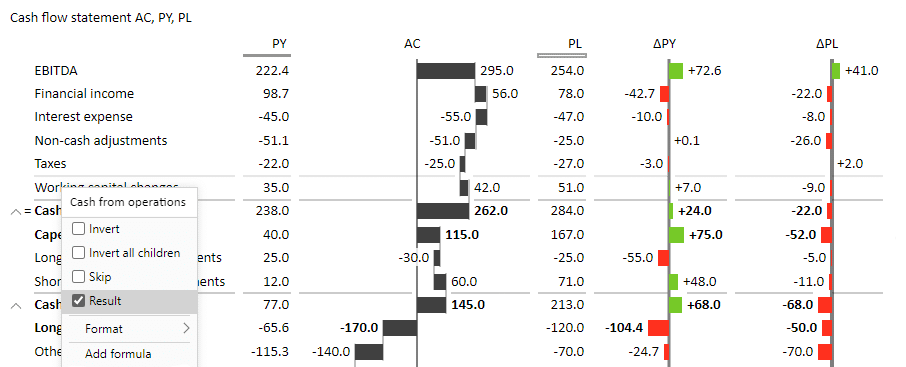
In a cash flow statement, cash from operations, CAPEX, cash from investment, long-term loans, Cash BoP, and Cash EoP values are all results. Right-click them and select the Result item in the menu.
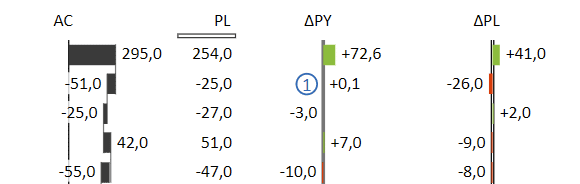
What's super neat is that these visuals are completely interactive. This means that if you enlarge the chart, it will automatically add more information. For example, it also adds relative and absolute variances for a more complete overview.
See exactly how this works in the gif below:
So cool, right?
What's also important to note is that Zebra BI Charts and Tables for Office are IBCS-certified, which ensures consistent reporting out of the box.
Now that you know just how easy it can be to build such actionable financial statements in Excel, why not give it a go with your data?
Create advanced Cash Flow report in Excel fast
Optimize your cash flow analysis with our specialized template. Simplify complex data into actionable insights.