How to Create a Balance Sheet in Excel (Free Template & Examples)
A balance sheet is designed to show your company's assets, liabilities, and equity at a specific point in time.
However, most balance sheets built in Excel look fine until someone asks a question that the numbers can’t answer. Why did profit drop? Where did the cash go, or is your company actually profitable?
So if you’re an FP&A analyst or part of the finance team, you’ll get step-by-step instructions on how to create a balance sheet in Excel, key ratio formulas, and visualization practices to make the right decisions.
Also, you can download Zebra BI’s free Excel template, used by 20,000+ finance teams, so you don’t start from scratch.
What is a balance sheet?
A balance sheet is a financial statement that shows what your company owns, what it owes, and what’s left over for shareholders. All of these are analyzed at a specific point in time. Most of the time, is the last day of a month, quarter, or fiscal year.
Regardless of the business, every balance sheet follows one equation:
Assets= Liabilities + Equity
Is your business growing or is it just staying flat? A balance sheet gives you the right answer, and it’s the first document CFOs, investors, or lenders ask for when researching a company’s financial health.
Key components of a balance sheet
The balance sheet equation is simple: Assets = Liabilities + Equity. Here's what sits behind each of those 3 terms.
1. Assets
An asset is anything of value that a company owns. Assets are categorized into two types: current and non-current.
Current assets are short-term resources that are expected to be converted into cash within one year. These include cash, accounts receivable, and inventory.
Non-current or long-term assets are expected to provide value for more than one year. Examples include property, plant, equipment, and intellectual property like patents or trademarks.
2. Liabilities
Liabilities represent obligations a company must fulfill. Similar to assets, liabilities are classified into current and non-current categories.
Current liabilities are obligations due within one year, including accounts payable, short-term loans, and accrued expenses like wages or taxes.
Non-current liabilities, or long-term liabilities, are obligations due beyond one year. These include bonds payable, long-term loans, and deferred tax liabilities.
3. Equity
Also known as owner's equity or net worth, equity represents the residual interest in the company's assets after deducting liabilities.
Essentially, it's what's left for shareholders if the company paid off all its debts. Shareholders' equity includes the initial capital investment by shareholders and any retained earnings or losses from the company's operations.
Each of these components provides insights into a company's financial standing. By preparing a balance sheet in Excel, you can accurately quantify these elements, leading to more informed business decisions.
Let’s look at the equation again.
Assets = Liabilities + Shareholders' Equity
Keep in mind that the equation must always hold. Your total assets should always equal the total of what your business owes and what shareholders own.
If your business equation doesn’t balance, something is missing. This could be a line item, a formula range, or a data entry that didn’t make it in.
How to Create a Balance Sheet in Excel (Step-by-Step)
Step 1: Open a new workbook and set up your sheet
The first step in creating a balance sheet in Excel is to make sure you set everything right. In the top rows, add your business name, the label “Balance sheet”, and the reporting date. A balance sheet highlights a specific point in time, not a period, so get it right from the start.
Step 2: Add the Assets section
Create 2 subsections: Current Assets and Non-Current Assets.
List current assets first: cash, accounts receivable, inventory, then non-current assets below: property, equipment, and intangibles.
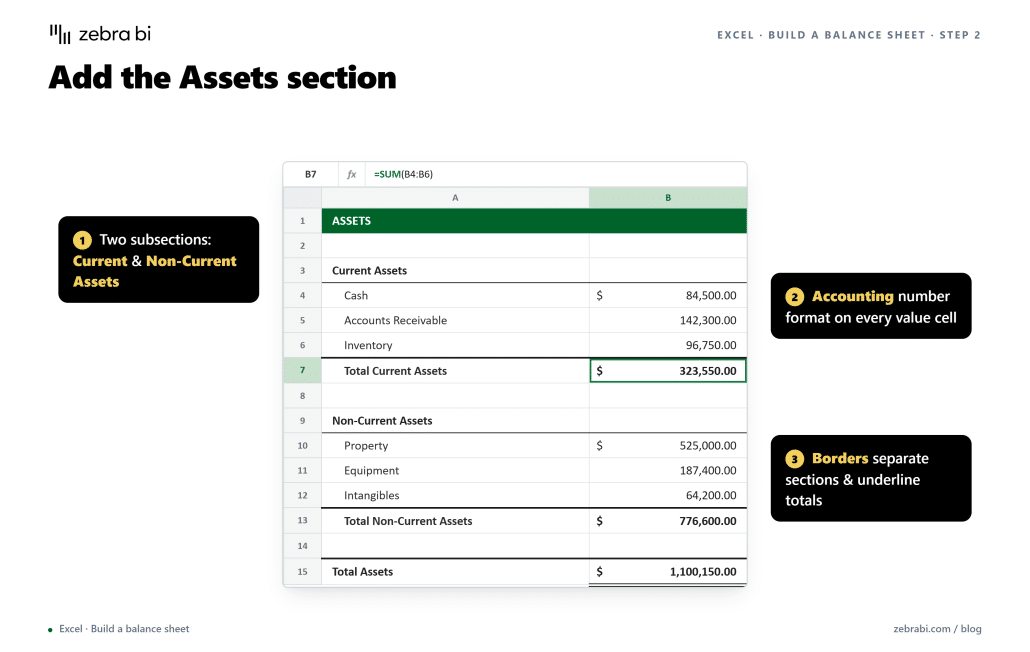
Apply accounting number format to all value cells, and add borders to cleanly separate sections.
Step 3: Add the Liabilities section
Below your Assets section, add a bold "Liabilities" header.
Follow the same structure: Current Liabilities first (accounts payable, short-term loans, accrued expenses), then Long-Term Liabilities below (mortgages, bonds payable, deferred tax liabilities).
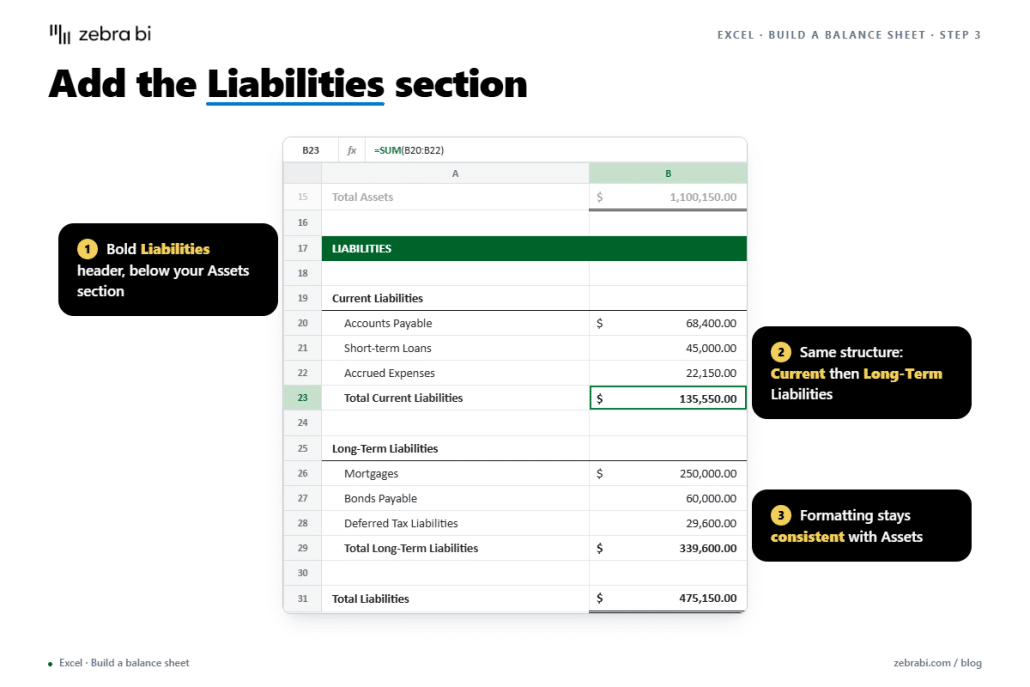
Keep the formatting consistent with your Assets section.
Step 4: Add shareholders' equity
Below Liabilities, add a "Shareholders' Equity" section. List common stock, additional paid-in capital, and retained earnings as separate line items, then add a Total Equity row at the bottom.
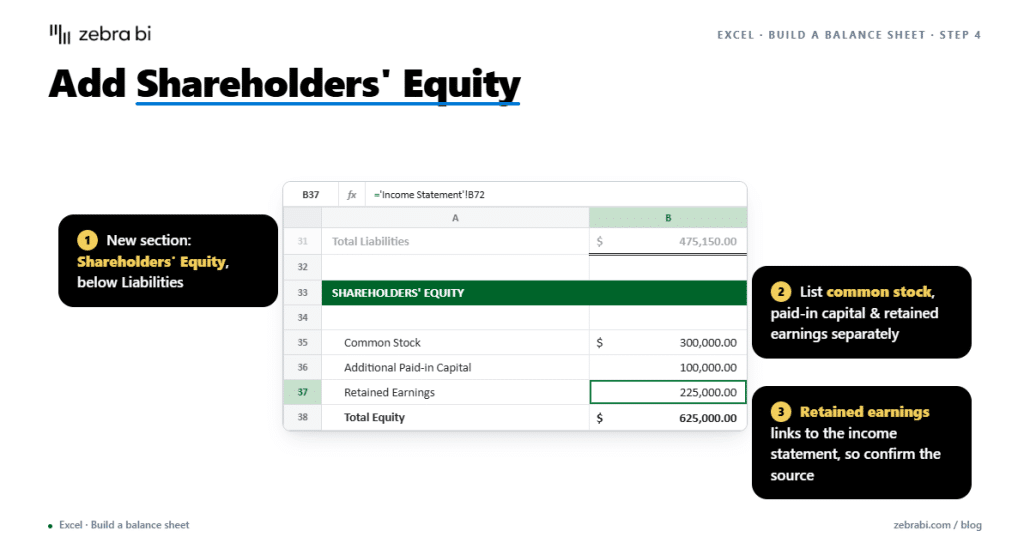
Retained earnings are the one that moves most from reporting cycle to cycle. Make sure it's pulling from the right source.
Step 5: Add SUM formulas for each section
Use =SUM() to total each subsection. Do the same for non-current assets, then sum both into a Total Assets row. Repeat for liabilities and equity. Every section total should have its own clearly labeled row.
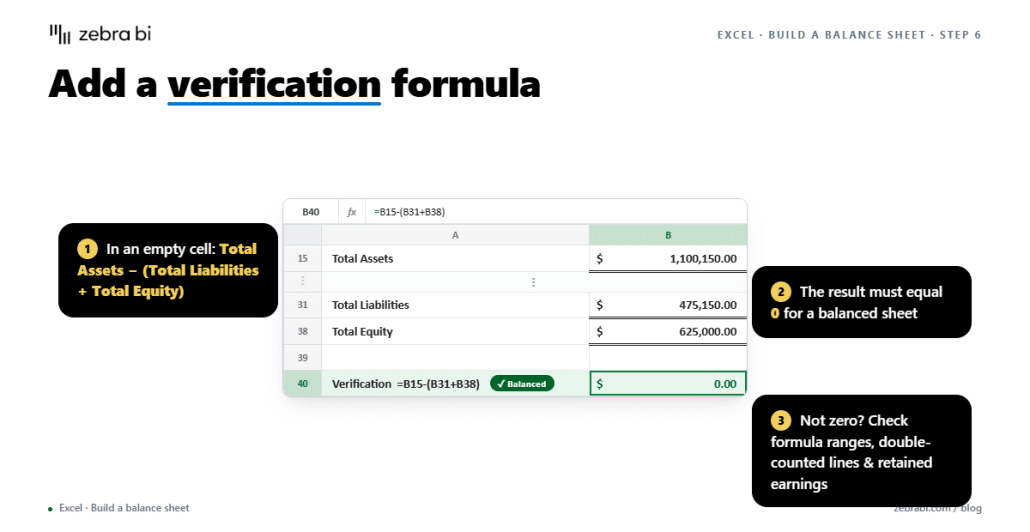
Step 6: Verify the balance
Add a verification formula in an empty cell:
=Total Assets - (Total Liabilities + Total Equity)
The result must equal 0. If it doesn't, work backward: check that every formula range includes all rows in that section, that no line items are counted twice, and that retained earnings match your income statement closing figure.
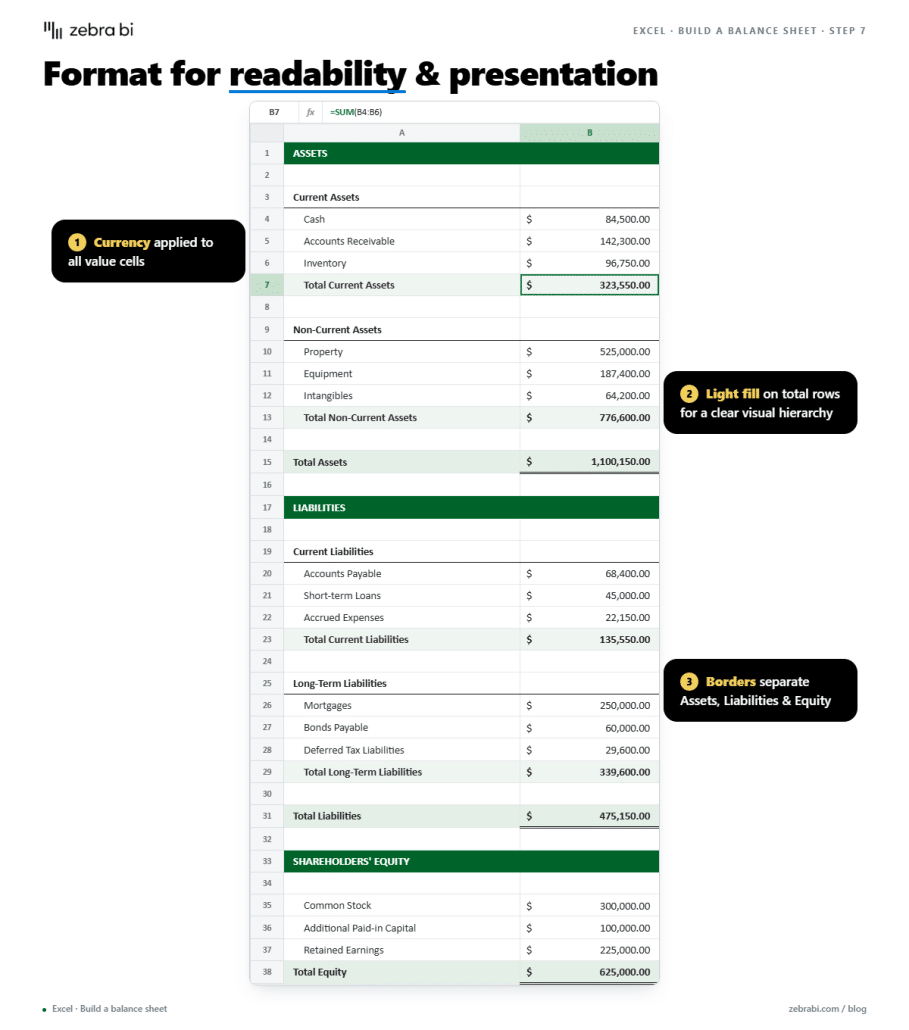
Step 7: Format for readability and presentation
Add currency to all value cells. You can also use a light fill color and total rows to create a clear visual hierarchy. Add borders between sections to separate Assets, Liabilities, and Equity.
Free balance sheet template for Excel
Do you know how to create an Excel balance sheet? If not, you can skip the headache and download a template that 20,000+ finance teams already use.
Here’s what’s included in our free Excel balance sheet template:
- Pre-built vertical layout with clearly labeled Assets, Liabilities, and Equity sections
- Automatic SUM formulas for every section and subtotal , including the balance check formula
- Year-over-year comparison columns so you can track movement across reporting periods
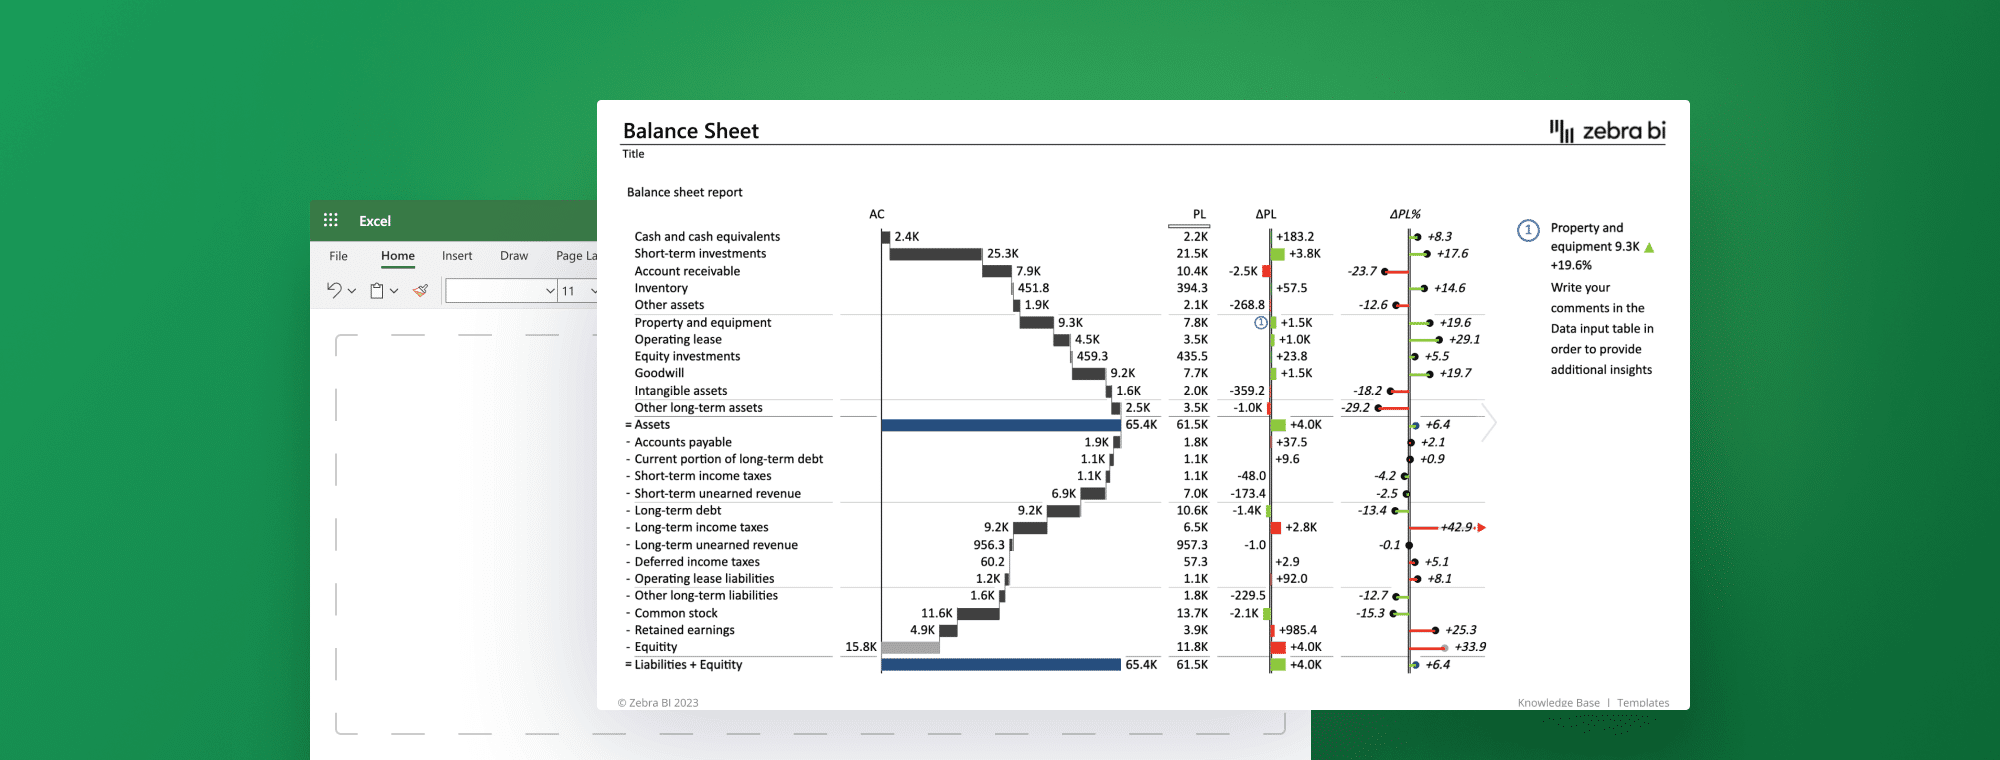
- Integrated variance analysis with waterfall charts powered by Zebra BI for Office, so your balance sheet is boardroom-ready without any manual work.
Get the Free Balance Sheet Template Today
Quickly present your company's assets, liabilities, and shareholder equity – just download the template and change the data!
Do you want to include your business balance sheet in a PowerPoint presentation?
Our free template works as a starting point with Zebra BI for Office, so you can present your data in IBCS-compliant format without rebuilding anything from scratch.
How to analyze your balance sheet with key financial ratios
Here are the 5 most important ratios you should calculate using your Excel balance sheet:
1. Current ratio
Formula: Current assets / current liabilities
Target: Above 1
The current ratio tells you whether your business can meet its short-term obligations with short-term assets.
For example, a current ratio of 1.5 means you have $1.50 in current assets for every $1.00 you owe in the next twelve months.
A ratio below 1 is a warning sign. It means you may need to rely on credit or sell assets to cover near-term obligations.
If your Excel balance sheet calculates a current ratio bigger than 2, it can indicate you have extra cash that could be used.
2. Debt-to-equity ratio
Formula: Total Debt / Total Equity
Target: 0.5 to 2.0, depending on the industry
The debt-to-equity ratio shows how much of your business is financed by creditors versus shareholders.
A high debt-to-equity ratio means that your business is highly leveraged. The good news is that leverage increases returns when things go well. The bad news is that a high ratio accelerates losses when things aren’t as smooth.
In general, a ratio between 0.5 and 2.0 is considered healthy. However, benchmarks vary depending on the industry. Capital intensive industries something about higher ratio.
A manufacturing business, for example, will typically run a higher debt-to-equity ratio than a service business simply because of the equipment and infrastructure involved.
3. Working capital
Formula: Current assets – Current Liabilities
Working capital is the most direct measure of your business's short-term financial health. A positive number shows that your business has enough resources to fund day-to-day operations.
As the ratio gets smaller across reporting periods, even if it’s a positive number, it might signal a cash flow problem.
4. Quick ratio
Formula: (Current Assets - Inventory) / Current Liabilities
Target: Above 1
The quick ratio is a more conservative version of the current ratio. It removes inventory, which can’t always be turned into cash quickly, and gives you an accurate picture of immediate liquidity.
When your current ratio looks good, but your quick ratio drops significantly, your liquidity depends on your business's ability to move the inventory. This is a risk worth flagging early, before it becomes a problem that your lenders or investors notice first.
5. Debt ratio
Formula: Total Liabilities / Total Assets
Target: Below 0.5
The debt ratio measures the proportion of your assets that are financed by debt. A ratio below 0.5 generally means your business owns more than it owes. Above 0.5, creditors have a larger claim on your assets than shareholders do.
A high debt ratio signals higher risk, which can limit your business’s ability to secure financing or negotiate a favorable loan.
| Ratio | Formula | Target | What it tells you |
|---|---|---|---|
| Current Ratio | Current Assets / Current Liabilities | Above 1 | Whether your business can cover short-term obligations with short-term assets |
| Debt-to-Equity | Total Debt / Total Equity | 0.5 to 2.0 | How much of your business is financed by creditors versus shareholders |
| Working Capital | Current Assets - Current Liabilities | Positive and growing | Whether your business has enough resources to fund day-to-day operations |
| Quick Ratio | (Current Assets - Inventory) / Current Liabilities | Above 1 | Whether you can cover obligations without relying on inventory |
| Debt Ratio | Total Liabilities / Total Assets | Below 0.5 | The proportion of your assets financed by debt |
How to visualize your balance sheet in Excel
Here’s how to turn your data into visuals that are easy to present during meetings:
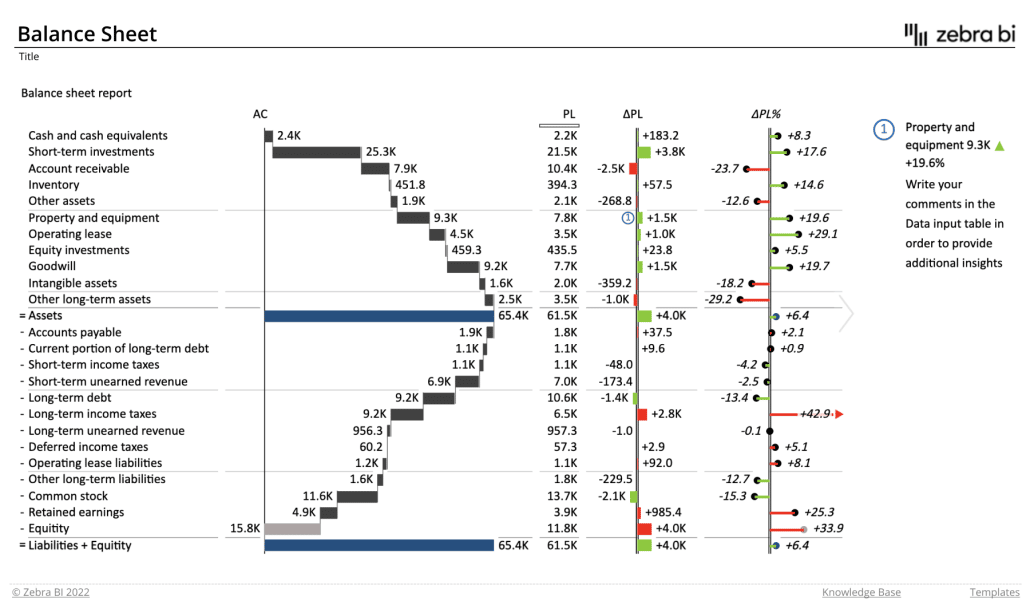
Horizontal bar charts work best for showing asset and liability structure at a specific point in time. Place assets on one side and liabilities on the other, and stakeholders can spot imbalances immediately.
Waterfall charts are useful for highlighting how equity changed over time. Each bar represents a contributing factor, so your audience can follow the movement from opening to closing, instead of comparing 2 totals.
Pie charts give a quick view of asset category distribution. You can use them to explain what share cash is, receivables, fixed assets, and inventory. To keep it easy to understand, use 5 categories or fewer.
All 3 visuals work well for static reporting. The problem is maintaining the report: with every reporting cycle, you’re back to formatting colors, adjusting axis ranges, and fixing labels that moved when data changed.
Balance sheet best practices
When creating a balance sheet in Excel, even a small error can throw off your calculations.
Here are 5 tips on how to create an Excel balance sheet that keeps your reporting accurate:
1. Separate personal and business finances
Any personal asset, expense, or liability that makes it into your balance sheet will throw everything off.
This usually happens in small businesses where the owner and the company share accounts, but it could also happen in larger companies when expense categories aren’t clearly defined.
2. Don’t replace cost with market value
The assets within your balance sheet should reflect what you paid for them, not their current value.
If you use current market values, your asset base inflates and gives stakeholders a misleading picture of your financial position.
3. Consider amortization and depreciation
Depreciation and amortization reduce the value of your assets every reporting cycle. If you ignore them, your assets look healthier than they are, equity gets overstated, and your balance sheet stops tying to your income statement.
4. Cross-check your balance sheet
Your 3 financial statements (balance sheet, the income statement, and the cash flow statement) should all point in the same direction.
Net income flows from the income statement into retained earnings on the balance sheet. Cash movements on the cash flow statement should match the change in your cash balance.
If the numbers don’t match, you made an error somewhere.
To make sure your balance sheet is correct, cross-check all 3 statements at every close, not just when something looks off.
5. Use a consistent reporting date
Keep in mind that a balance sheet shows a specific point in time, not a range. Using different reporting dates across periods makes your comparison unreliable and creates gaps that make no sense.
Pick a date that’s relevant to your business and ensure it matches the date used in your income and cash flow statement.
Create your own balance sheet
A balance sheet is only useful if the numbers behind it are accurate, the structure is consistent, and the output is something your team can actually act on.
Getting there takes time, especially if you make it from scratch, cross-check across 3 financial statements, and make sure your ratios are pulling from the right cells.
If you want to skip the setup, download Zebra BI's free balance sheet template for Excel, already used by 20,000+ finance teams.
Download the Free Balance Sheet Excel Template
Show actionable insights using an easy-to-read table with integrated charts and other advanced visualization features.