Inventory Management and Monitoring Dashboard for Power BI (Free)

Zebra BI for Power BI


Overview
This Zebra BI inventory dashboard helps you save time, cut costs, and avoid stock issues. Designed for inventory managers, supply chain teams, and operations staff, it turns generic stock data into specific numbers you need to act on.
What you’ll get:
- Real-Time Insights: Quickly spot stockouts, overstocking, or slow-moving items as they happen.
- Better Planning: Forecast inventory needs and prepare for seasonal demand.
- Performance Tracking: Monitor key metrics like sell-through rates and inventory turnover.
- Improved Collaboration: Share clear visuals and actionable insights with your team.
Use it to optimize stock levels, reduce storage costs, and keep your inventory aligned with business goals. Perfect for inventory analysis, trend tracking, and preparing for busy sales periods.
Play with the interactive demo below. If you click the ⤢ icon at the bottom-right of the report page you'll be able to enjoy the full-screen view.
Inside this template
Automatically calculated variances
Annotation commenting with markers
Tooltip comments (tooltips supporting breakdowns)
Small multiples for trends
Area charts
Line charts
Column charts
Bar charts
Combo charts (mix of bars & lines)
Plus-minus chart
Pin charts
Dynamic format
Difference highlights
Dynamic column headers
Dynamic titles
Cards for KPIs
Hierarchies
Hide/unhide columns
Action dots
Cards as slicers
Find stock problems before they cost you
The Inventory management dashboard for Power BI helps you track not just what’s in stock, but what’s about to become a problem.
You don’t have to cross-check numbers from multiple spreadsheets or ERP exports every time you need a stock check.
What the inventory template helps you answer
With KPI trends, product-group breakdowns, and quantity movement tracking, the dashboard helps you quickly find answers to:
- Which items are about to stock out, and which are sitting too long?
- Are we turning inventory fast enough, or are we tying up cash in slow-moving stock?
- Which product groups are driving the trend and which are dragging it?
- Is this a seasonal dip or something that will turn into a serious problem?
- Are we within the correct range, or are we risking overstocking or a shortage?
This helps you react before a small stock issue turns into a lost sale or a warehouse full of inventory that’s going nowhere.
Who is the inventory management template for?
Built to support both day-to-day stock checks and big planning decisions behind them, this Zebra BI template is a good fit for:
- Inventory managers
Catch stockouts and overstocking before they become bigger problems by automatically tracking days inventory outstanding and range. - Supply chain teams
Compare movement and turnover across your product groups to determine where to adjust for the next order cycle. - Operations staff
Get a clear daily read on stock levels and trends without pulling data from separate sources such as spreadsheets and ERP exports.
Inside the inventory report: a page-by-page breakdown:
This template ships as a multi-page Power BI report, each focused on a core inventory question:
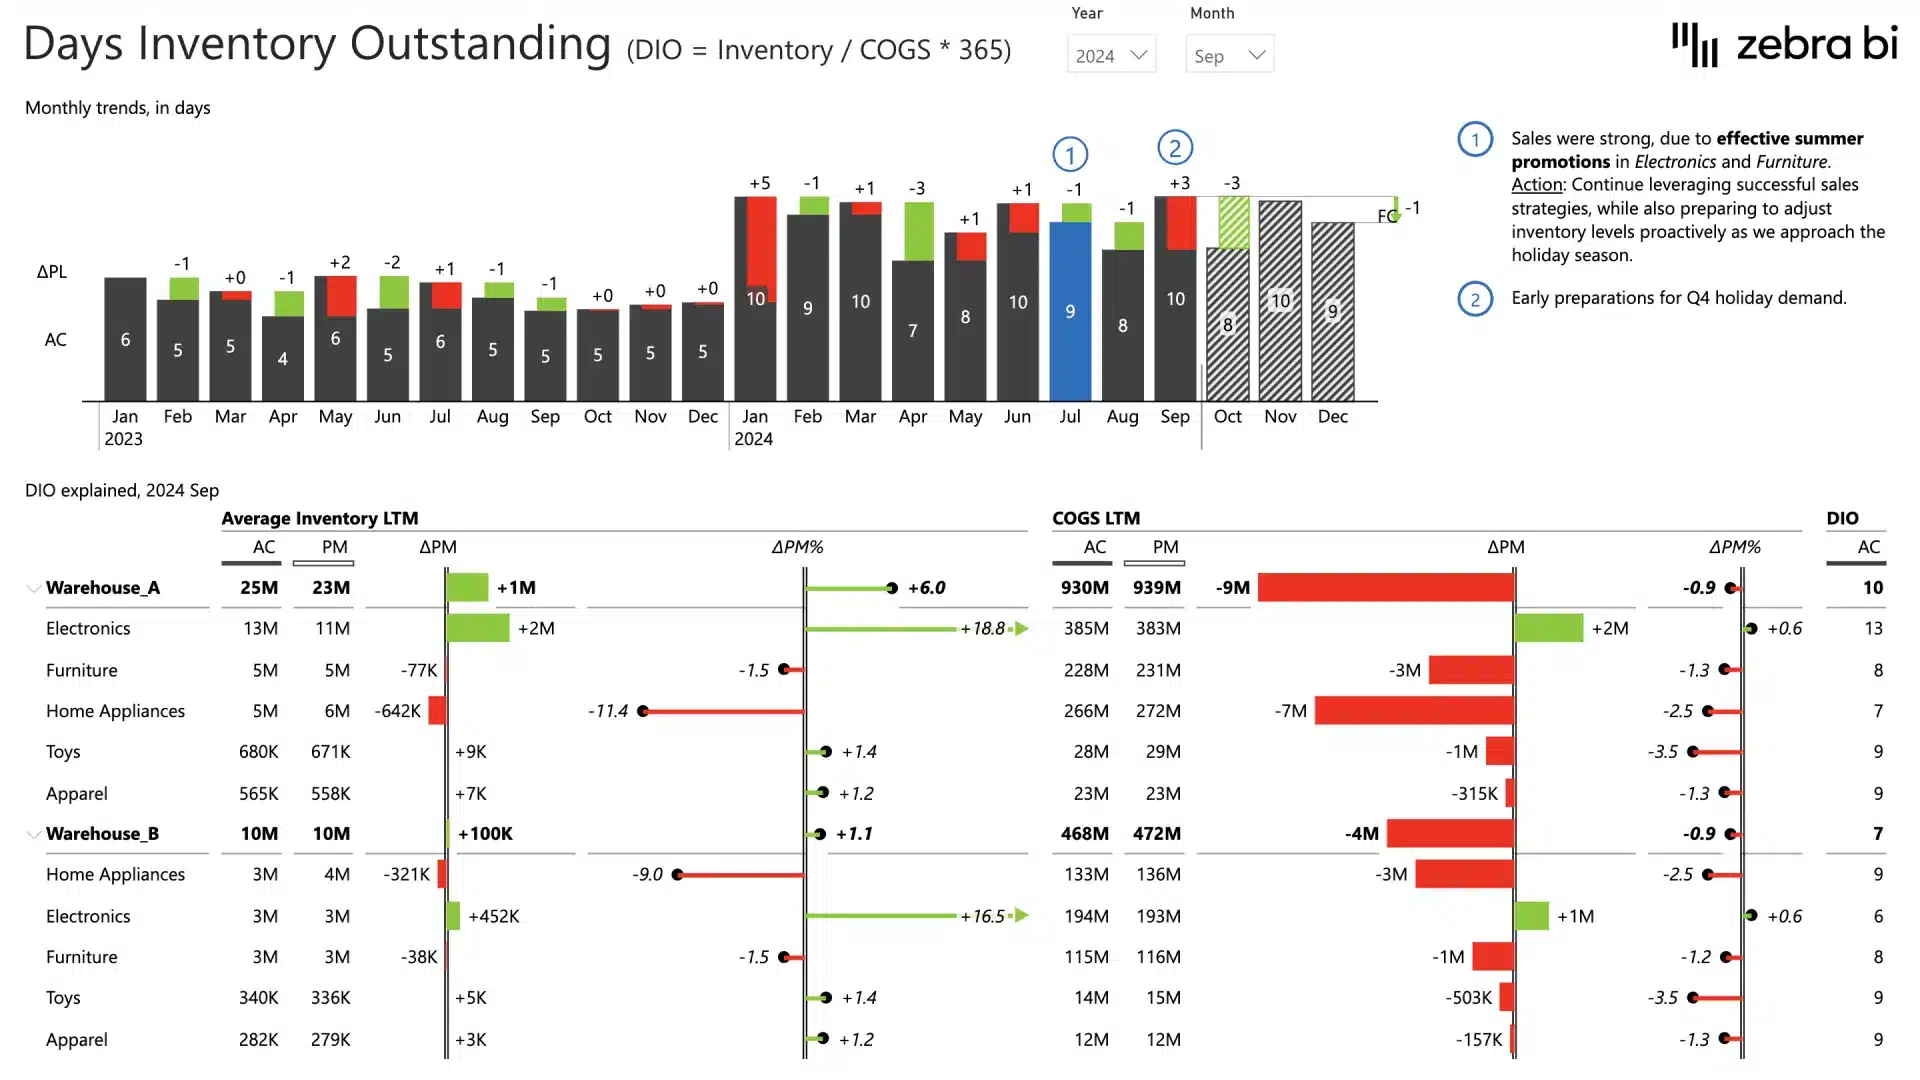
- Days inventory outstanding
See exactly how long stock sits before it moves, by product and product group, so slow-moving items don’t stay hidden inside a healthy-looking total. - Inventory versus optimal range
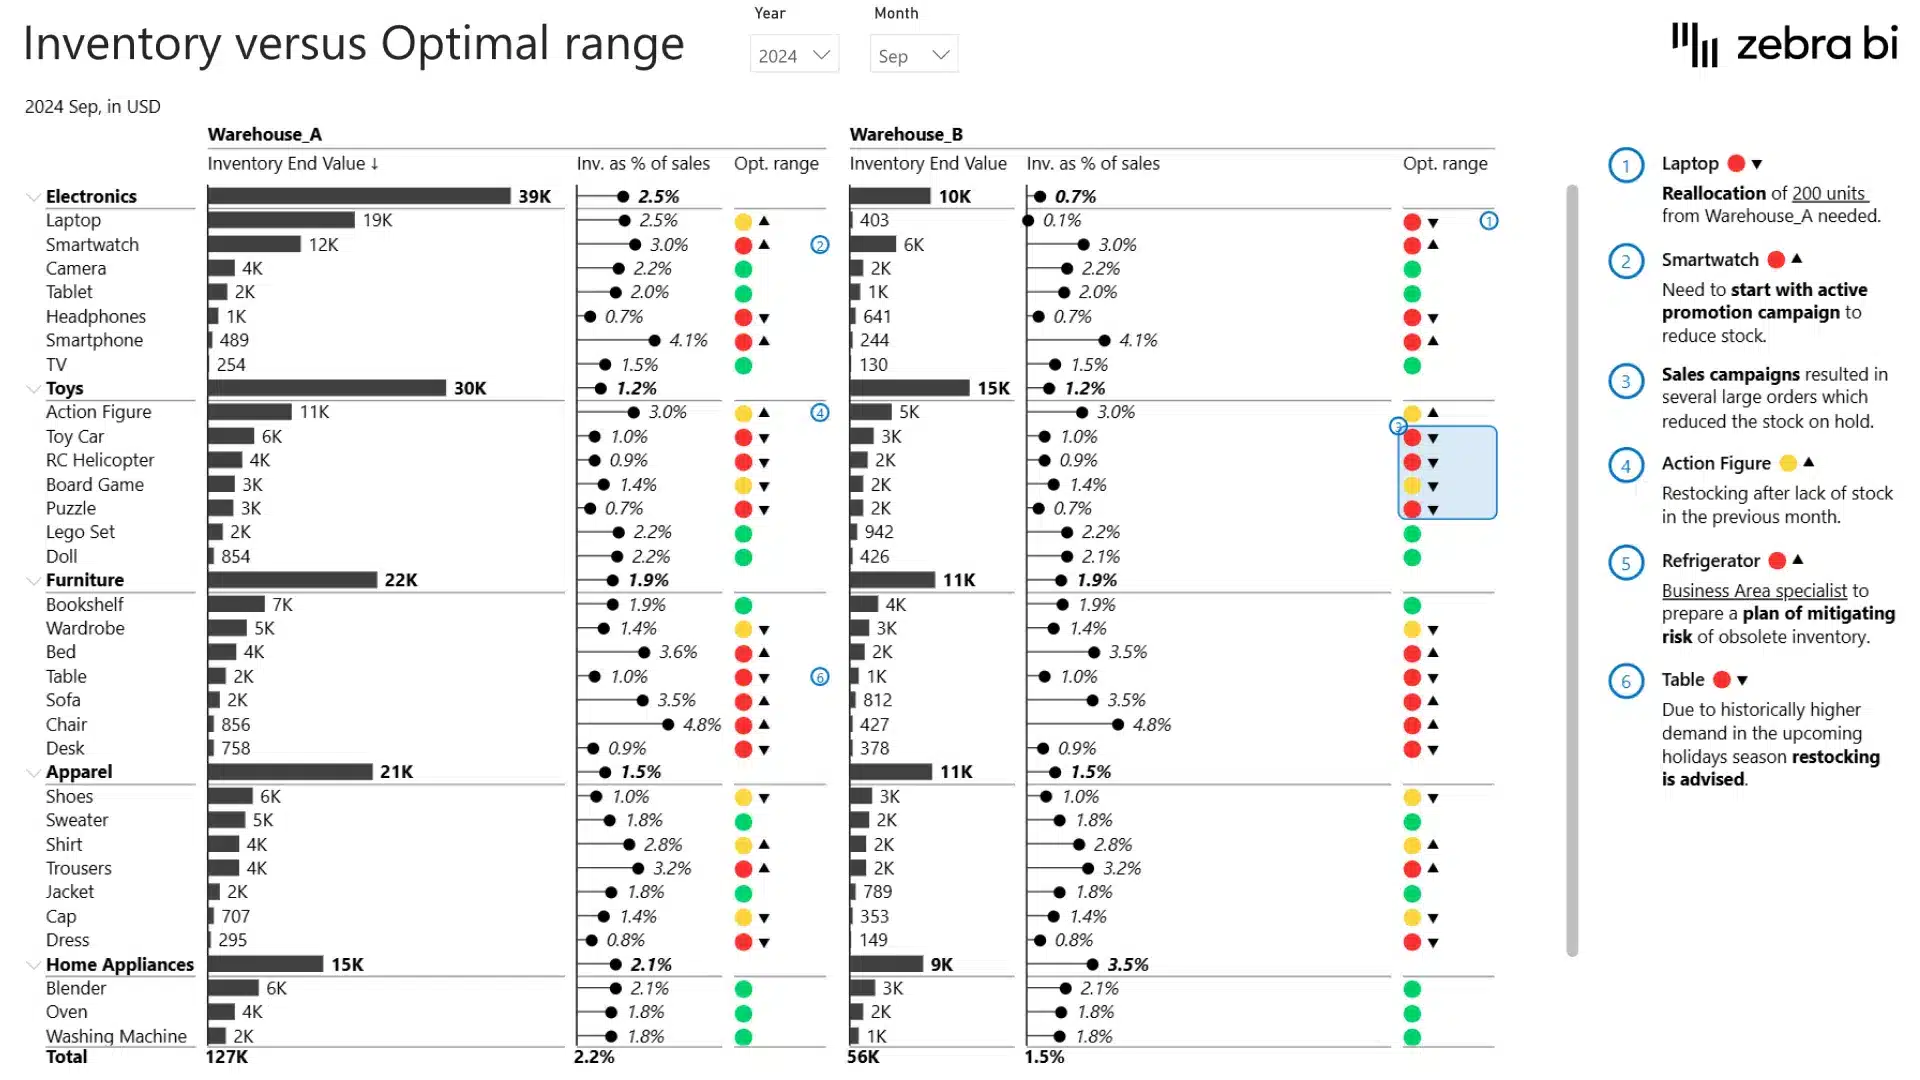
Check which items are understocked, overstocked, or right where they should be, without guessing from a raw stock count. Comments attached to specific data points also explain why, such as a toy line being out of stock because of a recent sales campaign. - Quantity movement and KPIs
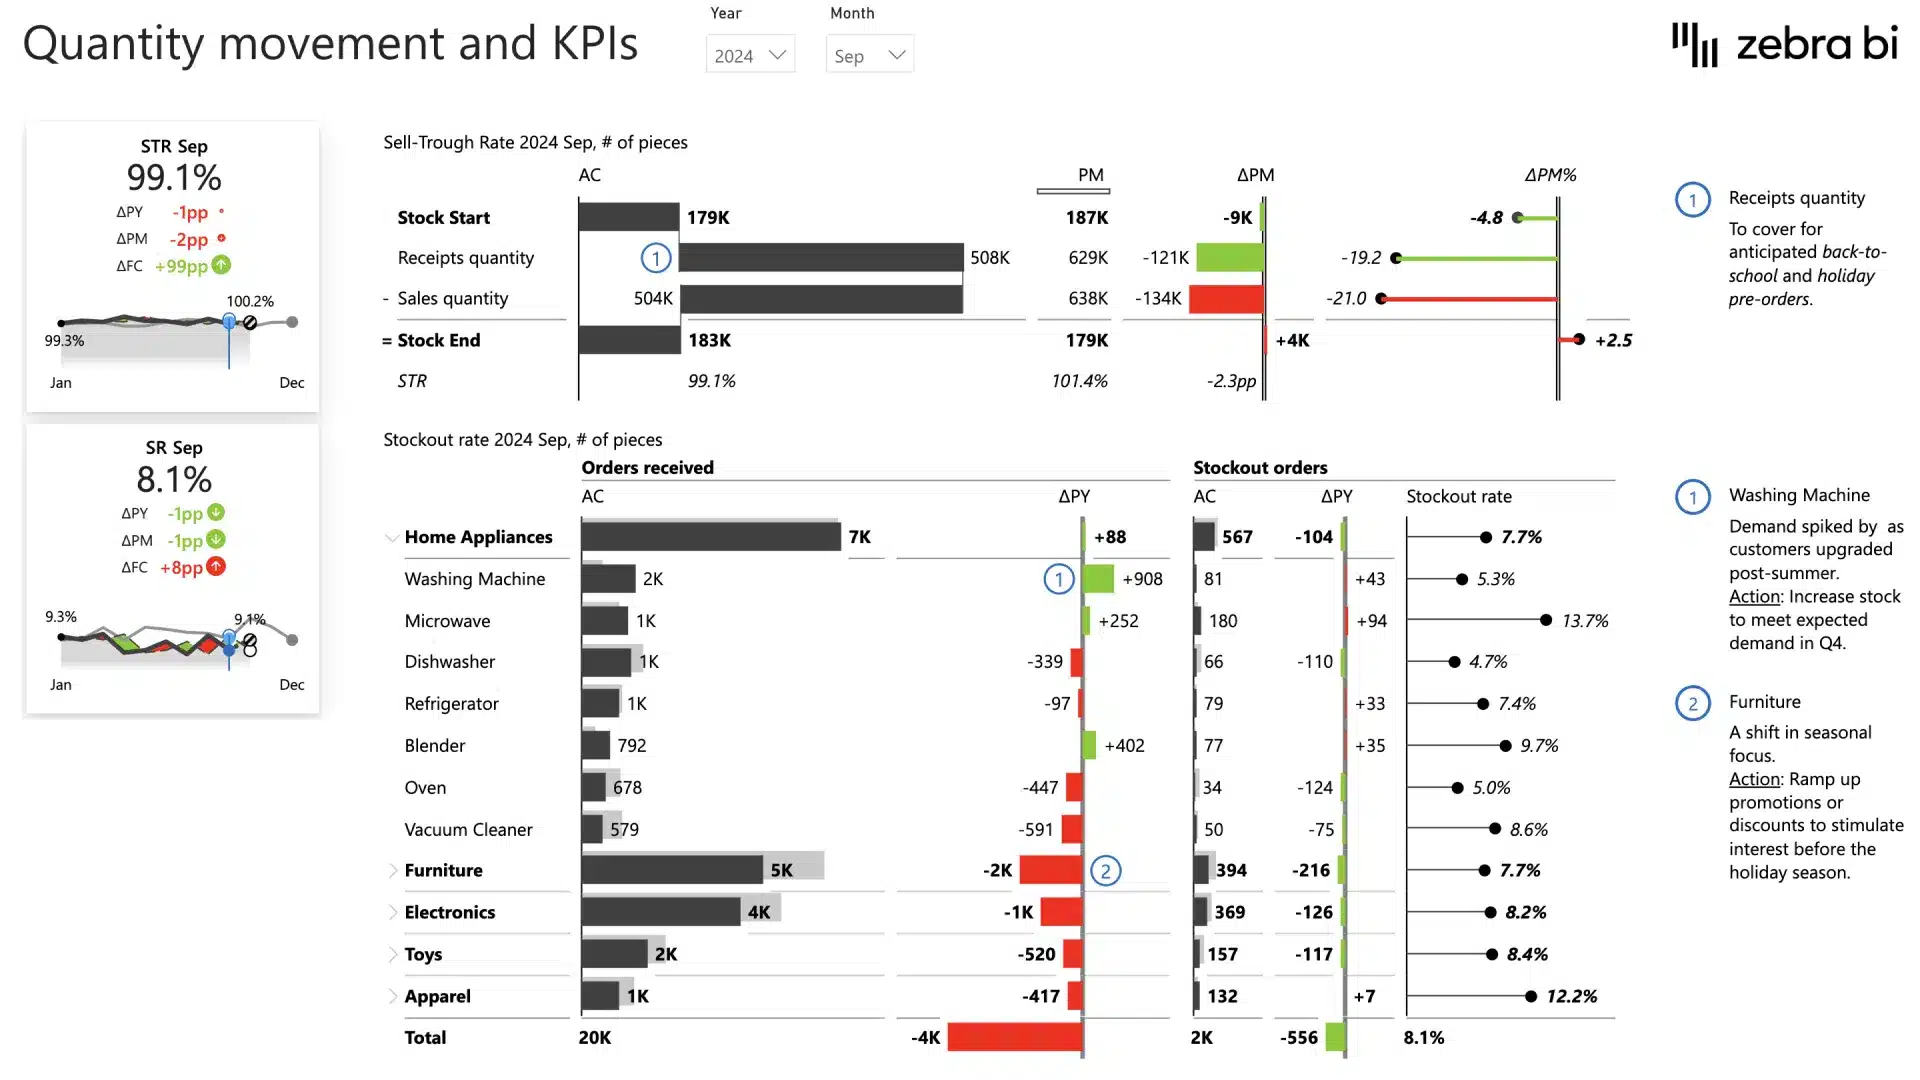
Track how much stock is moving in and out, alongside KPIs that indicate whether the movement is healthy or a warning sign. Comments sit next to the biggest outliers with a recommended next step, so you can decide on the spot instead of taking it back to the team. - KPI trends
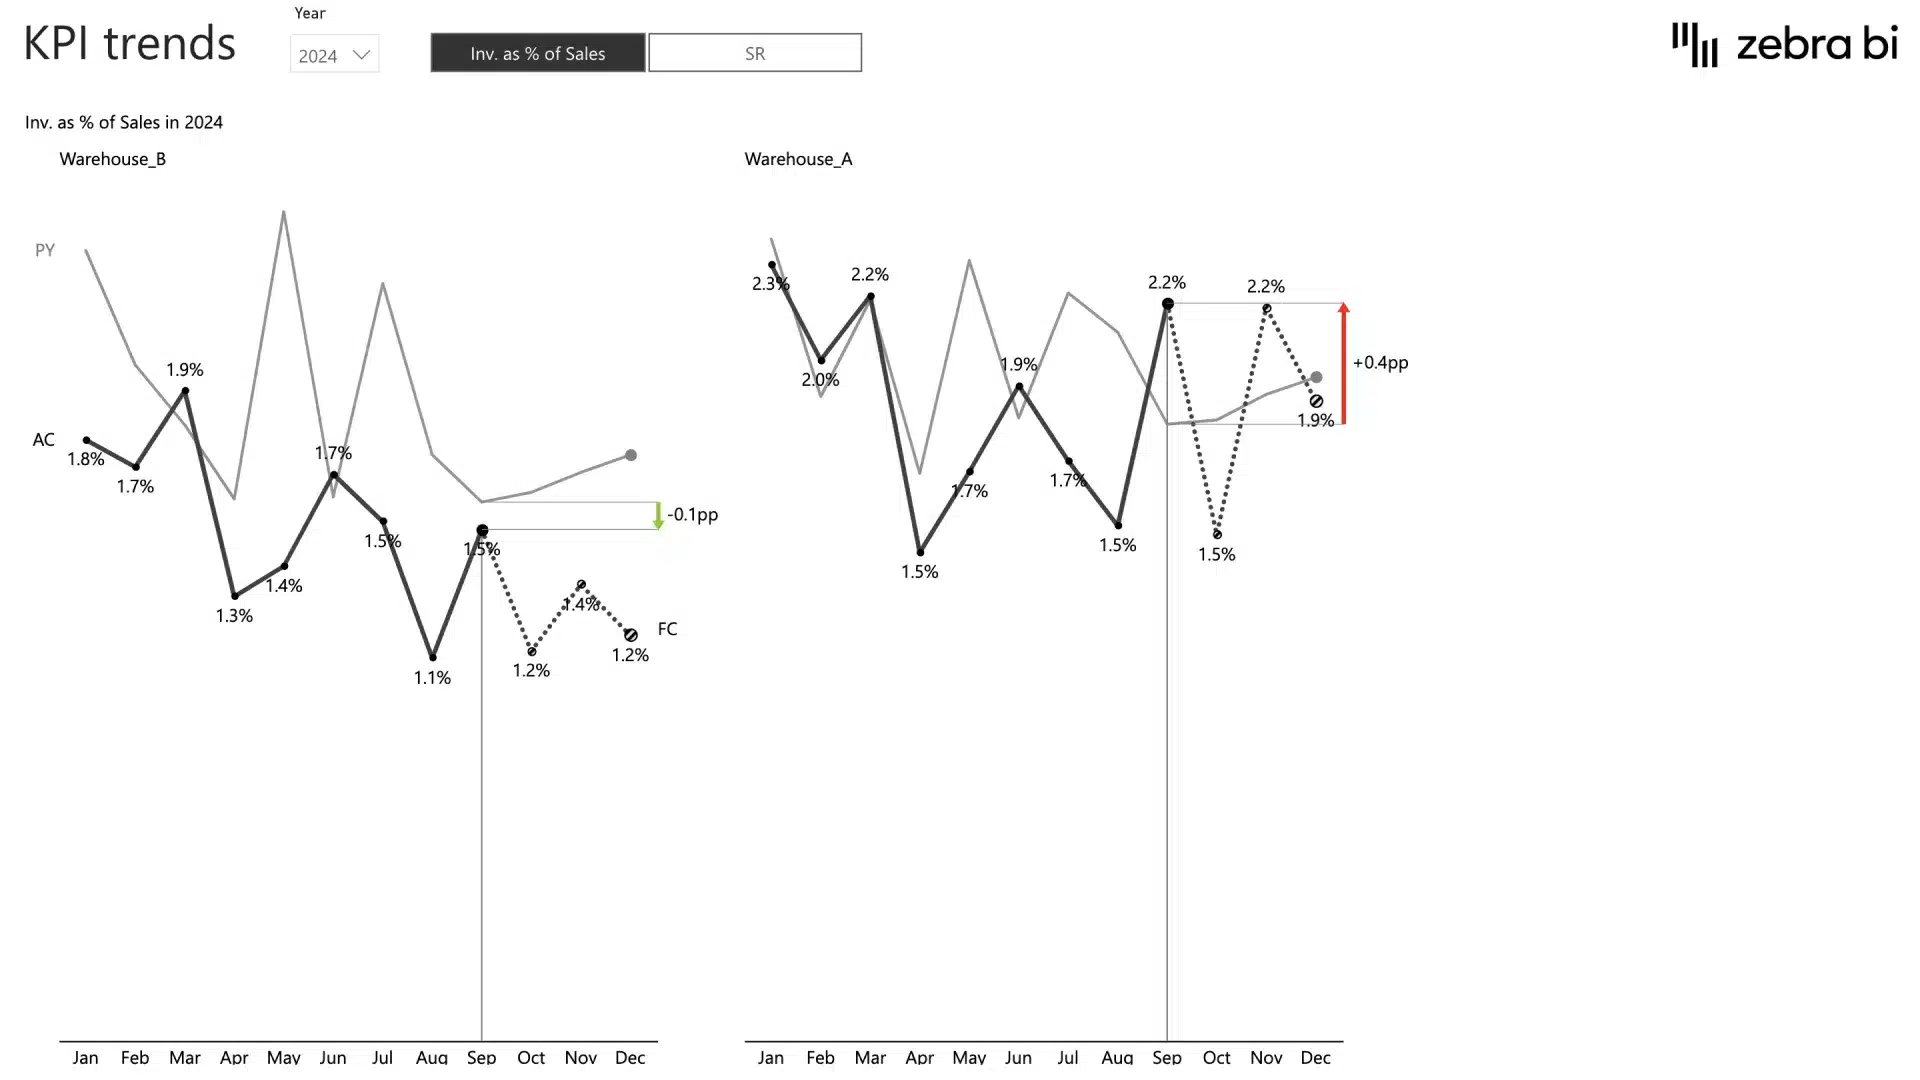
Track your main inventory metrics over time, so you don’t mistake a one-week dip for a real problem or the other way around. - Trends by Product group
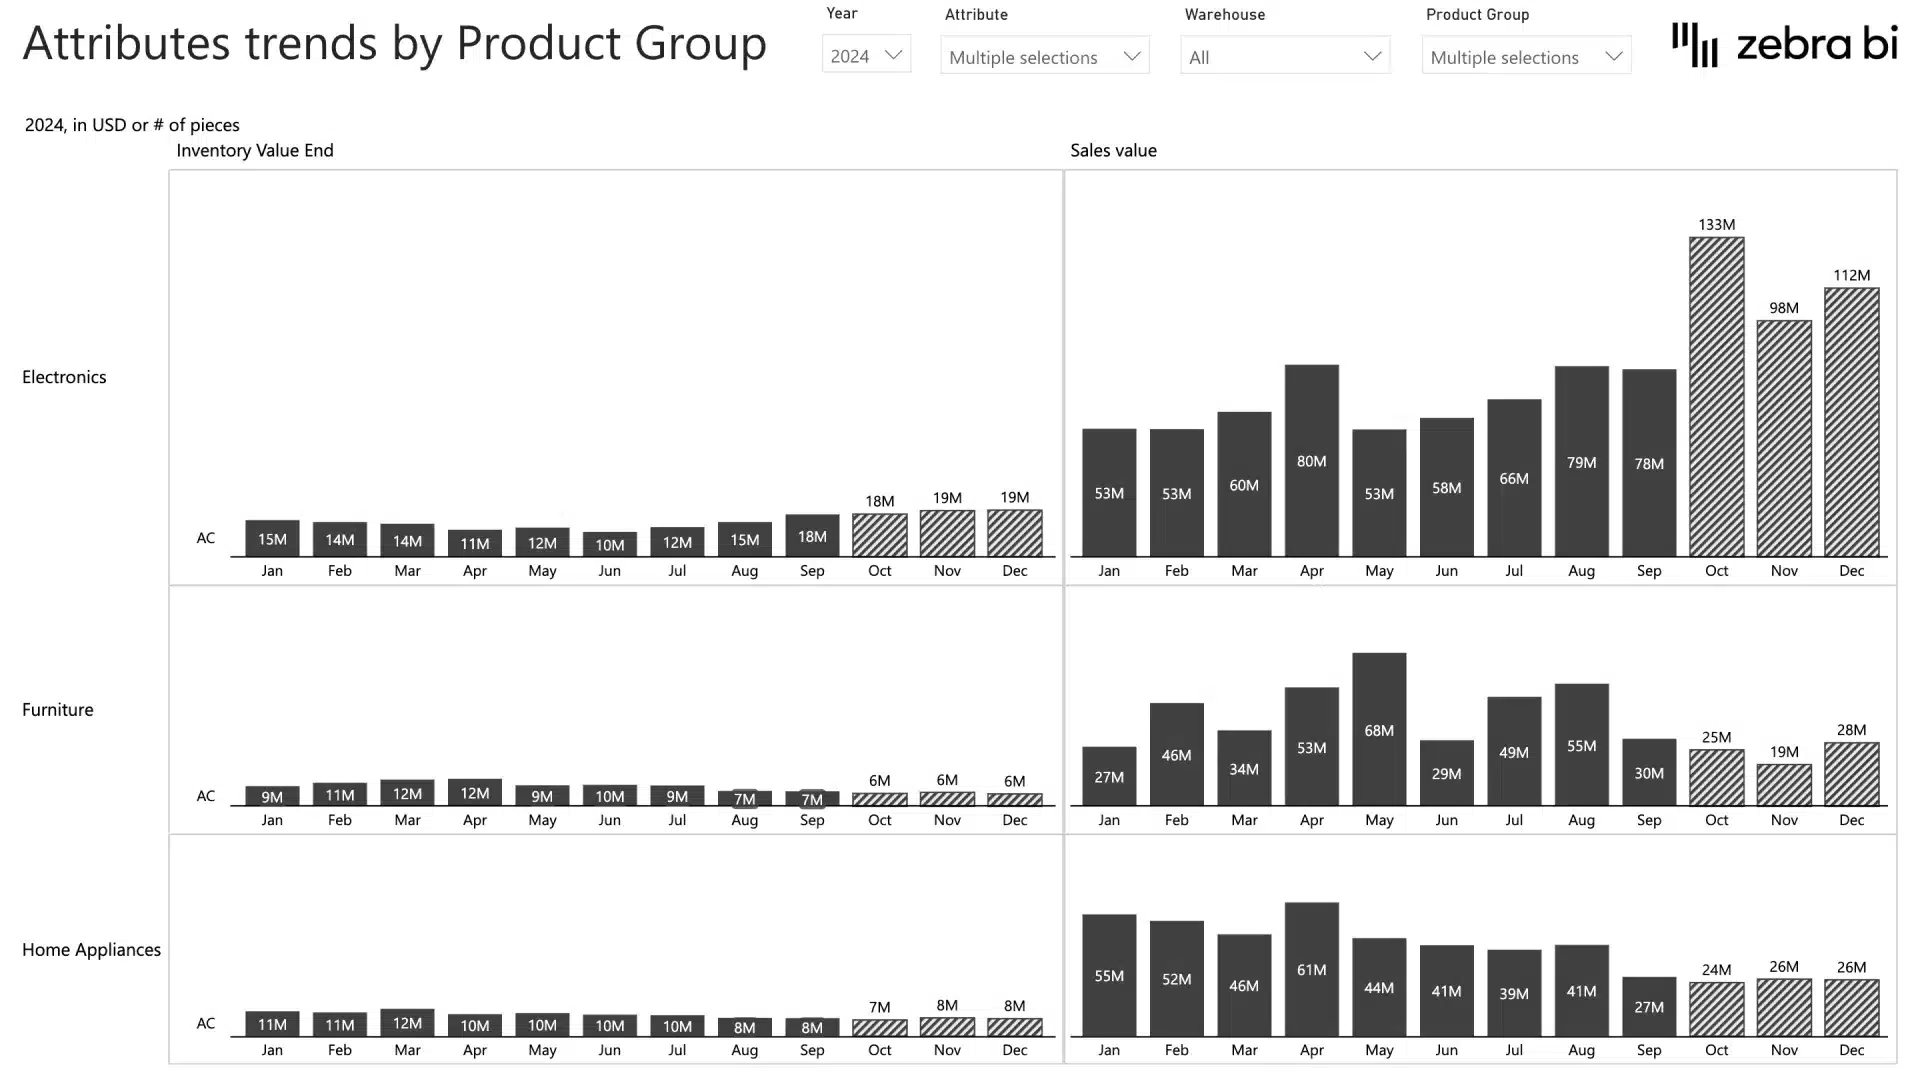
Take a close look at one category to see its own trend line, without the rest of your inventory smoothing it out or hiding it. - Attributes trends by product group
Break trends down further by product attributes within each group when “which product group” isn’t specific enough to act on. - Detailed KPIs
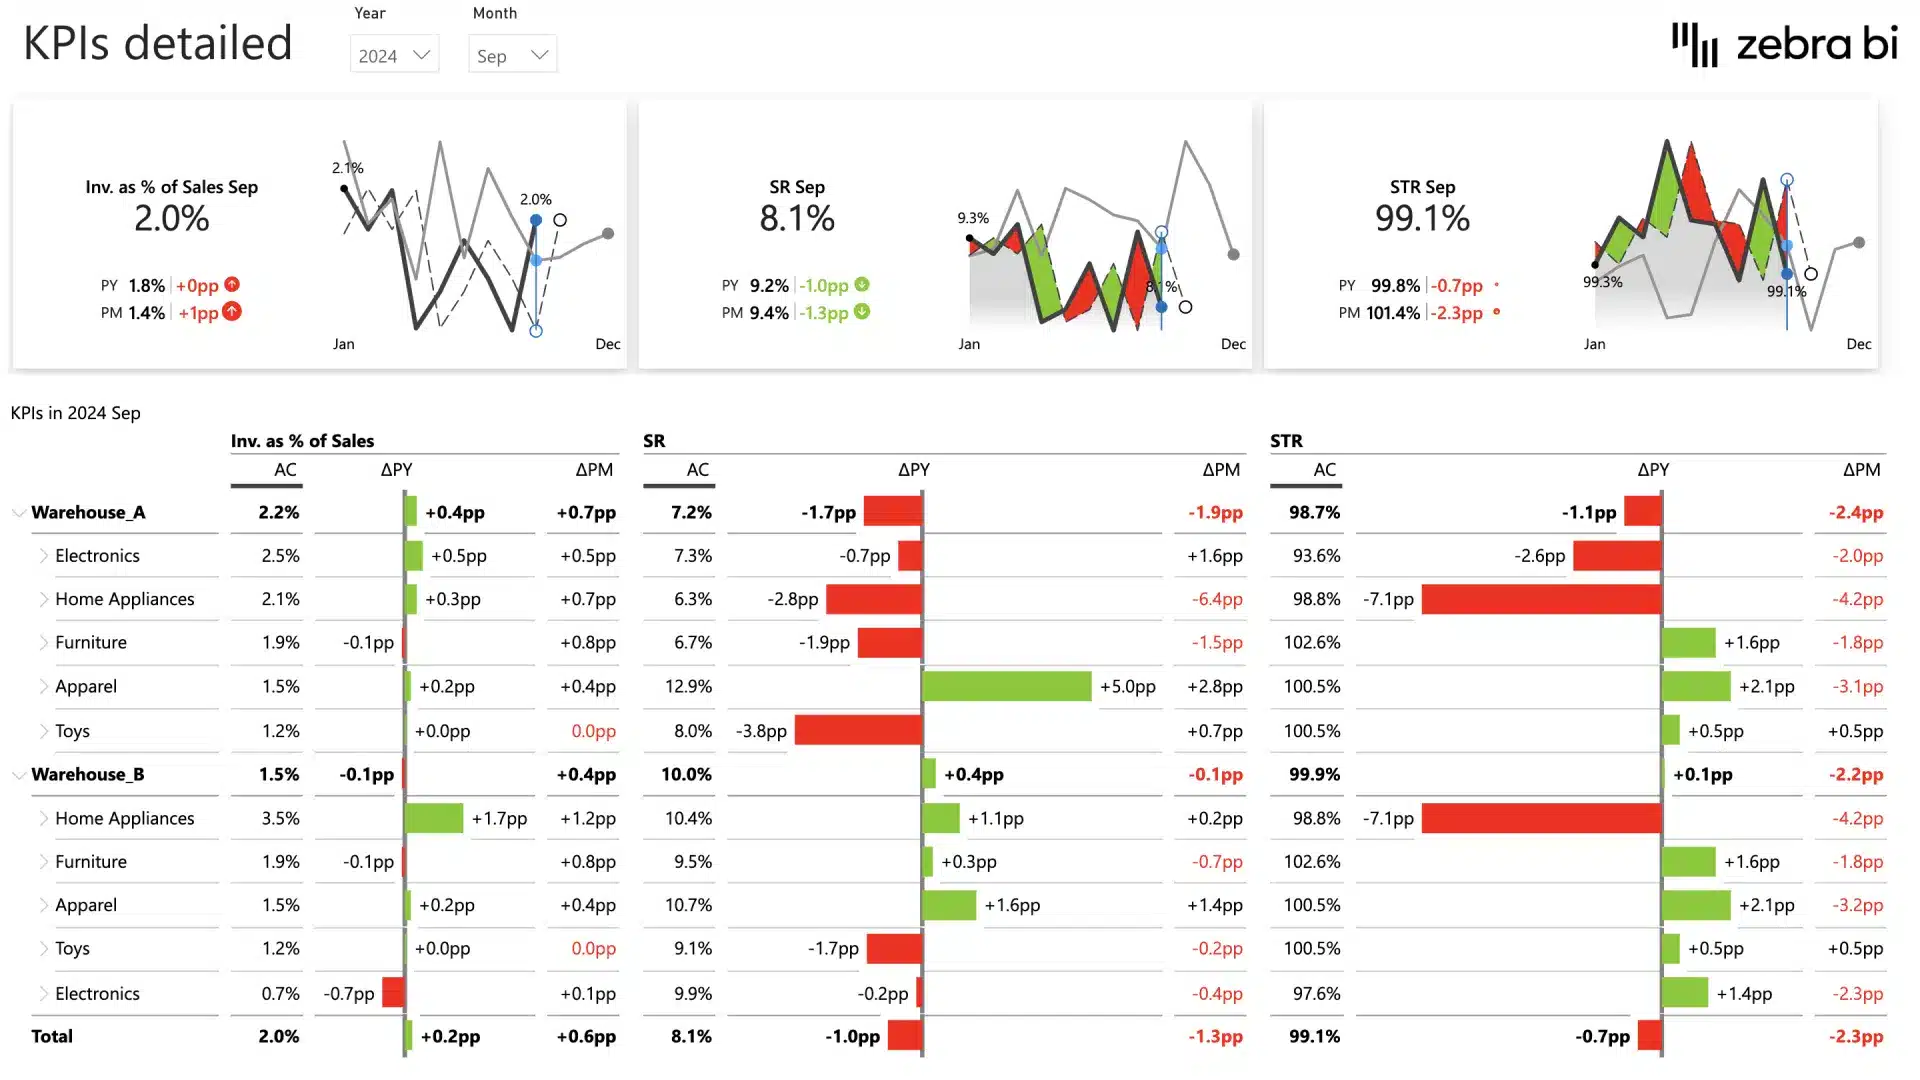
Get a full breakdown for every top-level number if the inventory summary creates more questions than it answers.
Built with Zebra BI visuals for Power BI
This Power BI Inventory Management template is built with Zebra BI Tables, Charts, and Cards to provide you with:
- Automatic variance analysis (plan, prior period, prior year) with no custom DAX
- Clear KPI trends and small multiples across product groups.
- Inventory outstanding and optimal range without manually building the calculations yourself.
- Annotations and commentary to explain why a number moved and what to do about it.
With Zebra BI’s inventory template, you can focus on optimizing your stock instead of formatting or manual calculations.
Download the inventory management template
If you’re looking for a well-designed Power BI template to keep your stock within the optimal range, this dashboard gives you a ready-to-use foundation you can build on.
Download the Inventory Management template for free and see exactly how your stock moves the moment you connect your data.
Get started in 3 steps
1
Download & Open
Download the .pbix file and open it in Power BI Desktop
2
Connect Your Data
Replace sample data with your CRM, ERP, or database source
3
Customize & Publish
Adjust KPIs, colors, and branding, then publish to Power BI Service
Fill out the form and get the Power BI template

20,000+ users have downloaded this template