Marketing Performance Dashboard in Power BI ( Free Template)


Overview
Get a complete, end-to-end view of your marketing performance:
- Track CAC, ROAS & conversion rates
- Compare channels & campaigns side by side
- Spot funnel drop-offs and optimize budget allocation
- Save hours vs manual reporting
Inside this template
See what's driving your marketing performance
This ready-to-use Marketing Performance Dashboard in Power BI helps you understand not only what is happening across your marketing funnel, but why. It combines volume metrics, campaign efficiency KPIs, and long-term trends in one clear, interactive report.
Instead of jumping between disconnected tools and reports, this Power BI marketing dashboard brings all key marketing insights into a single, scalable marketing dashboard example you can use to inspire your marketing reporting.
What this Power BI Marketing Dashboard helps you analyze:
This marketing performance dashboard connects the full marketing funnel from impressions, clicks, leads, and conversions to customers and revenue. It also highlights where performance breaks down across channels and campaigns.
-
Are we improving marketing performance, or just increasing spend?
-
Which channels and campaigns deliver real revenue, not just leads?
-
Where do conversions drop off in the marketing funnel dashboard?
-
Is rising CAC caused by higher ad spend or weaker conversion rates?
-
Are performance changes short-term fluctuations or long-term trends?
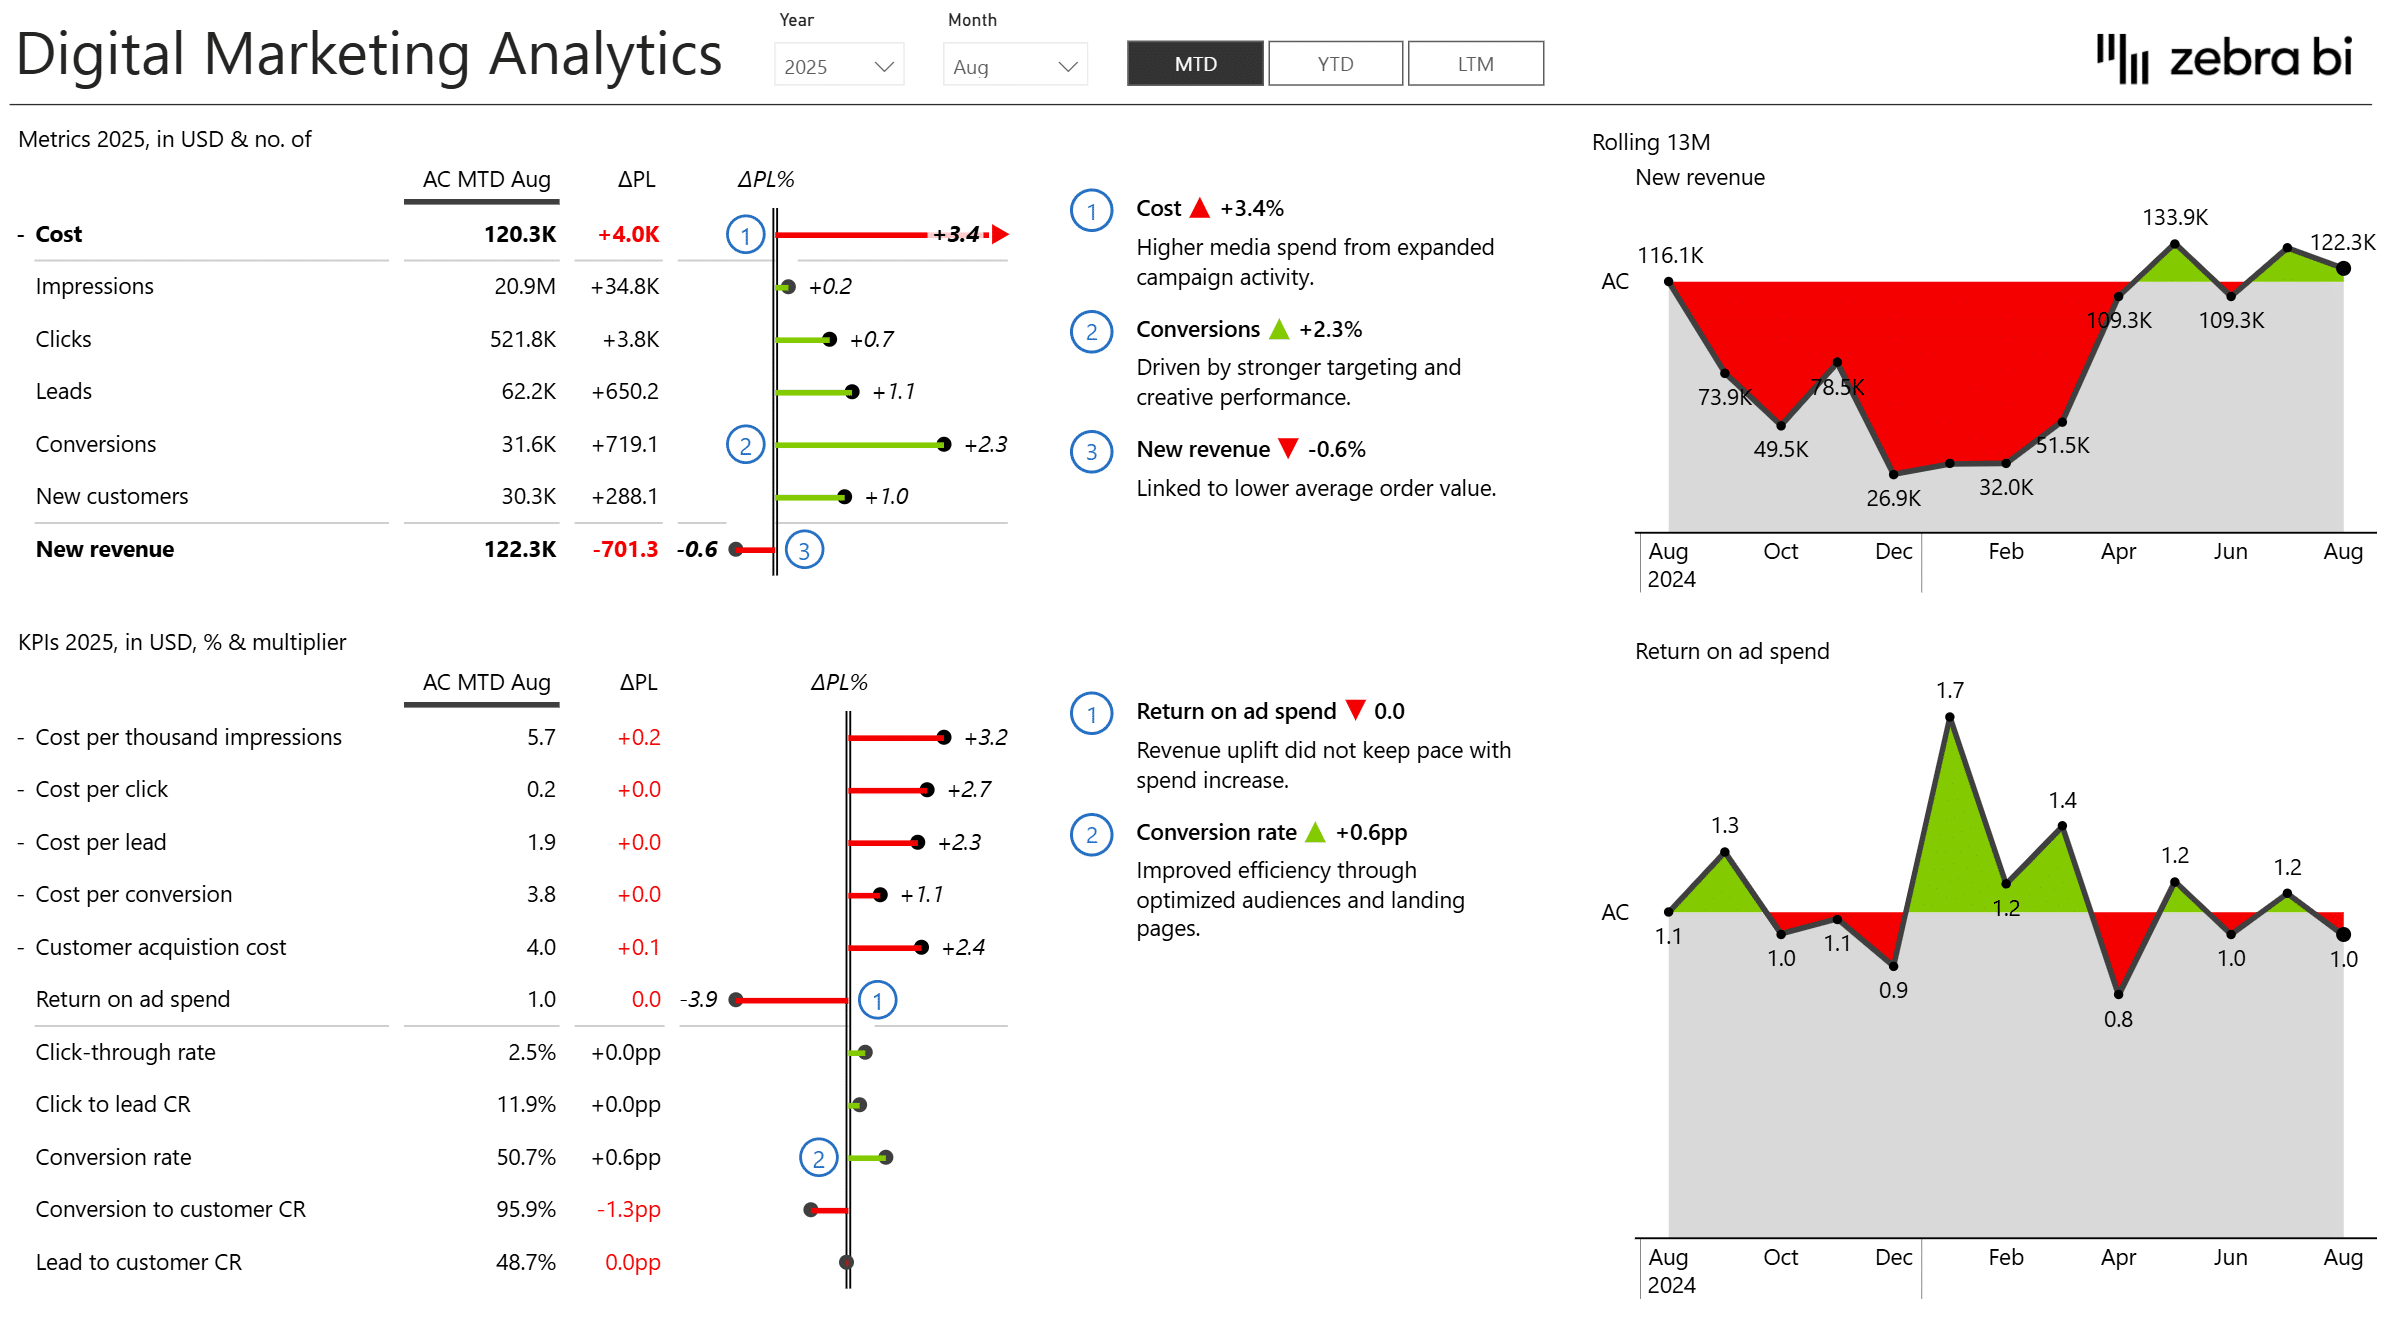
Zebra BI's marketing dashboard supports MTD, YTD, and LTM views, along with rolling 13-month trends, helping you distinguish seasonal effects from structural performance changes.
Who is Zebra BI's Marketing Dashboard for?
This Power BI marketing dashboard template is designed to support both strategic and operational decision-making in one shared view.
- CMOs & executives
Get a high-level view of marketing ROI and efficiency using KPIs like CAC and ROAS, supported by clear variances to plan and prior periods. - Marketing managers & performance marketers
Identify campaign efficiency issues, compare campaign performance side by side, and understand where funnel performance starts to weaken. - Marketing operations & analysts
Analyze the drivers behind key KPIs and determine whether inefficiencies stem from ad spend, traffic quality, or conversion performance.
Marketing insights this dashboard provides:
Here's what you can see once you connect your data into the Power BI template:
-
Compare channel performance across impressions, clicks, leads, conversions, customers, and revenue
-
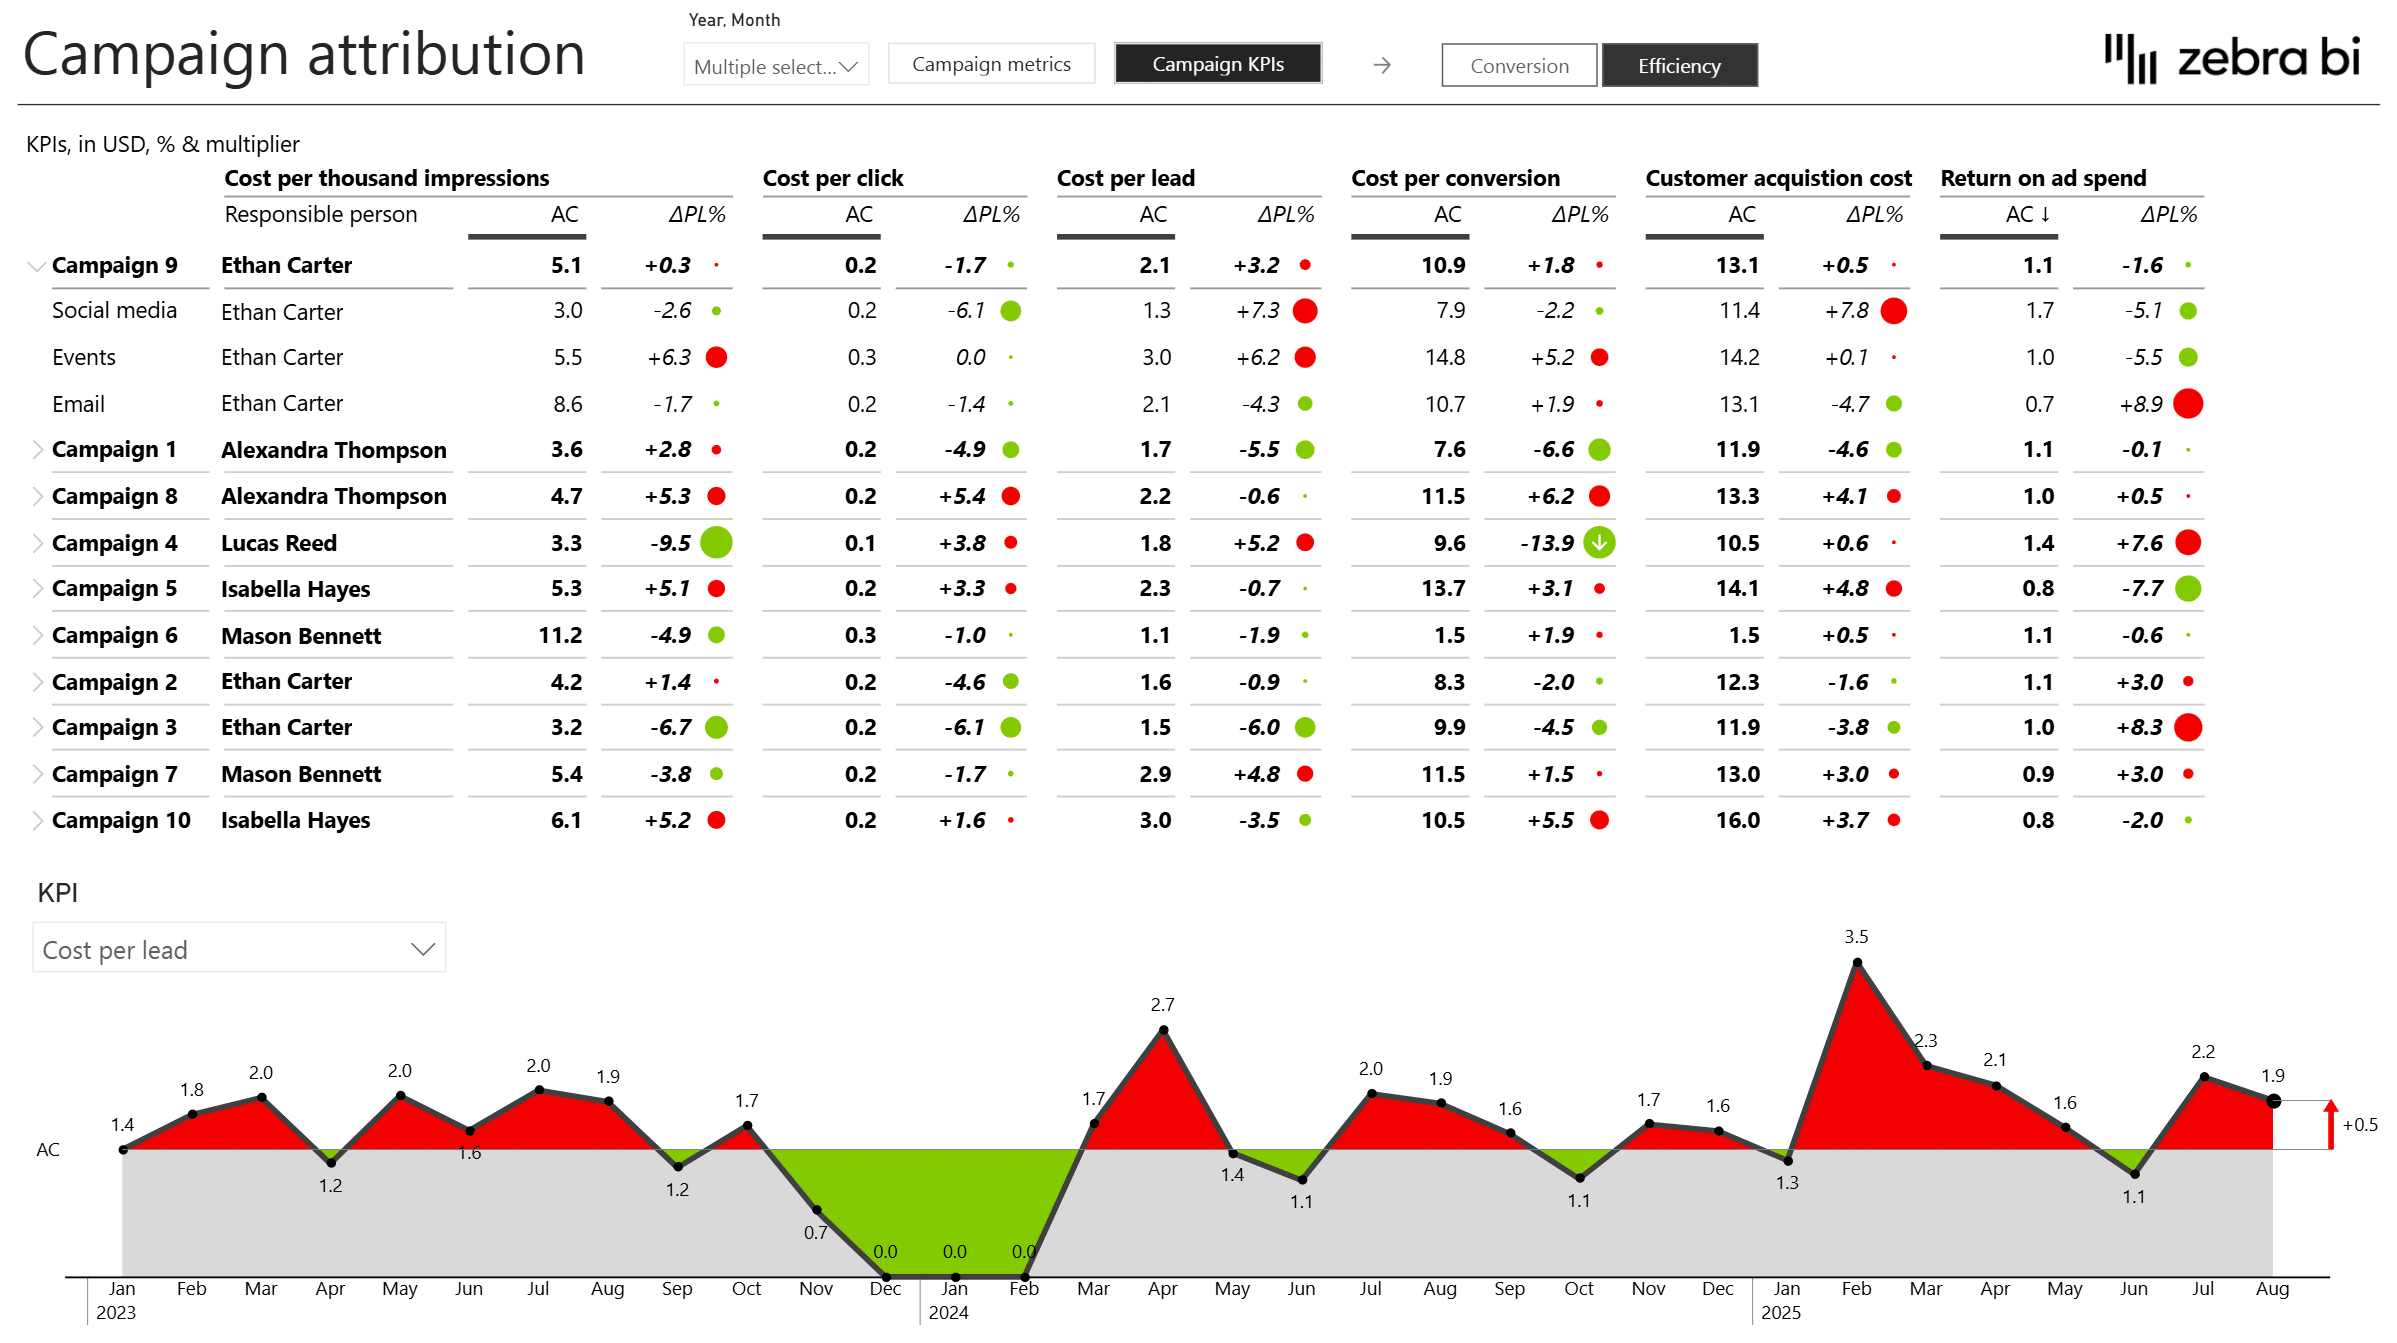
Evaluate campaign performance dashboards with clear ownership and accountability
-
Track marketing ROI dashboards using CPL, CAC, ROAS, and conversion ratios
-
Monitor marketing funnel performance from traffic to customers
-
Analyze multi-channel marketing dashboard trends over time
-
Identify conversion bottlenecks using click-to-lead and lead-to-customer ratios
Built-in variances, difference highlights, and annotations make it easy to explain why results changed and not just that they changed.
What’s included in this Marketing Dashboard template:
This marketing dashboard template includes multiple analytical views, each focused on a core marketing question:
-
Overview
See where marketing stands, with a top-level snapshot of performance, efficiency KPIs, and revenue impact. -
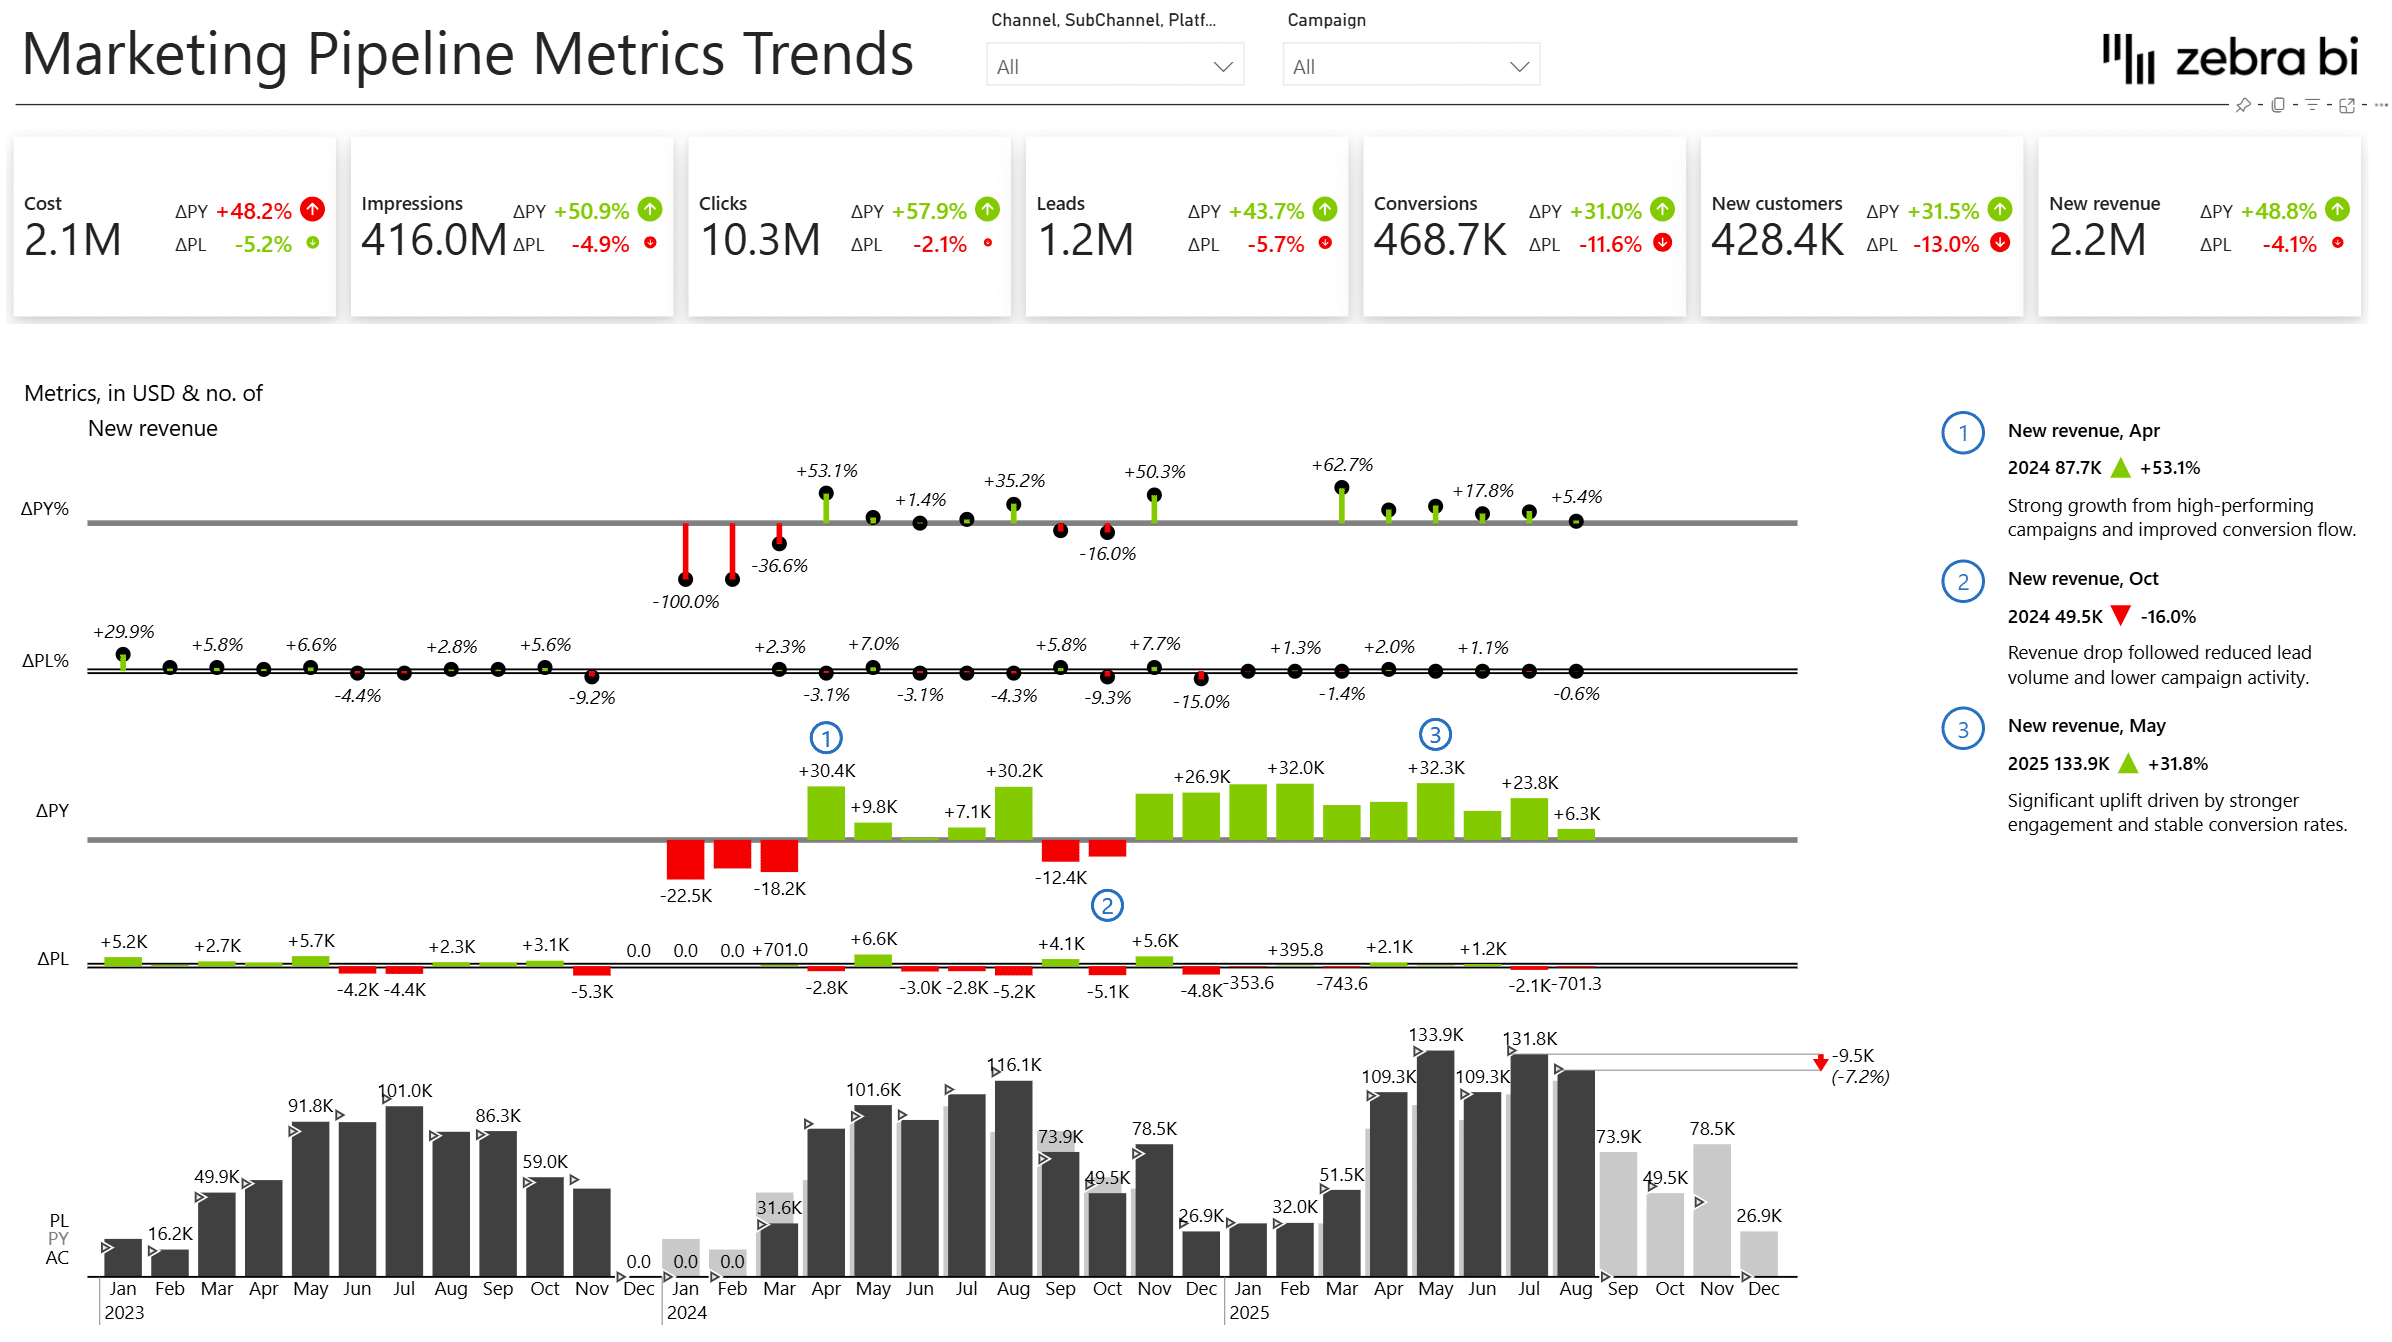
Metrics trends
Watch each number change over time, with longitudinal analysis of individual marketing metrics like cost, leads, conversions, and revenue. -
Pipeline rolling trends
Tell a seasonal dip from a real slowdown, with a rolling 13-month view of the full marketing funnel that tracks stability and momentum. -
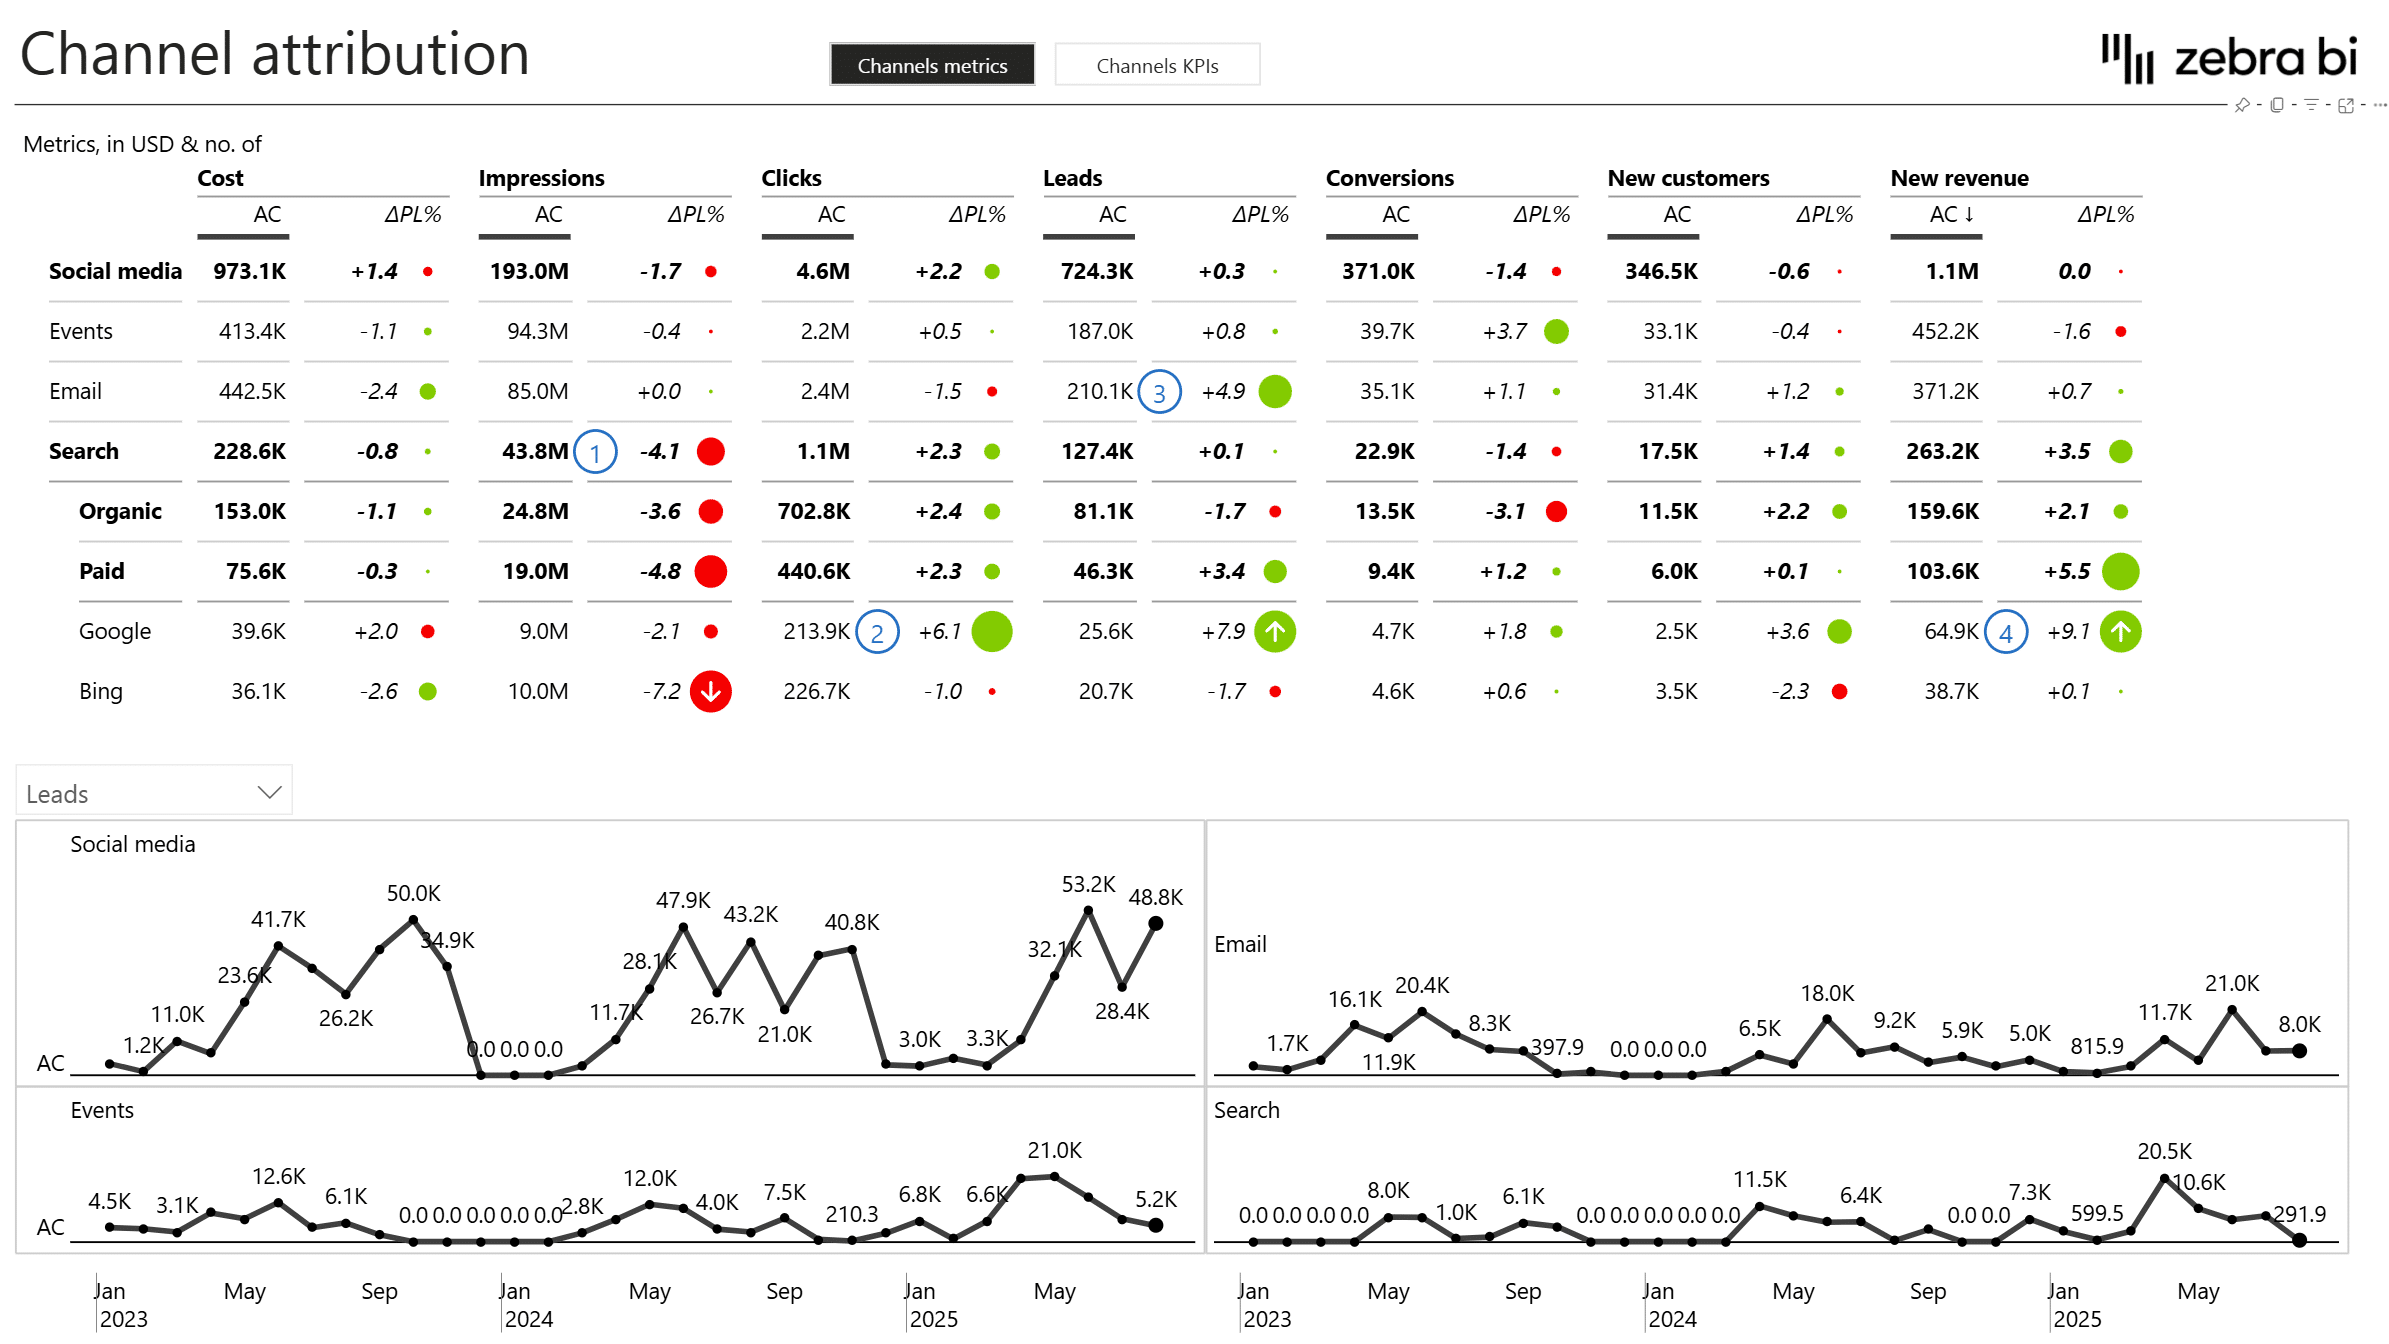
Channels analysis
Find out which channels earn their budget, with a side-by-side comparison across volume, efficiency, and profitability. -
Campaigns analysis
Know exactly who owns what and how it's performing, with a campaign dashboard built for visibility and accountability. -
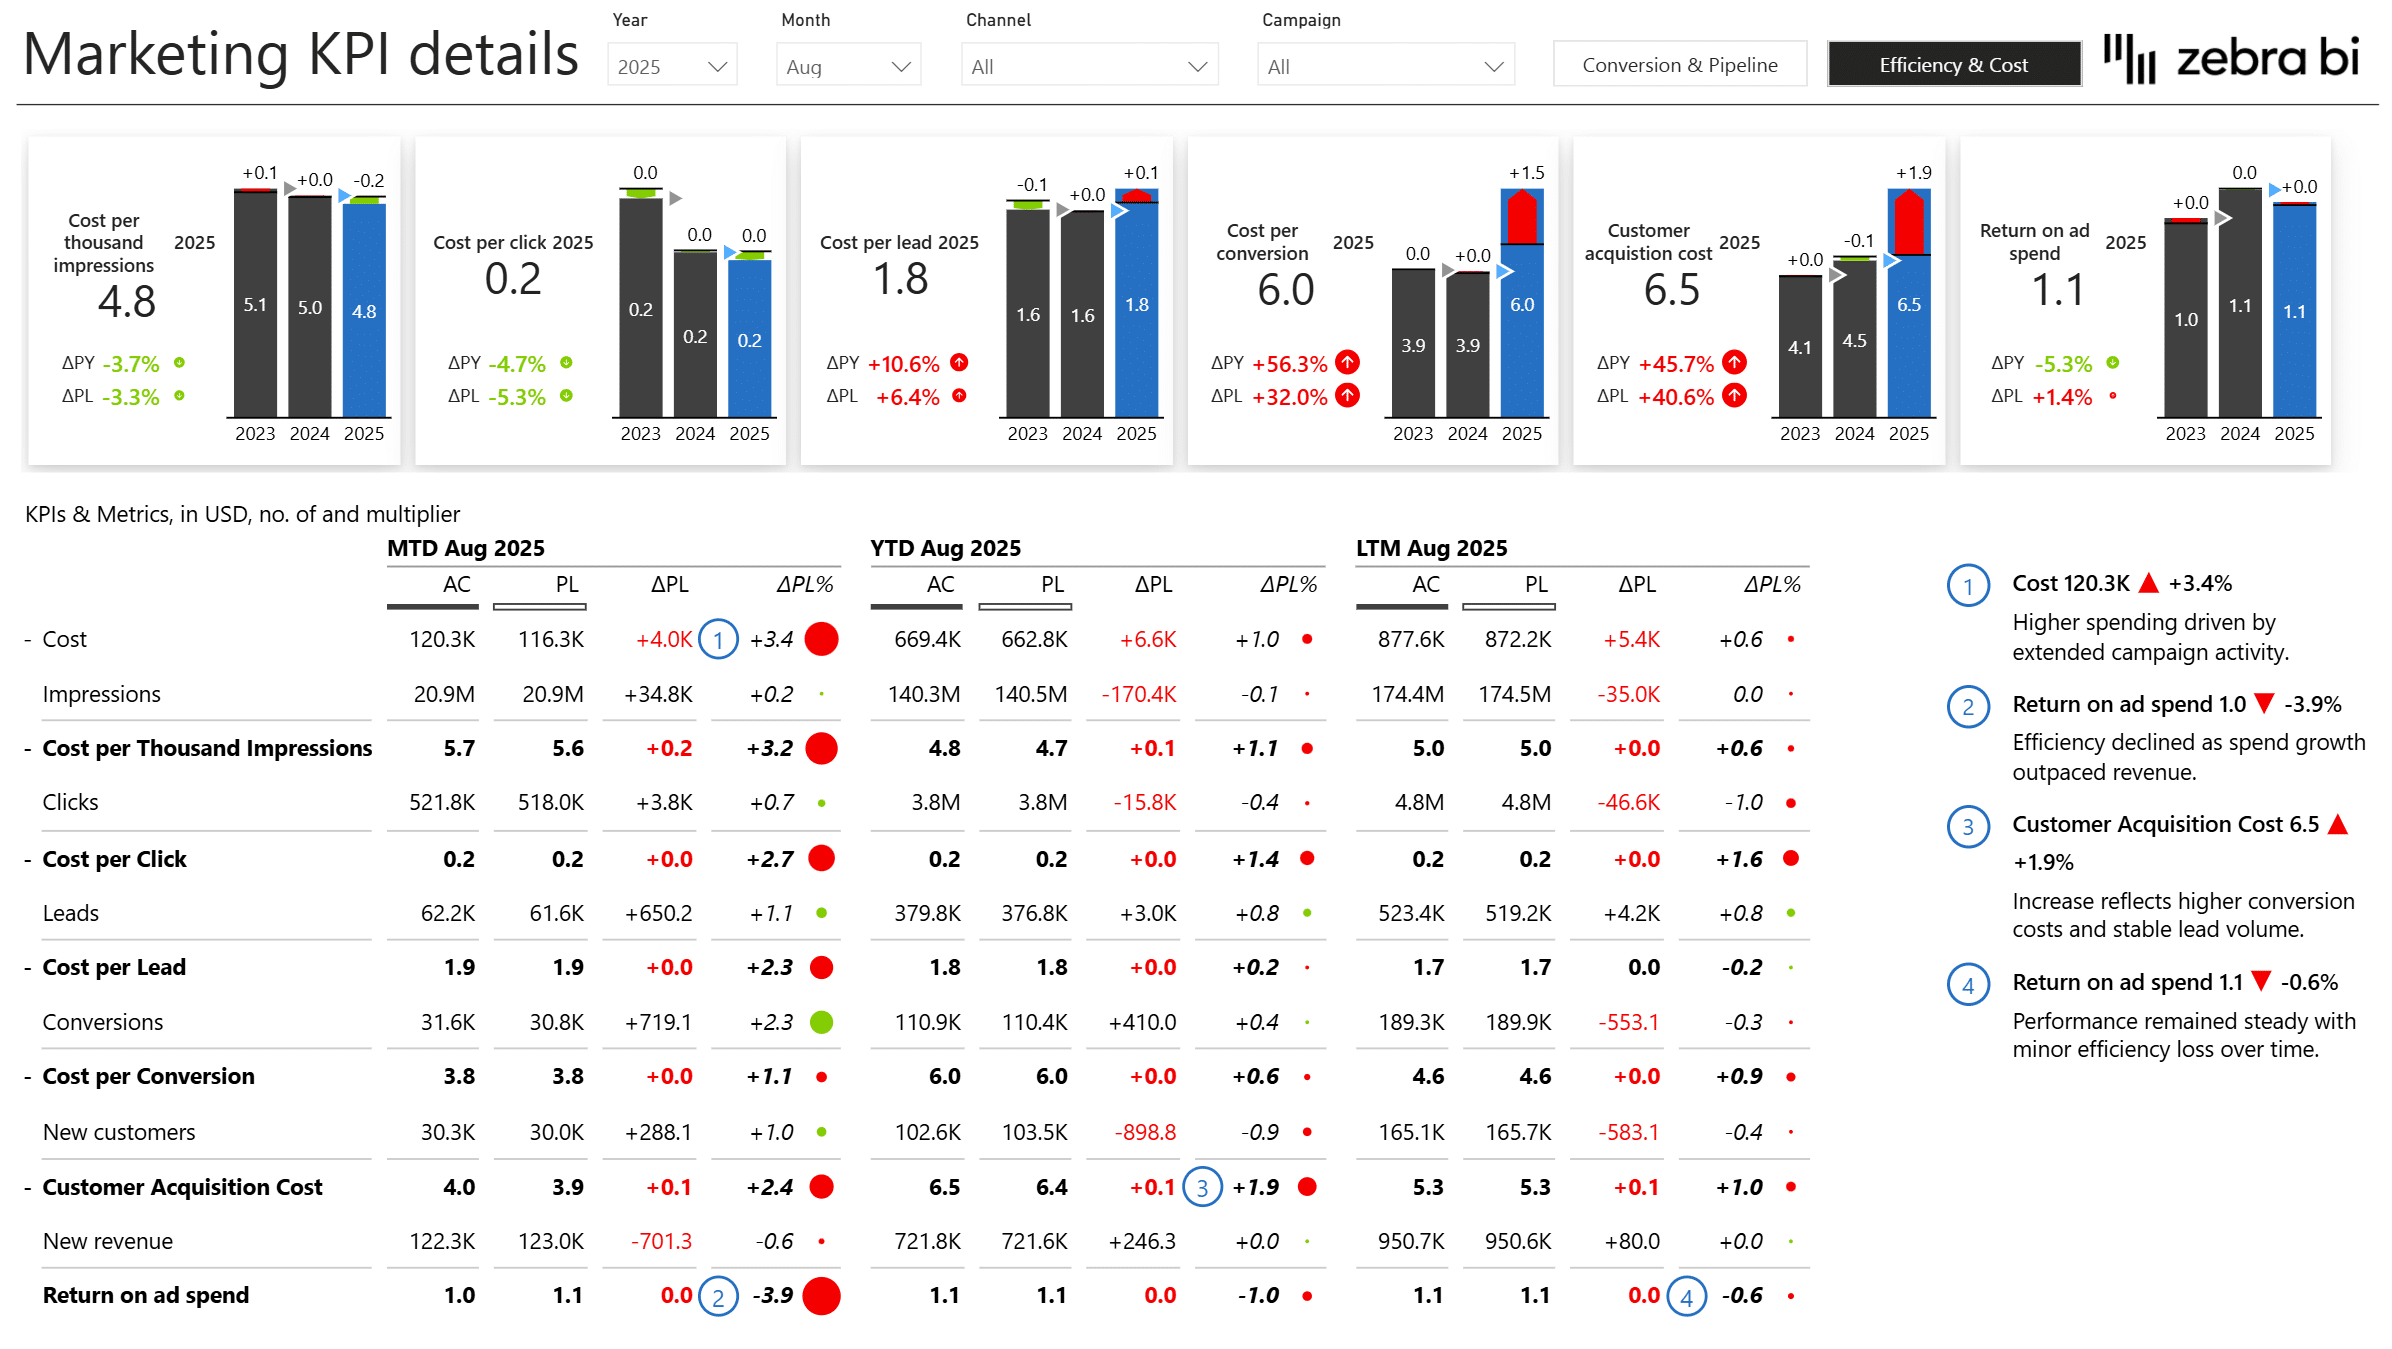
Marketing KPI details
Stop guessing how a KPI was calculated, with transparent breakdowns of CAC, CPL, ROAS, CTR, and conversion rates. -
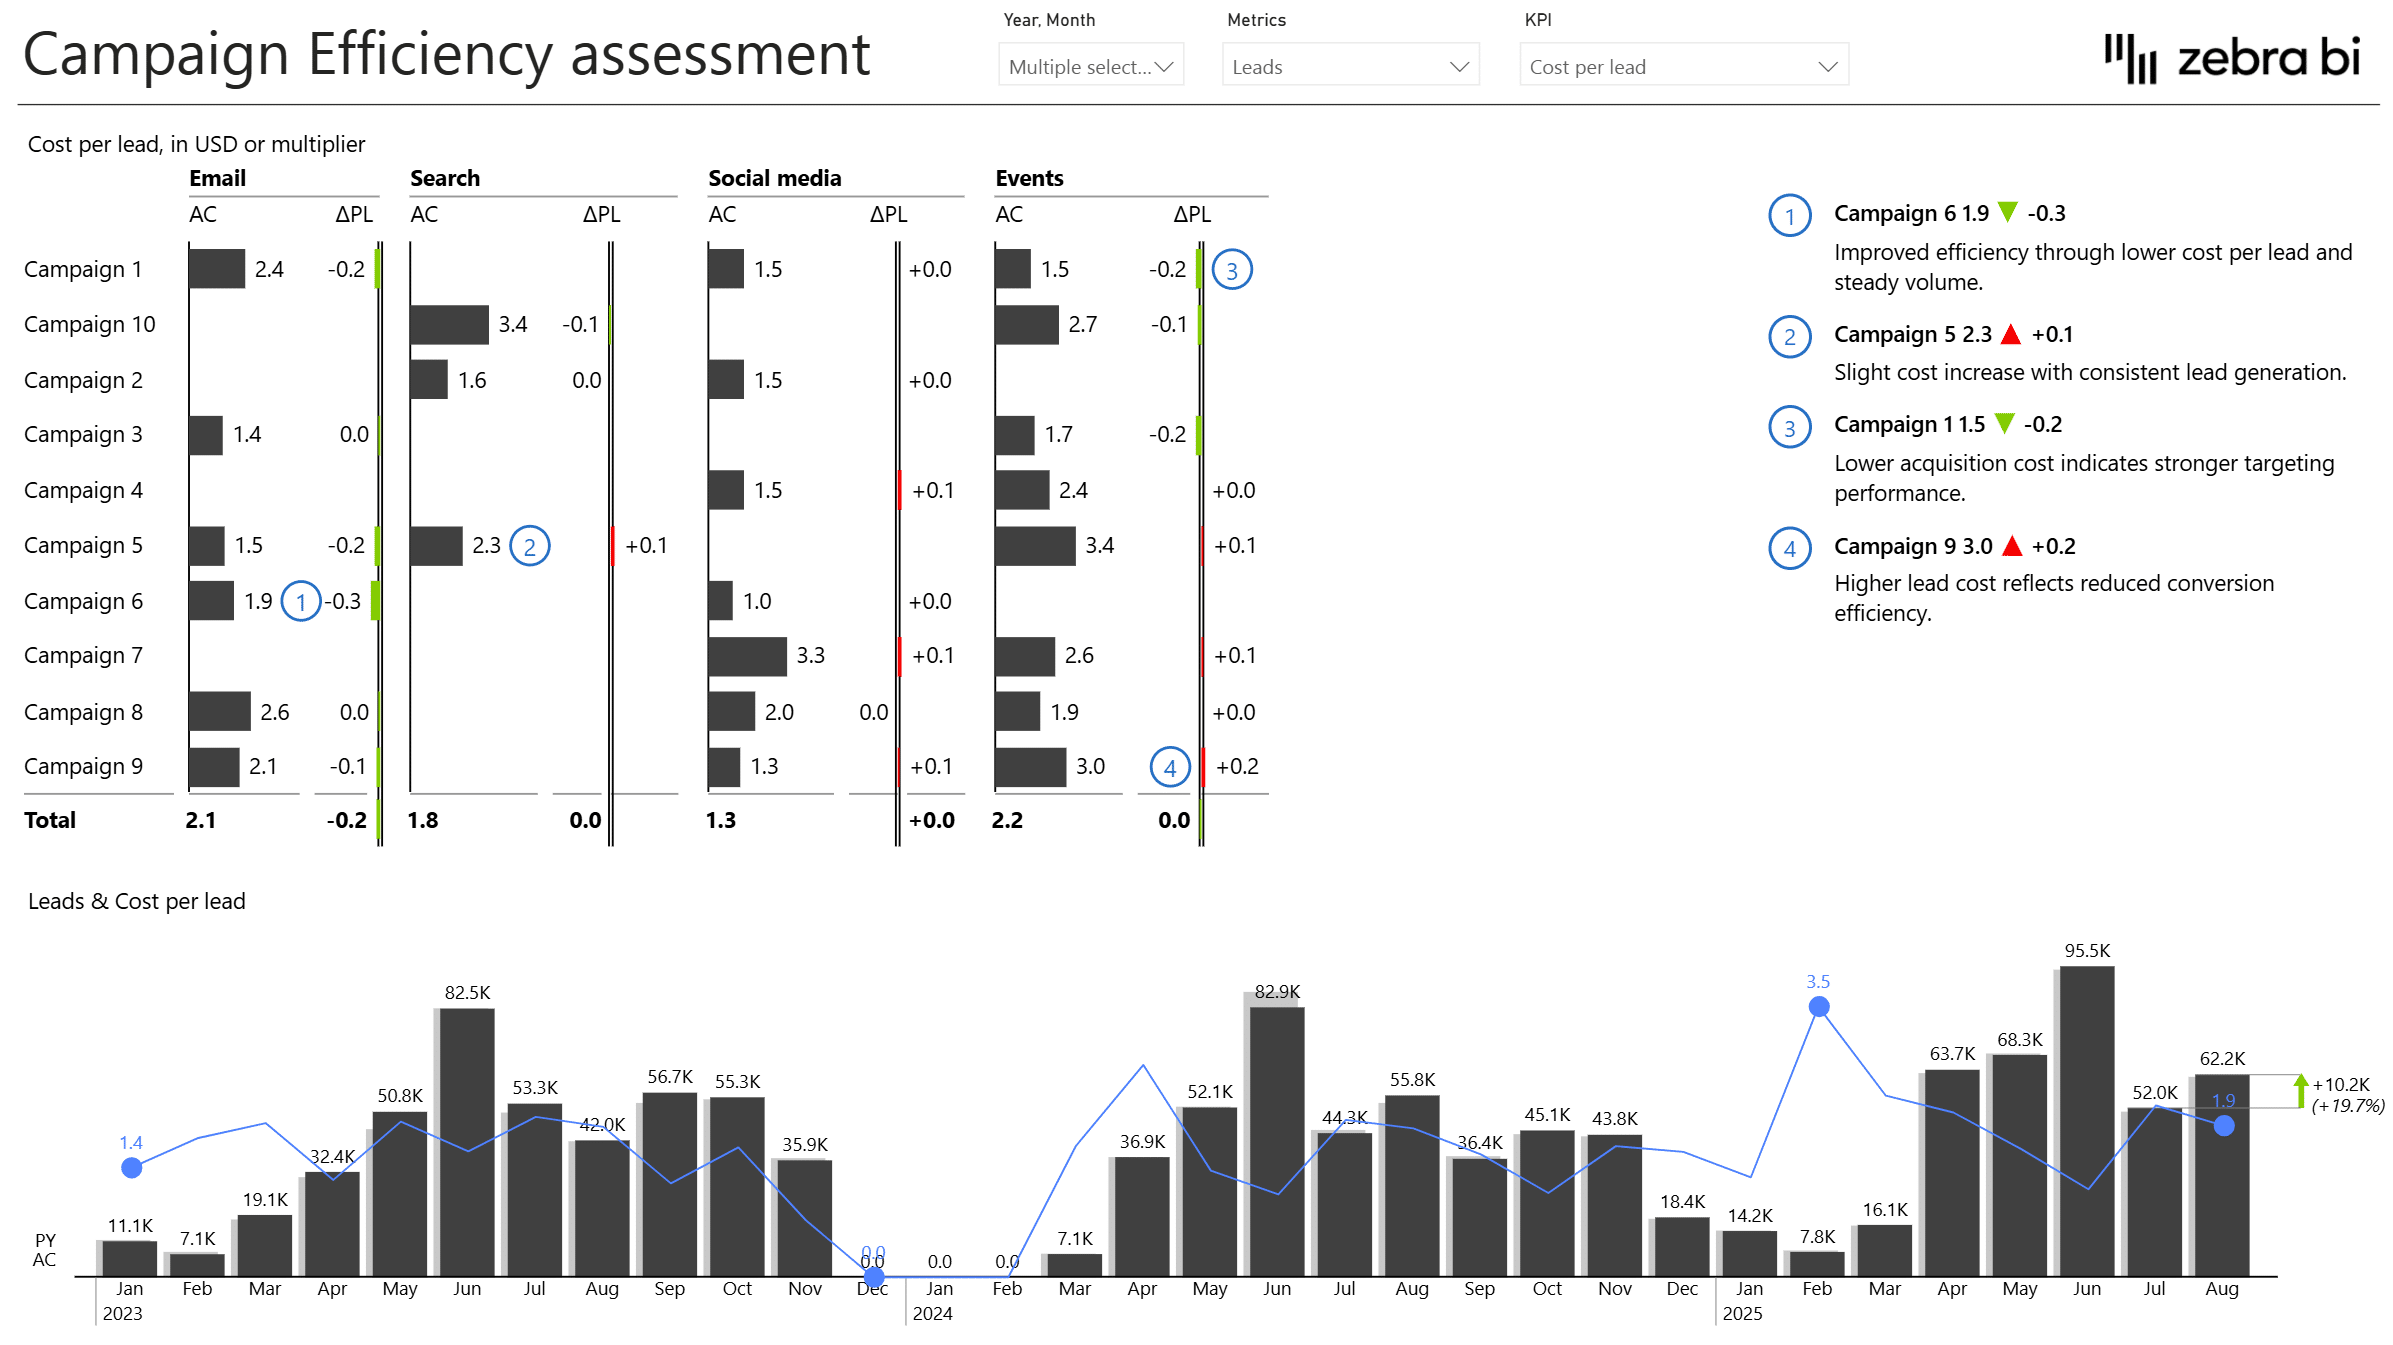
Efficiency analysis
Catch efficiency problems before they become budget problems by spotting which campaigns and channels are improving or declining. -
Conversions analysis
Understand where leads are lost and which activities convert demand into customers.
Built with Zebra BI visuals for Power BI
This Power BI marketing dashboard template is built using Zebra BI Tables, Charts, and Cards so you get:
-
Automatic variance analysis (plan, prior period, prior year)
-
Clear links between ad spend, volume, and conversion efficiency
-
Rolling trend analysis and small multiples
-
Transparent KPI calculations and explanations
-
Annotations and commentary for insight sharing
-
Interactive filtering by channel, campaign, and time
You can focus on insights and decisions instead of formatting or manual calculations.
Download the Marketing Performance Dashboard template
If you’re looking for a practical marketing dashboard template in Power BI that connects ad spend, campaign performance, funnel metrics, and ROI, this dashboard provides a ready-to-use foundation you can work on.
Download the Marketing Performance Dashboard in Power BI and start analyzing what truly drives marketing results.
Get started in 3 steps
Fill out the form and get the Power BI template