Income statement templates for Excel
Overview
All templates are crafted using the latest reporting best practices. Find the one that suits you best and visualize your data in a way that delivers immediate business insights and inspires action. Not sure which one to choose? Take a look at what they offer below.
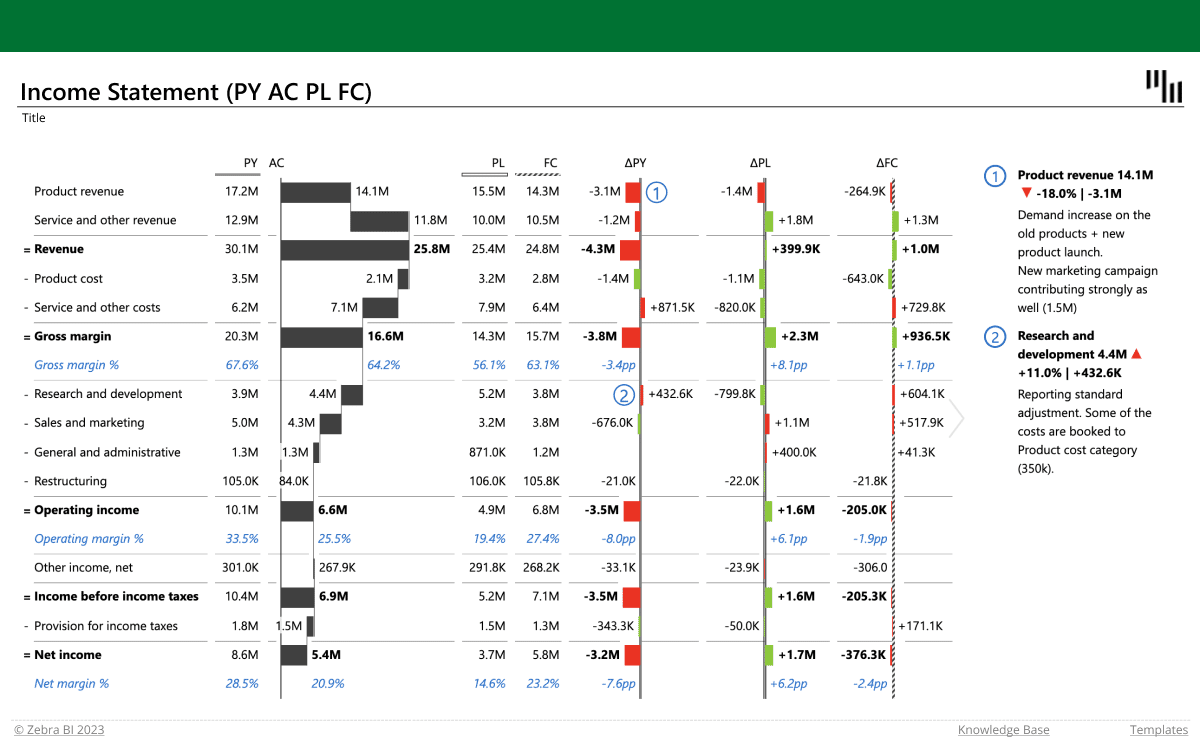
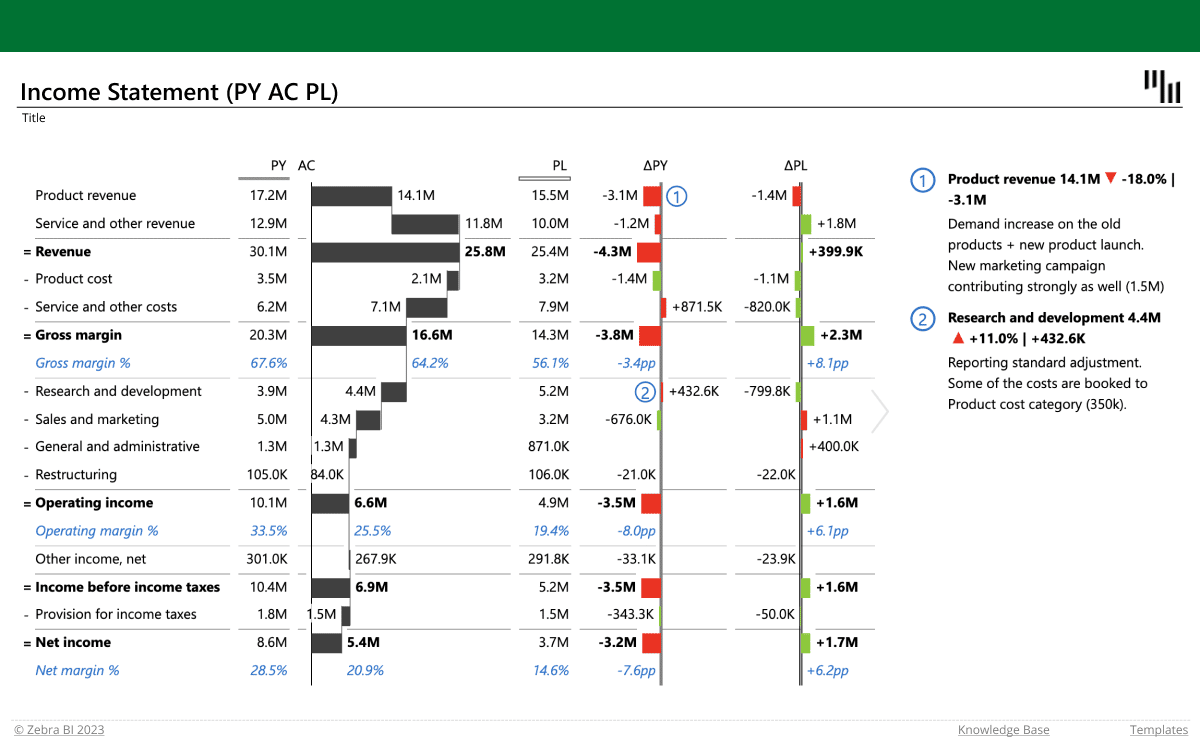
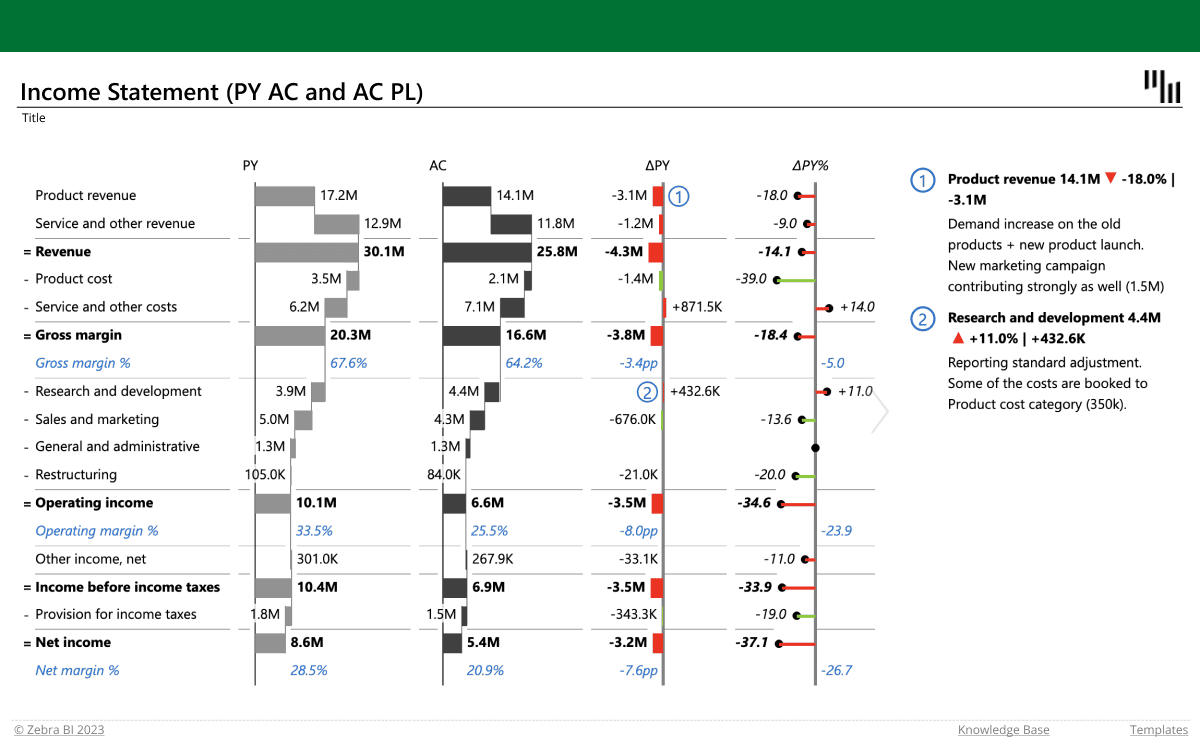
Income statements with basic comparisons (up to 3 measures)
These income statement templates for Excel allow you to compare your actual results (AC) with up to 3 measures (previous year = PY, plan = PL and forecast = FC). They come in 3 different versions: PY-AC-PL, PY-AC and AC-PL, and PY-AC-PL-FC. Use them to visualize your data in the form of tables with integrated waterfall charts, taking advantage of unique features like custom calculations (invert/result), formula manager for calculating new data elements, and dynamic comments. They also display absolute and relative variances that are calculated automatically.
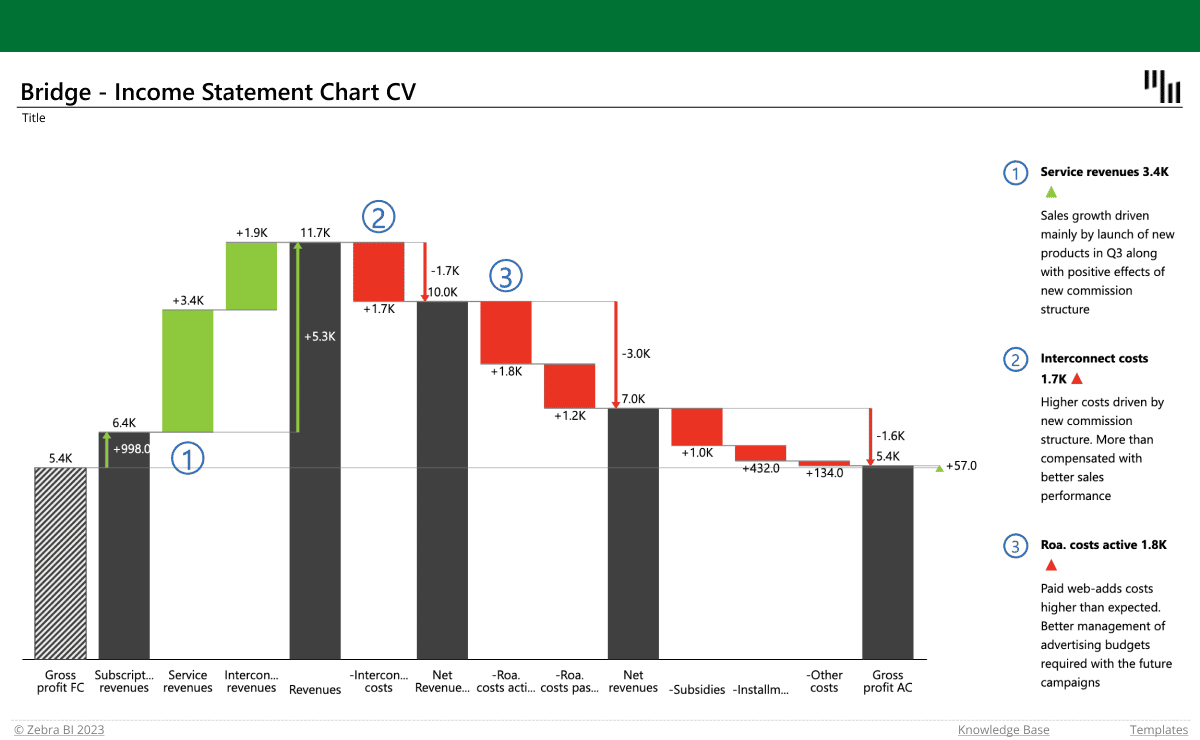
Income statement with a bridge chart
This waterfall-chart-based template will help you visualize your profit & loss data and keep track of the trends. Use the template to quickly show how different accounts contribute to the total value, invert the costs and see which account has the biggest impact on your business. The visual automatically calculates and displays the variances, highlights subtotal differences and allows you to add dynamic comments for more context.
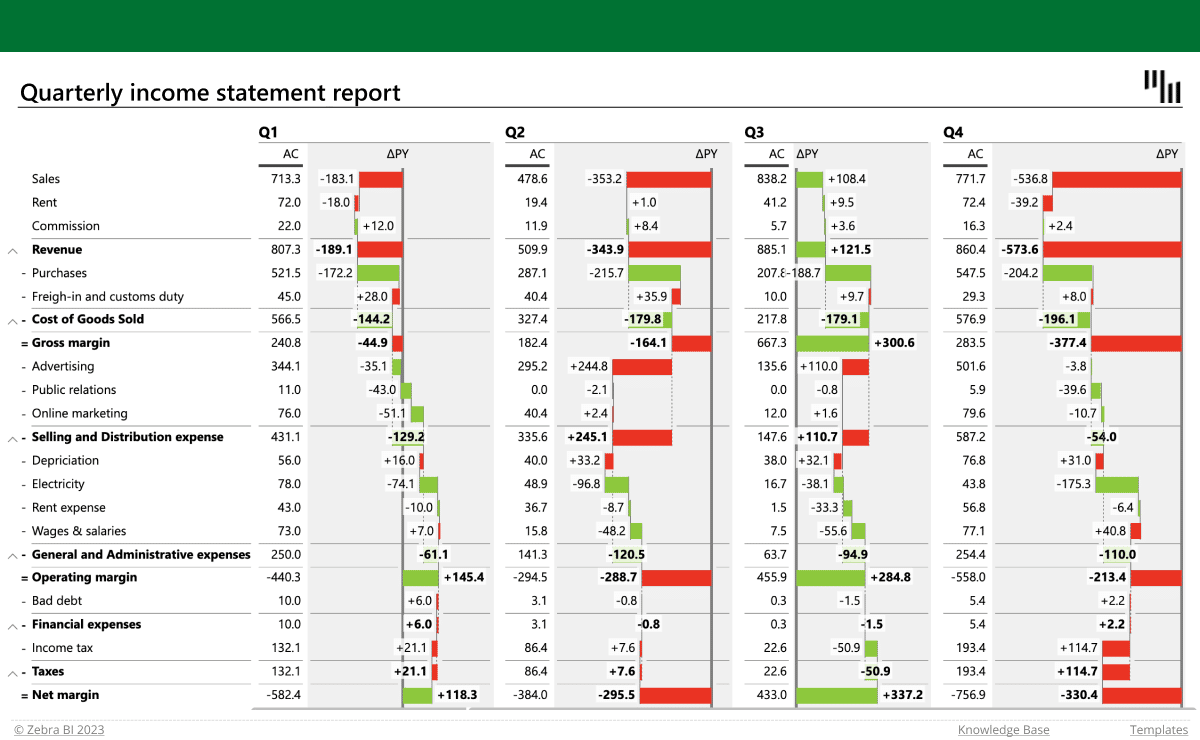
Quarterly income statement
This template allows you to break your profits and losses into quarters and track them across channels. The time dimension and automatically calculated relative and absolute variances are displayed in columns which can be hidden for the purpose of greater clarity. You can expand and collapse the rows to adjust the level of detail, use the formula manager to calculate new data elements or take advantage of custom calculations to invert the negative accounts or mark them as results.
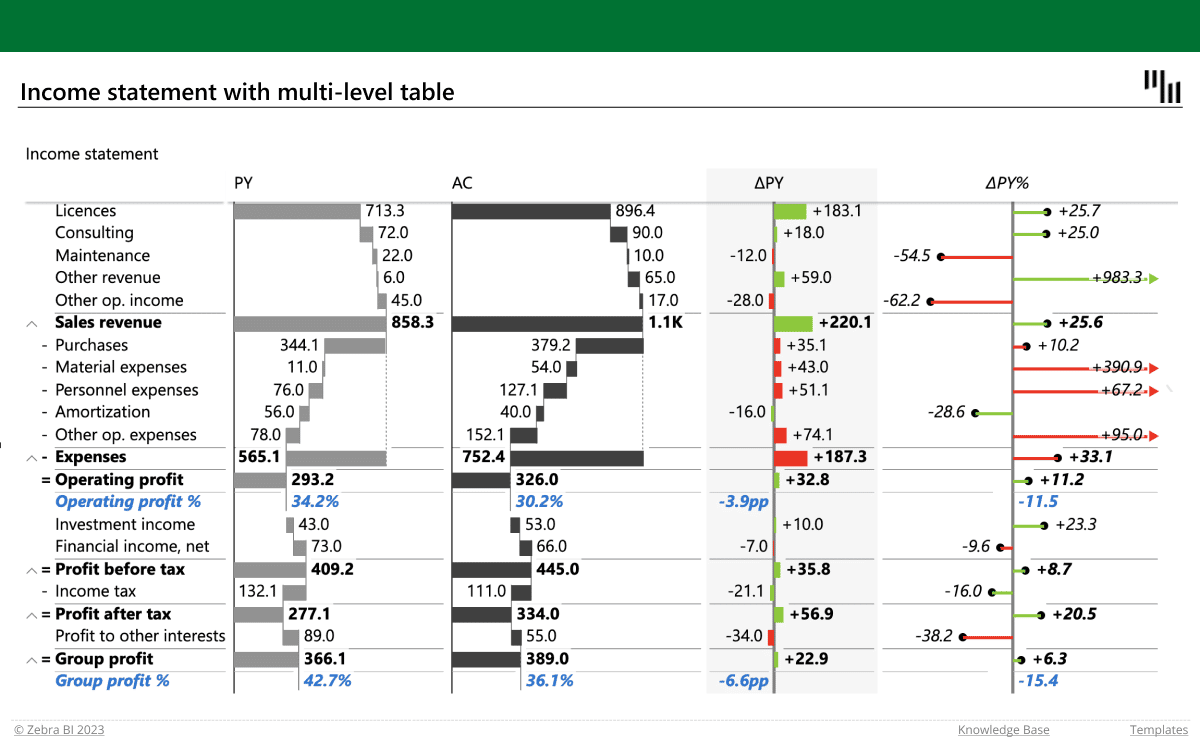
Income statement with multiple levels
Dealing with complex operations? Use this template to visualize multiple levels of data. Insert your numbers into a pivot table and dive deeper into the details of each category by using the expand & collapse functions. Calculate additional data elements with the formula manager and use custom calculations (invert, result) to display your accounts the right way. Take advantage of the automatically calculated variances and multiple comparisons to get your questions answered in no time.
These income statement templates for Excel are super easy to use! Check out the short video below and see for yourself.


