SaaS Sales Power BI Dashboard Template

Overview
SaaS reporting has just become easier!
Get everything you need for actionable insights in one dashboard. Built with Zebra BI visuals, this SaaS dashboard Power BI template delivers clarity and value for finance, operations, and growth teams in Software as a Service businesses.
Our team of BI specialists created this template with SaaS-tailored performance indicators in mind (such as Monthly Recurring Revenue, Annual Recurring Revenue, and Churn Rate, so you can make better, more data-driven decisions.
We all know how fast SaaS businesses have to move to stay on top of the game. As such, effortlessly tracking recurring revenue streams and spotting retention issues before they escalate is absolutely essential—and so is knowing with precision what your customer acquisition rate is.
The built in performance metrics in this template will reveal what's happening under the hood of your business and how your finance, operations marketing, customer success, and sales team can supercharge your business strategy, sales strategy, and communications for better results.
Zebra BI visuals make every report IBCS-compliant, ensuring charts and tables are always clear and consistent. This way, your whole organization can easily interpret data and make informed, confident decisions. From your account managers to your customer support, your entire business will know exactly where to look, and how to use the data in your performance metrics to:
- Make the sales process more efficient
- And create the kind of customer experience people love.
This template provides you with more than an Excel spreadsheet. It is an interactive and customizable single source of truth with all the dashboard components, tables, and chart styles you need to draw better business and customer insights from your data.
Filter your sales analytics data by cohorts, add KPIs that make sense for your business, adjust visuals the way you want them—all so you can highlight key metrics and tailor your dashboard views to match your SaaS goals and workflows.
Simplify your reporting process while focusing on decisions that drive results.
What you get with this SaaS Power BI template
This Power BI SaaS dashboard template is packed with features to enhance performance tracking and decision-making for users at every level:
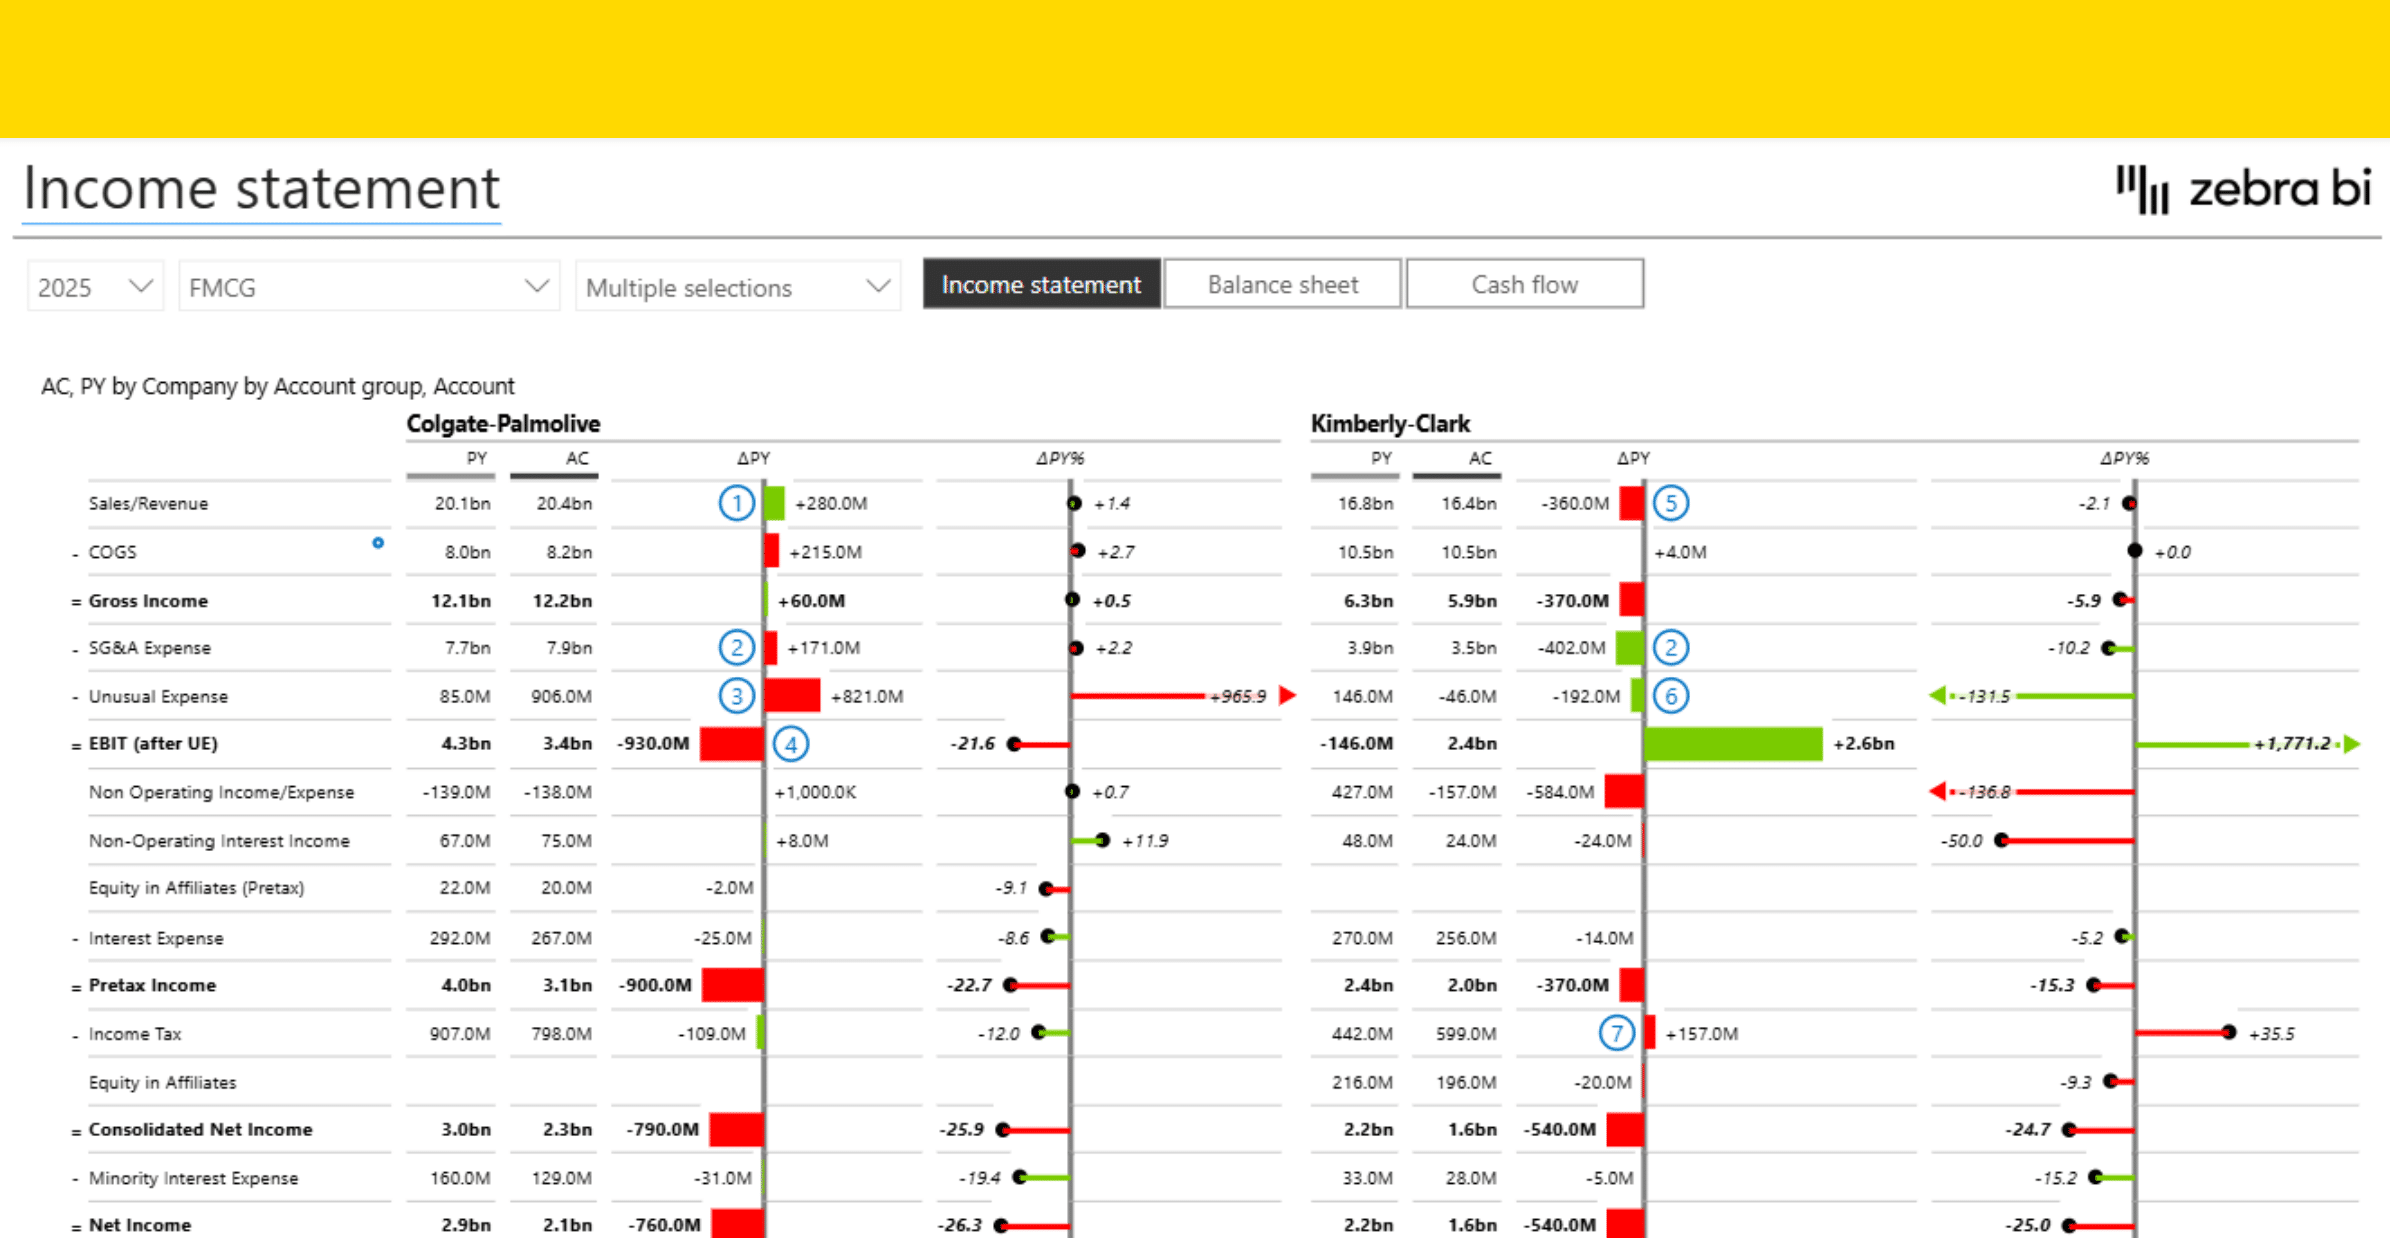
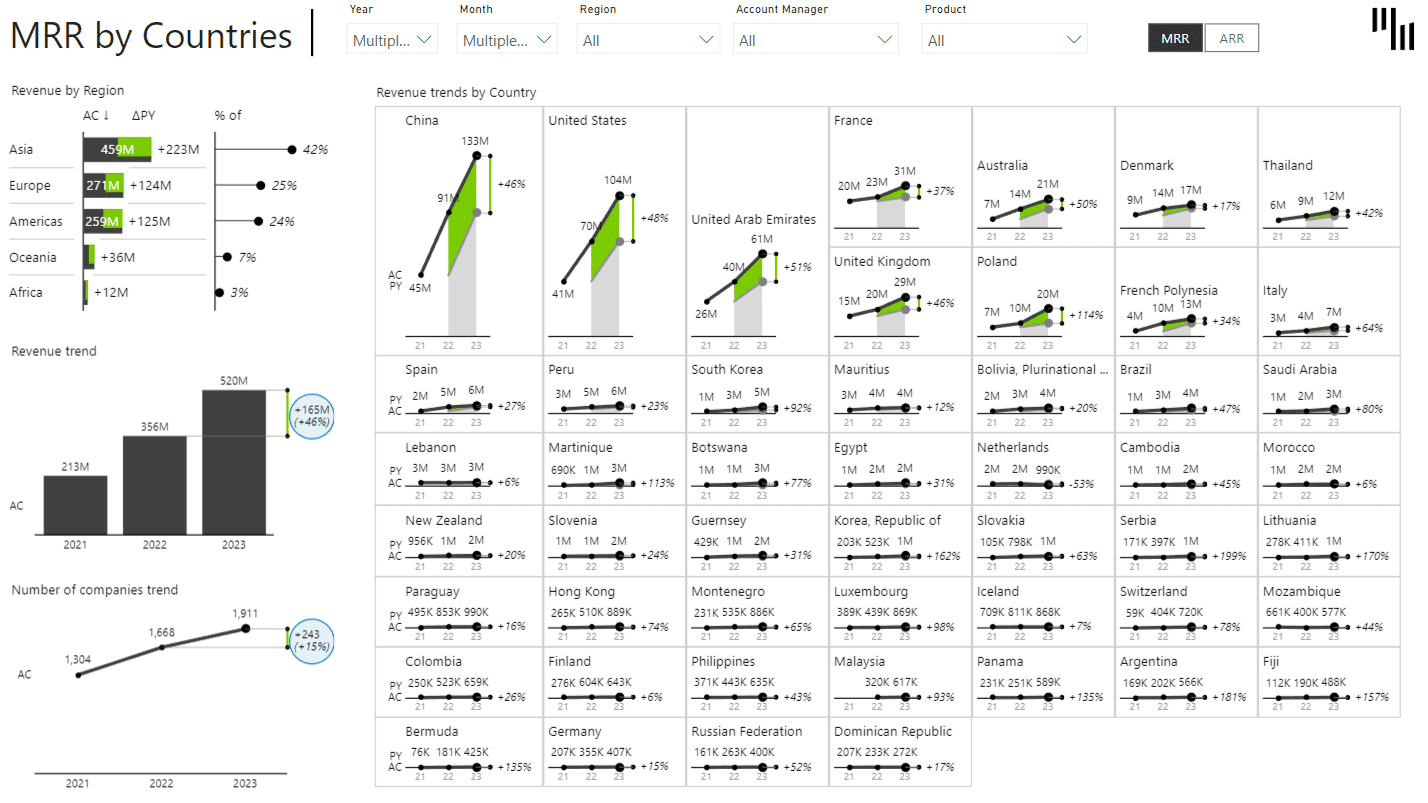
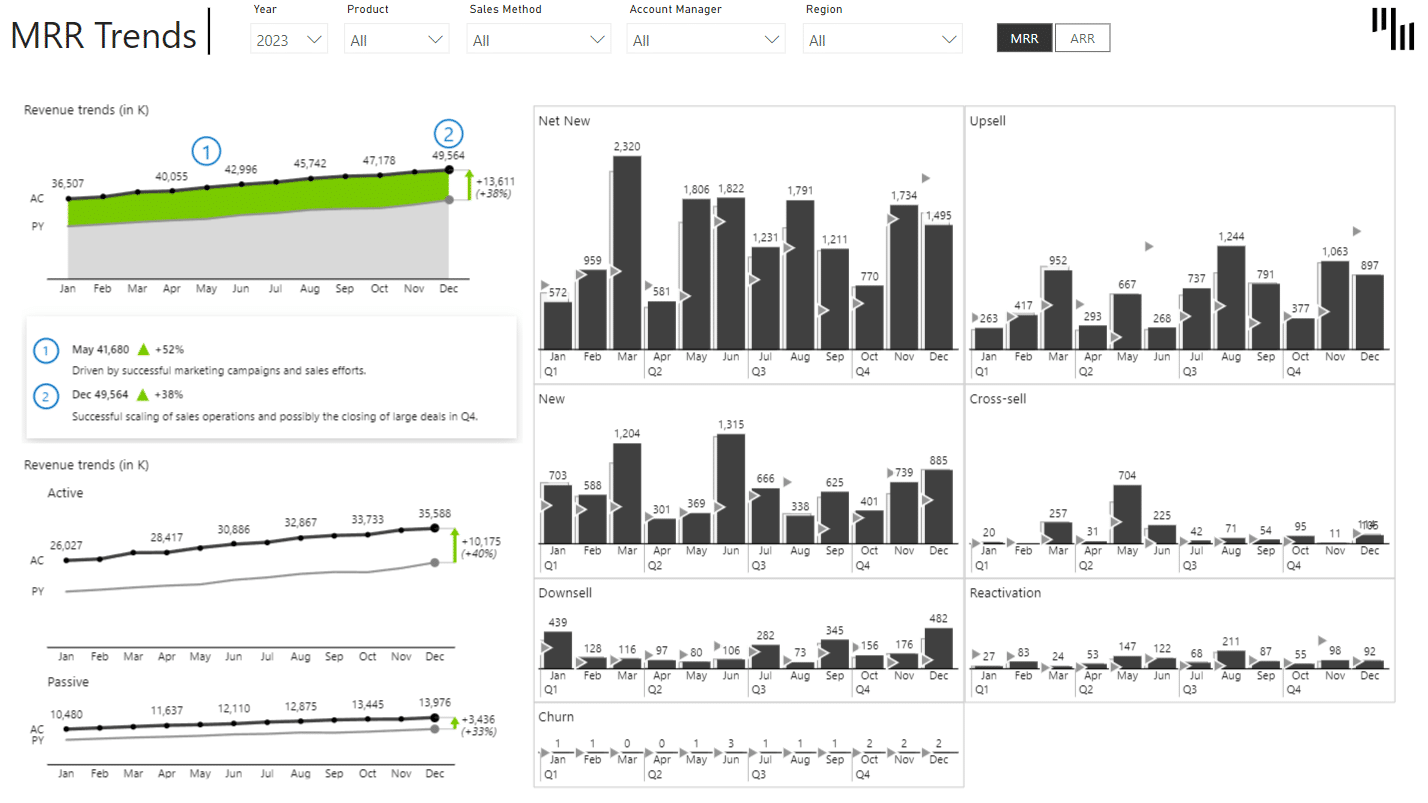
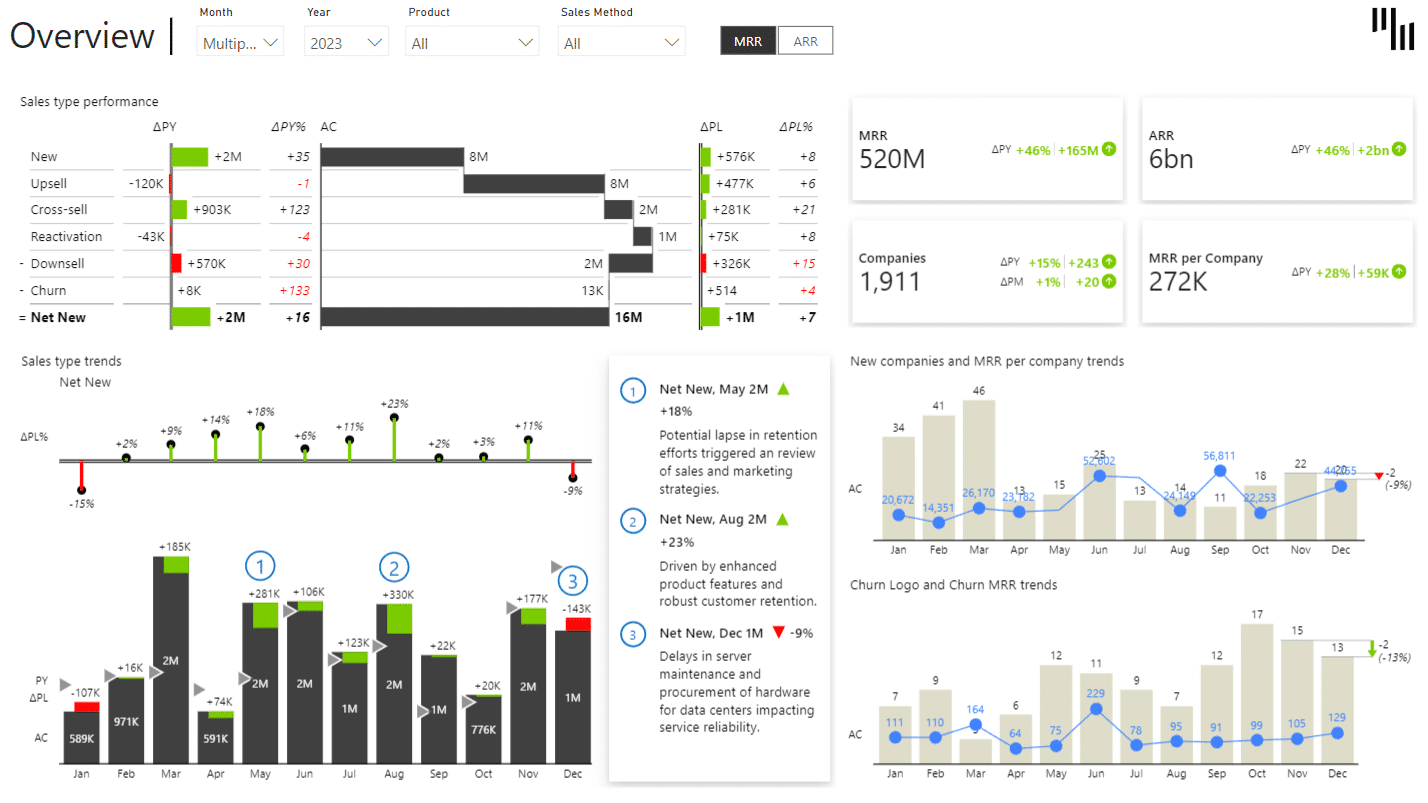
- Track essential performance metrics, like MRR and ARR trends, with built-in variance explanations, so you quickly see what drives revenue changes.
- Visualize subscription growth and contraction over any period with waterfall charts, so you can easily explain net changes to your team and stakeholders.
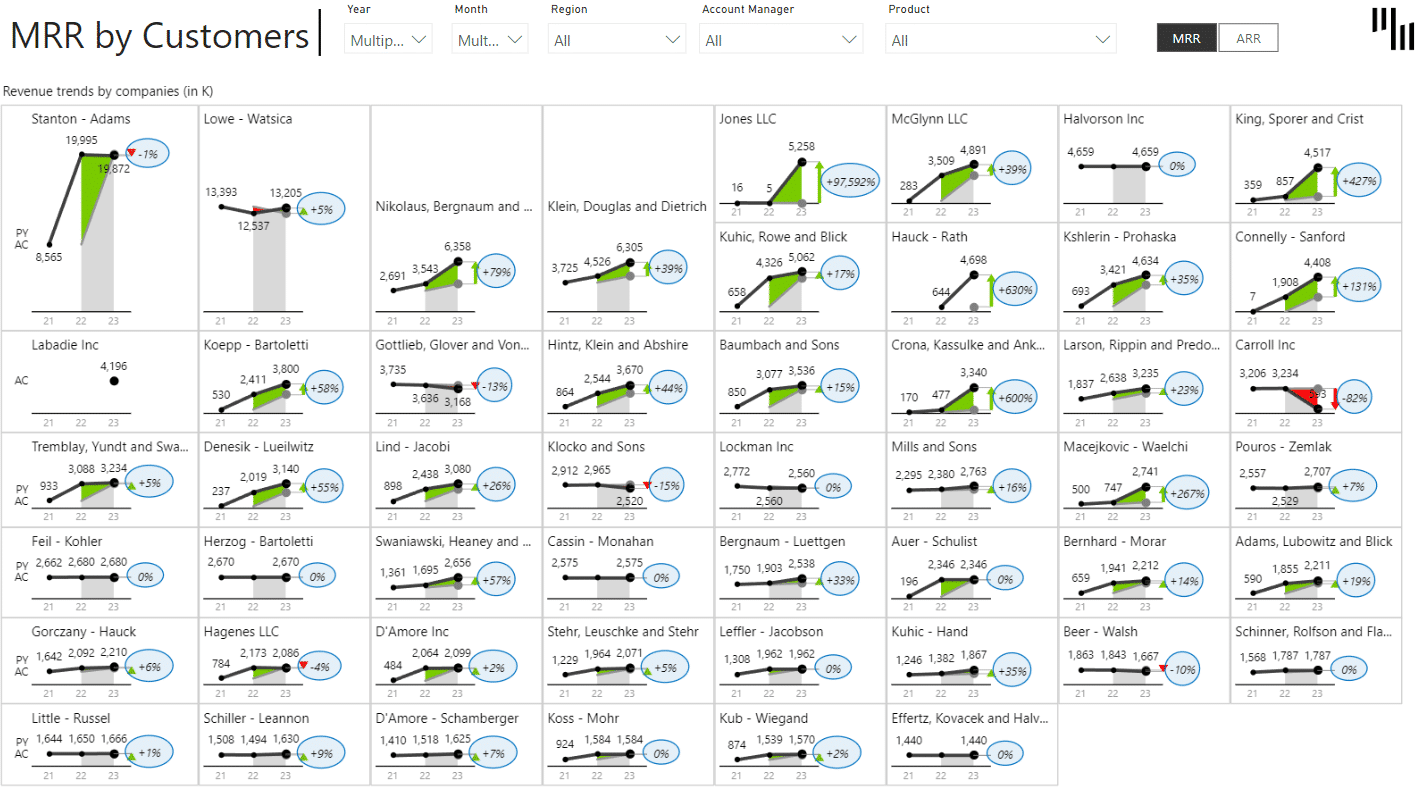
- Analyze churn and retention by cohort, segment, or plan to quickly spot patterns and at-risk groups so you can take targeted action and boost long-term growth.
- Compare performance metrics with built-in benchmarks for instant insight into acquisition efficiency. Quickly spot which strategies work, optimize spending, and drive SaaS growth.
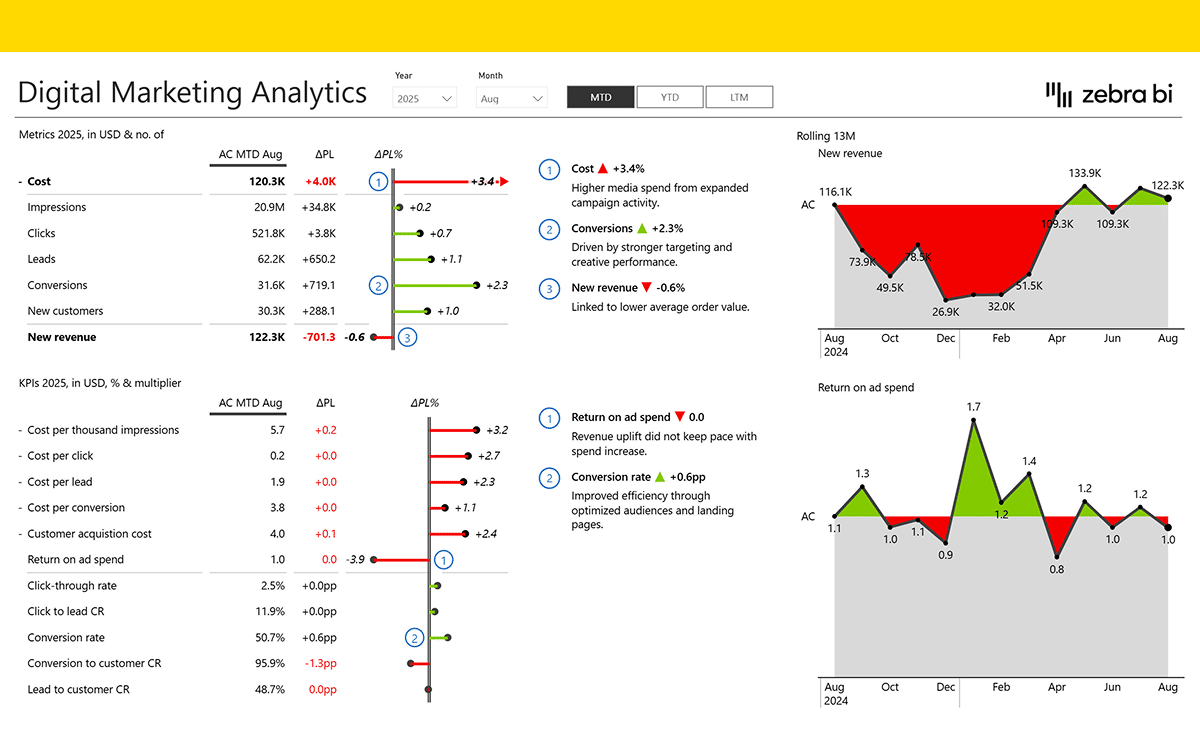
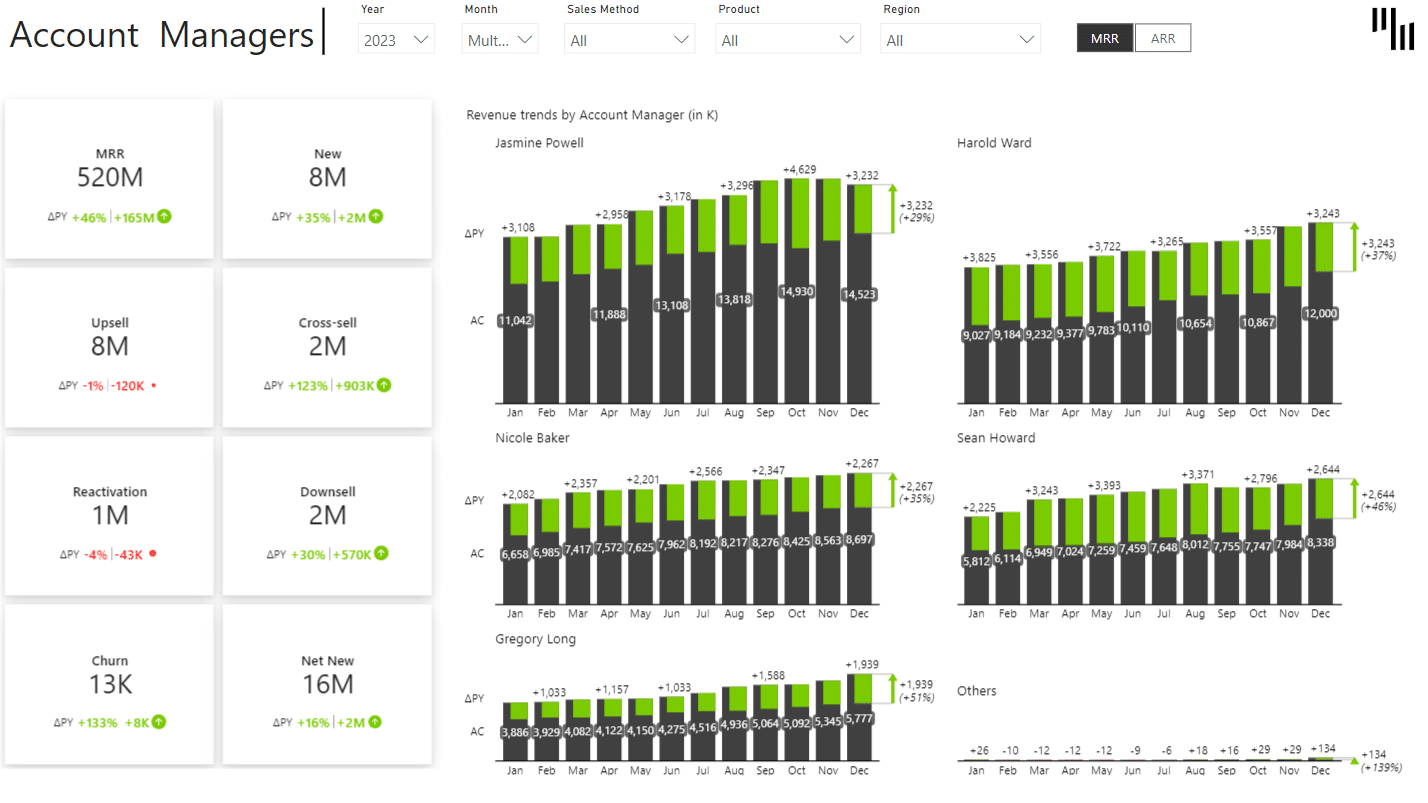
- Use intuitive drill-throughs, interactive slicers, and dynamic comments to explore trends by segment, plan, or time and quickly add context. Transform static reports into a source of real, actionable insight.
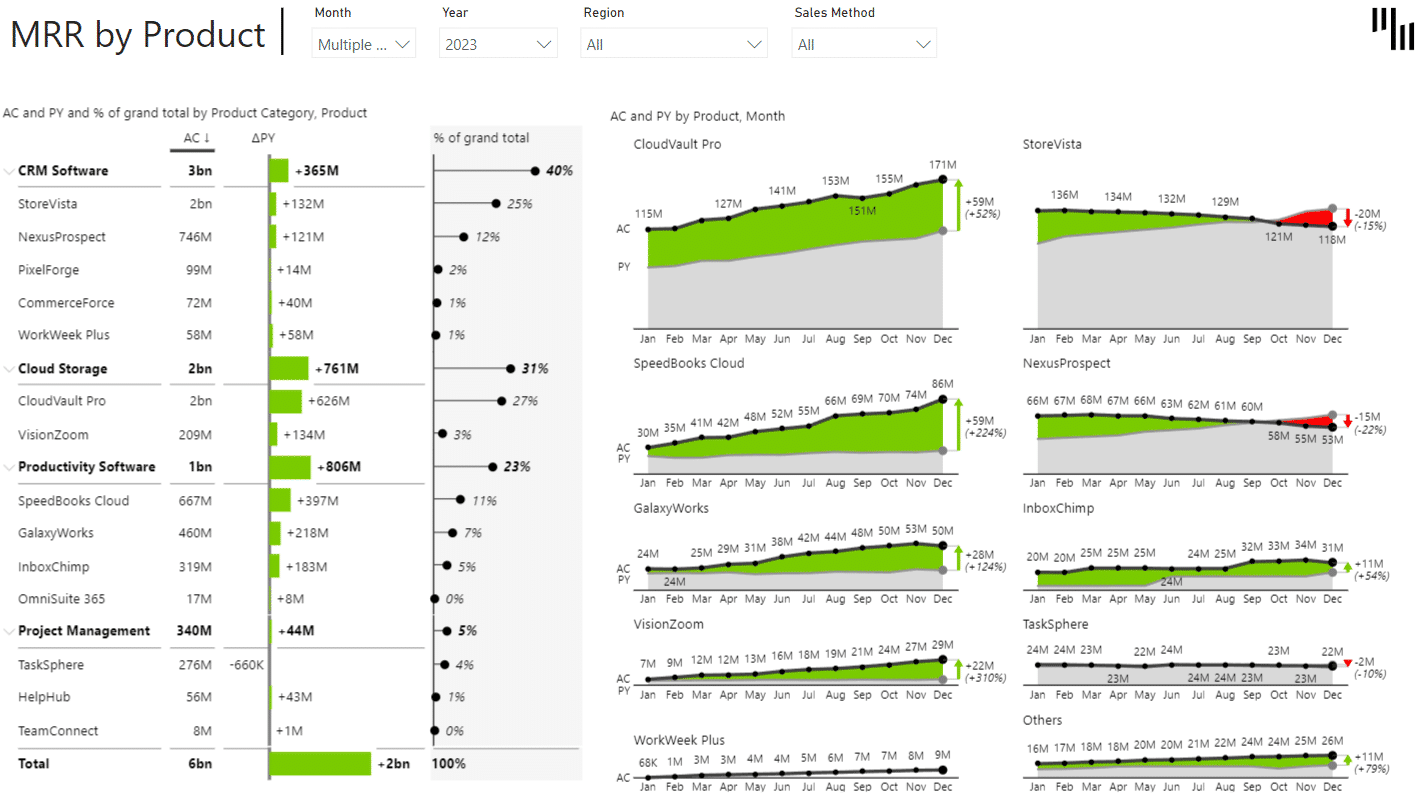
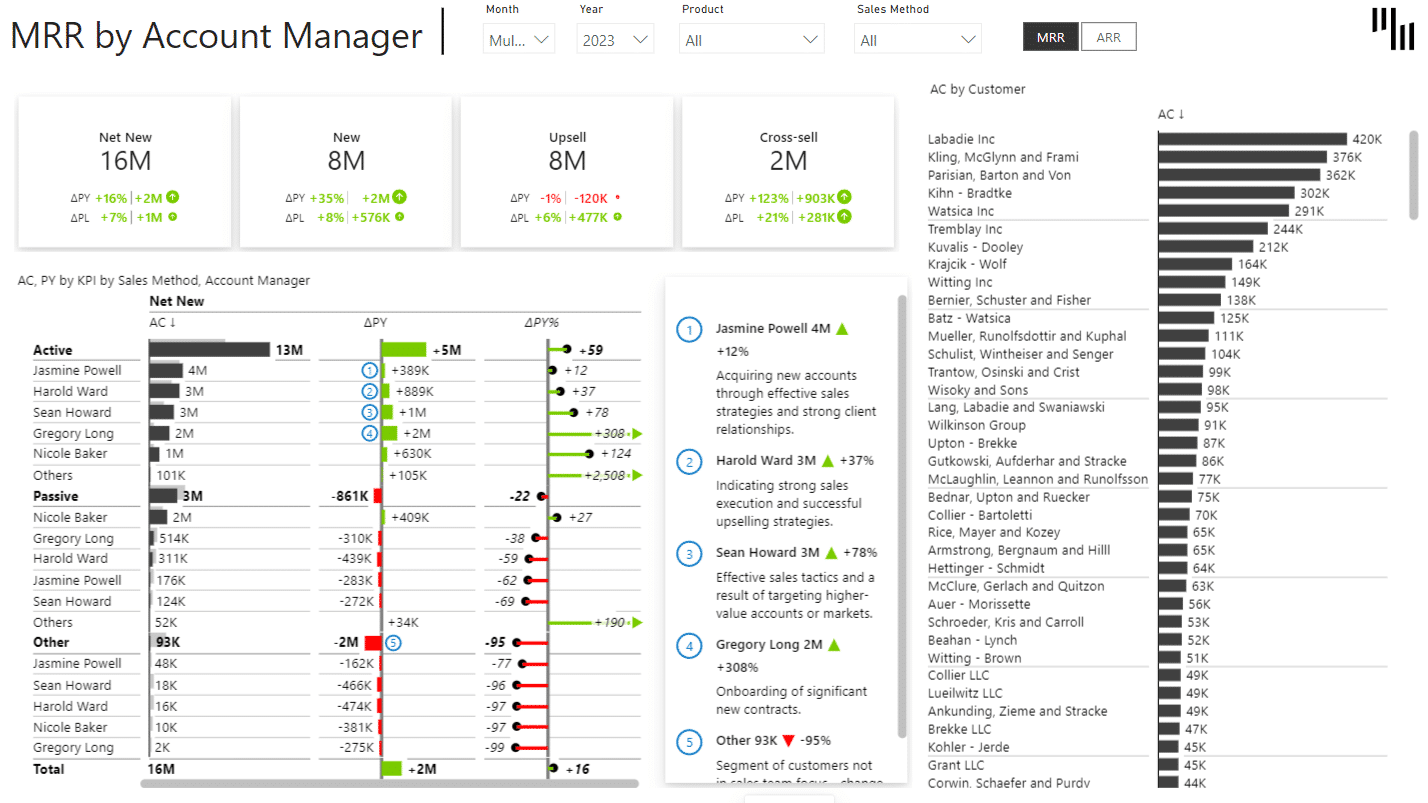
- Use the Top N customer/product analysis for actionable insights. Instantly identify key revenue drivers or churn risks to prioritize retention, upselling, and ROI-focused actions.
This template has everything you need for your sales managers and stakeholders to scale insights at speed.
Built with Zebra BI
Zebra BI’s certified Power BI visuals power this template, which means your sales team will benefit from visuals that are interactive and actionable in the fullest sense of the word:
- Zebra BI Tables, when you want to see detailed insights about your sales process, by customer type, segment, or pricing plan.
- Zebra BI Charts, which help you create clear visuals for trends, churn, or retention.
- Zebra BI KPI Cards, so you can highlight mission-critical KPIs
Effectively visualizing and tracking all these metrics will help you improve your profitability by working on expansion MRR, churned MRR, and sales cycle metrics that speed up your SaaS business'growth.
Here are some of the core features we included in this SaaS dashboard template for Power BI:
- Built-in chart sliders for interactive visualization.
- Top N logic for easy analysis of key contributors.
- Dynamic comments for context-rich reporting.
- Get executive-grade reports without writing complex DAX or custom visuals.
Who is this SaaS sales dashboard template for?
Whether you're an executive or a data professional, this template transforms your SaaS reporting:
- Founders/C-level Executives who want to gain clarity on growth trends, customer churn, and efficiency metrics.
- FP&A specialists who want to automate recurring reporting processes while delivering polished insights.
- Revenue operations teams who want to track funnel metrics and fine-tune your strategy for maximum impact on sales goals
- BI developers who want to save time creating clean, scalable dashboards tailored to SaaS metrics.
Start with a template that works for every level of your organization.
Why should you choose Zebra BI?
Zebra BI revolutionizes Power BI reporting for SaaS teams by delivering clear and actionable insights instantly. Our template will provide you with:
- Smarter logic, faster Reports. There's no need for additional DAX customizations.
- All-in-one dashboards that allow you to seamlessly unify sales and pipeline metrics for executives, finance, and operations.
- Built to scale. Zebra BI enables you to create streamlined reports that adapt to any SaaS model or size.
- Export-ready analytics ready for Excel, PowerPoint, or investor meetings.
Empower your team with visuals designed to drive clarity and precision.
IBCS compliance for consistency across the board
This template follows International Business Communication Standards (IBCS) to ensure your reports are:
- Consistent: Eliminate confusion with standardized visuals and scalable layouts.
- Clear: Focus on actionable takeaways with meaningful formatting.
- Professional: Meet the needs of investors or internal stakeholders with polished presentations.
Simplify communication and focus on making decisions faster.
Download this Power BI SaaS Sales Dashboard Template
Don’t waste time creating separate dashboards from scratch! This Power BI SaaS dashboard template is your go-to solution for managing recurring revenue metrics. Quickly measure what matters and achieve better insights in less time.
Simplify SaaS reporting today—put powerful insights at your fingertips with Zebra BI.
Try it with your data
Getting started is quick and easy — even if you’re not a Power BI expert.
Here are the next steps:
- Download this power bi templates/examples to find best practices and inspiration for actionable reporting techniques.
- Use sample data to test it out and check what is the background to find application to your use cases.
- Use free trial or and other Zebra BI plan to create PVM analysis reports with Zebra BI visuals on your own data.