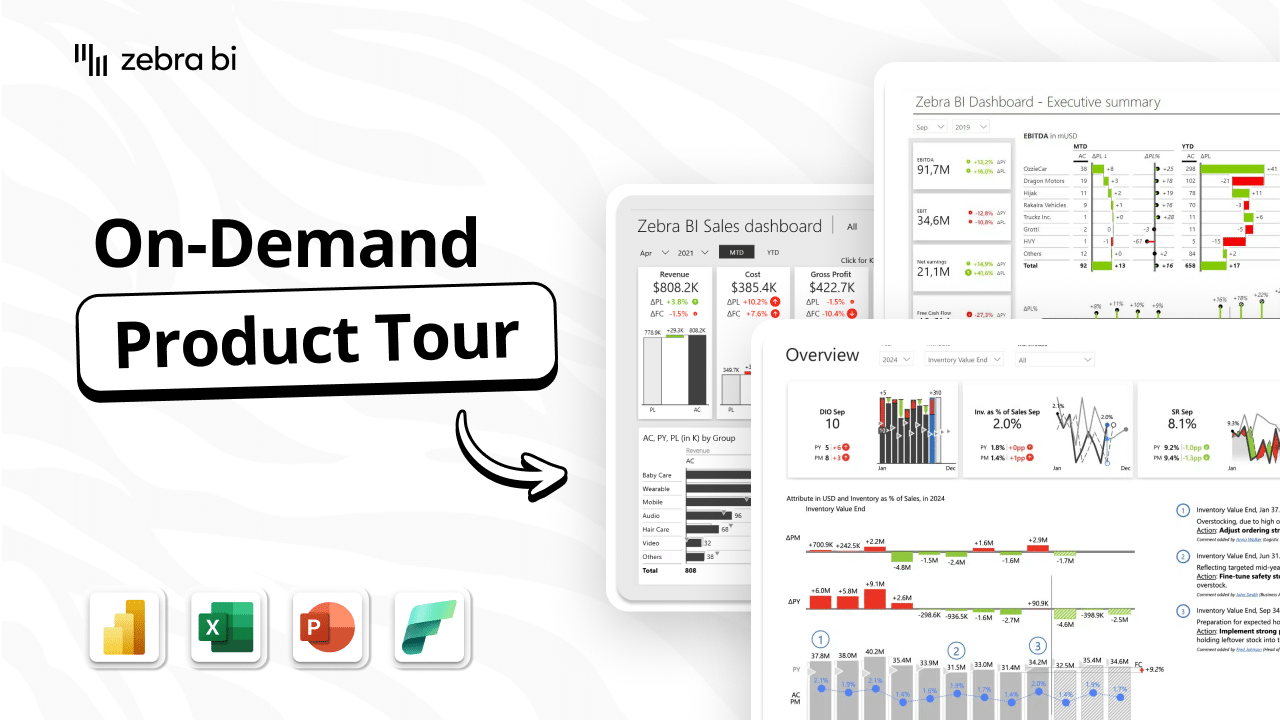
10-minute on-demand demo

The reports your leadership will actually act on.

The problem isn't your data. It's the distance between your data and the decisions your business needs to make. More than 3,000 companies have already closed that gap.
What you'll see in the demo

10 minutes. Go from data to decisions.

Zebra BI lets you answer the key business questions in any meeting, without writing a formula, opening three more reports, or scheduling a follow-up.

Zero formulas. Zero IT requests.

Drag in actuals, plan, and prior year. Zebra BI calculates and visualizes every variance automatically. No DAX, no IT request.

The why lives with the number.

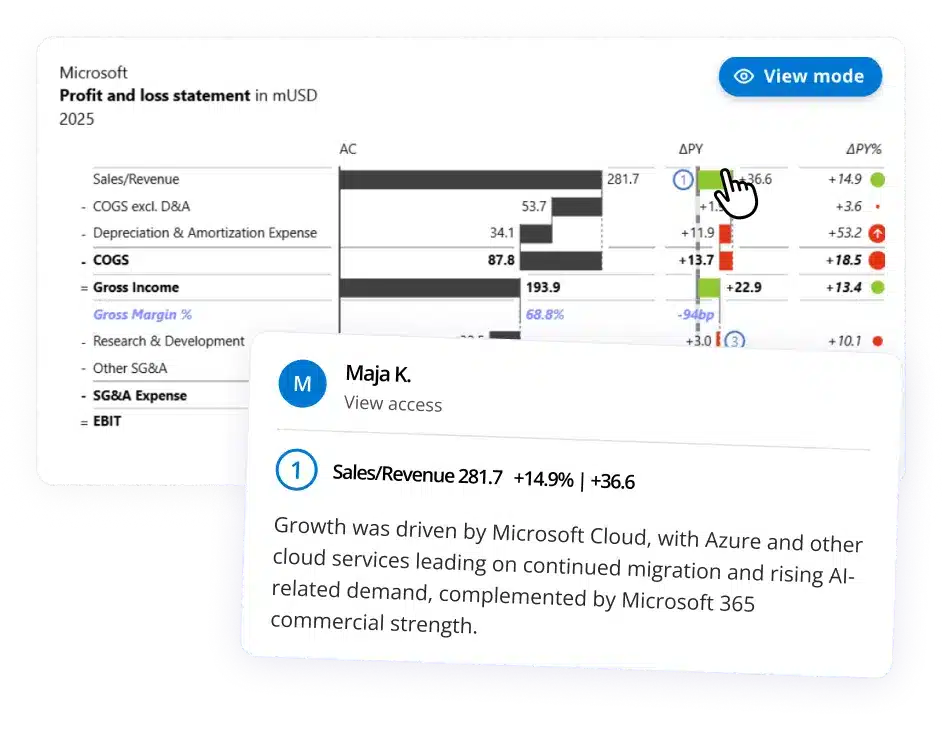
Numbers tell you what. Comments tell you why, pinned directly to the data point, for whoever built the report or anyone reading it.

Decisions in the room, not after it.

Is performance on track? By how much? Why? What's next? One report answers all four before anyone has to ask.

One standard. Every team.


Same visual language across Power BI, Excel, PowerPoint, and Zebra AI. One standard for every department, no relearning.
10-minute on-demand demo
WITH US, IN 20 MINUTES

Bring one report and we'll rebuild it with you

You just watched it on our sample data. Send us a report you already publish and we'll rebuild a page of it with you: one-on-one, no slides.
20 minutes · One-on-one · Reply within 24 hours

Here's how it goes

No deck, no discovery questionnaire. We open your report and work on it.
Step One

You show us one report

The one you publish every month - a P&L, a sales pack, a KPI dashboard. Whatever your leadership actually opens.
Step Two

We rebuild a page of it, live

In Power BI or Excel, on the call. You'll see the variances, the commentary and the charts update themselves.
Step Three

You get a straight answer

Whether this fits how your team reports - including if it doesn't. We'd rather tell you in 20 minutes than in month three.
Start today
Rather try it yourself first? 
Install in Power BI, Excel, or PowerPoint in under five minutes. No IT request, no setup call.
Full access, no credit card
Power BI, Excel, PowerPoint and Zebra AI
Tables, Charts, and Cards included
50+ ready-to-use templates
Free Academy and responsive support
Start Free Trial
Microsoft AppSource certified · 4.8/5 average rating
Real teams. Real results.

What happened when teams like yours made the switch.

3,000+
companies worldwide
1.5M+
daily users
4.8/5
average rating
One report. Two analysts' worth of time saved.
"From building one report that everyone could use, we saved about one to two annual analysts' worth of time across all of our teams by consolidating and automating reports with Zebra BI."
Leadership reads it. No walkthrough.
"With Zebra BI, we were able to create a Board of Directors dashboard that ensures leadership has direct access to the most critical financial data. This is a key part of our Future Finance Program."
The right story, faster.
"These visuals weren't just cosmetic upgrades, they helped us tell the right story faster and better."
View more Success Stories →
START FOR FREE

Build the reports your leadership will actually act on.

Full access, no credit card. Up and running in under five minutes. Try Zebra BI directly on your data in Power BI, Excel, or PowerPoint — or talk to our team and we'll walk through your setup together.


New: Zebra BI Tables+ and Charts+

Everyone can comment on the report. No edit rights needed.
See the new visuals
Matija Prijatelj
BI Specialist