 September 8th
 February 22nd
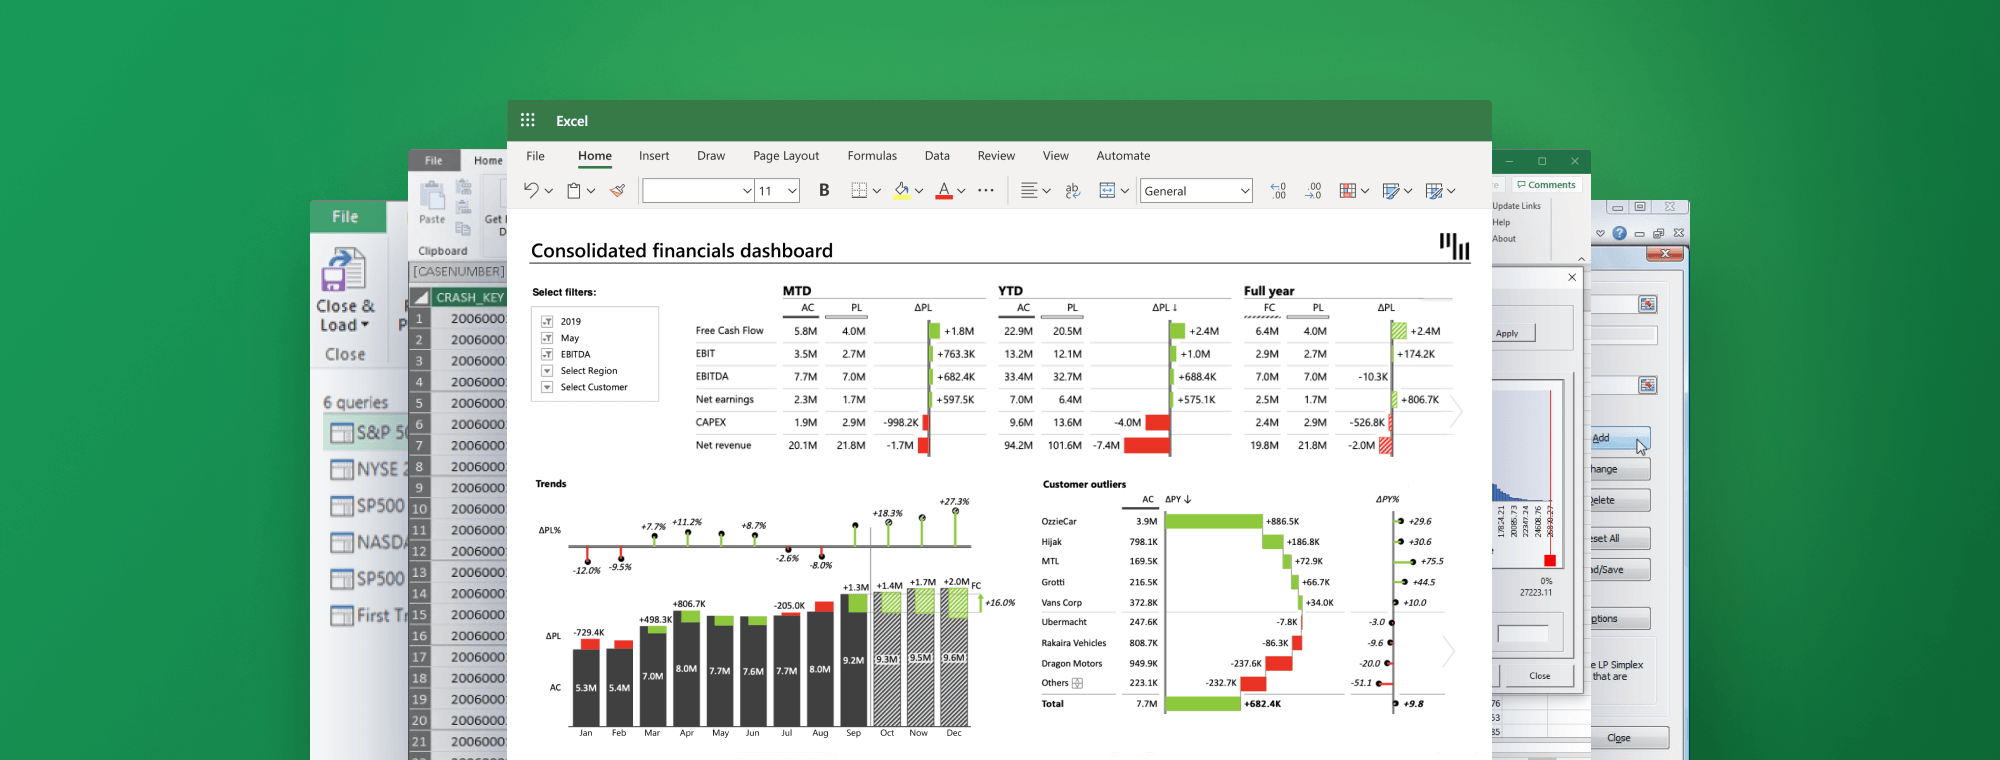
Breaking it down: The Top 5 FP&A Tools for Excel in 2023 That You Can't Afford to Miss
In the ever-evolving landscape of financial planning and analysis, Excel remains an unfaltering ally. Yet, the truly savvy FP&A professionals know that to unlock the full potential of Excel, one needs the right tools. Join us as we uncover which FP&A tools for Excel made our top 5 list this year.
So, prepare to revolutionize your workday as we take a deep dive into the absolute must-haves: the cream of the crop when it comes to FP&A tools for Excel. If you've been wrestling with complex data sets, juggling disparate sources, or just yearning for a more streamlined way to interpret and present your data, then you've come to the right place.
Keep reading, and we promise, by the end of this guide, you’ll be as excited about FP&A tools for Excel as we are! With these in your arsenal, you'll not only level up your Excel game but also take your financial analysis game to new heights. So, grab your coffee, flex those spreadsheet skills, and let’s take a look at the top 5 2023 must-haves.
Why FP&A professionals even use Excel-based tools?
Now, before we plunge into the world of these cutting-edge FP&A tools for Excel, let's set the stage by understanding why they're indispensable for FP&A professionals in the first place. We assure you, it's not just because they love a good spreadsheet.
For the uninitiated, Excel tools are like the secret sauce in your favorite recipe. They are additional software components that take Excel—a powerful tool in its own right—and elevate its functionality to dizzying new heights. Think of them as the cape to Excel's superhero, providing specialized features that go beyond the standard capabilities of Excel.
These tools are lifesavers for everyone who regularly wrestles with data. Whether you're building intricate financial models, conducting detailed forecasting, crafting dynamic reports, or working with hefty data sets, these tools are designed to make your life infinitely easier. These FP&A tools for Excel act as a potent blend of convenience and power, making you the master of your data, rather than the other way around.

Their use extends to streamlining work processes, enabling data-driven decision making, and effectively communicating financial insights. It's like having your own personal data assistant, trimming the fat off your workflow, and serving you up insights in a neatly packaged, comprehensible format. These FP&A tools for Excel are more than just a convenience—they're the next step in ensuring that your data works for you, not against you.
In short, to stay competitive in the rapid-paced world of financial planning and analysis, integrating these tools into your Excel routine is less of an option and more of a necessity. Because why work harder when you can work smarter? Now, let's unravel these game-changers one by one.
Which FP&A tools for Excel made our TOP 5 list?
Ready to supercharge your Excel skills? Fasten your seatbelt, because we're about to embark on a thrilling tour of the Top 5 FP&A tools for Excel that offer the best value in 2023.
1. Zebra BI for Office
First up is the mighty Zebra BI for Office. It comes in the form of Excel (and PowerPoint!) add-ins that take data visualization and reporting to new horizons. This tool helps you create clear, effective financial reports, dashboards, and presentations, all while focusing on business intelligence (BI) and financial analysis. It lets you create complex visual reports fast, combining waterfall charts, small multiples, and other advanced charts and tables.
It also comes with next-level features, such as automatic variance calculations, custom calculations (Invert, Result, Skip), subtotal difference highlights, comparisons of up to 4 measures (AC, PY, PL, FC), formula editor for calculating new data elements, integrated dynamic comments, and many more.
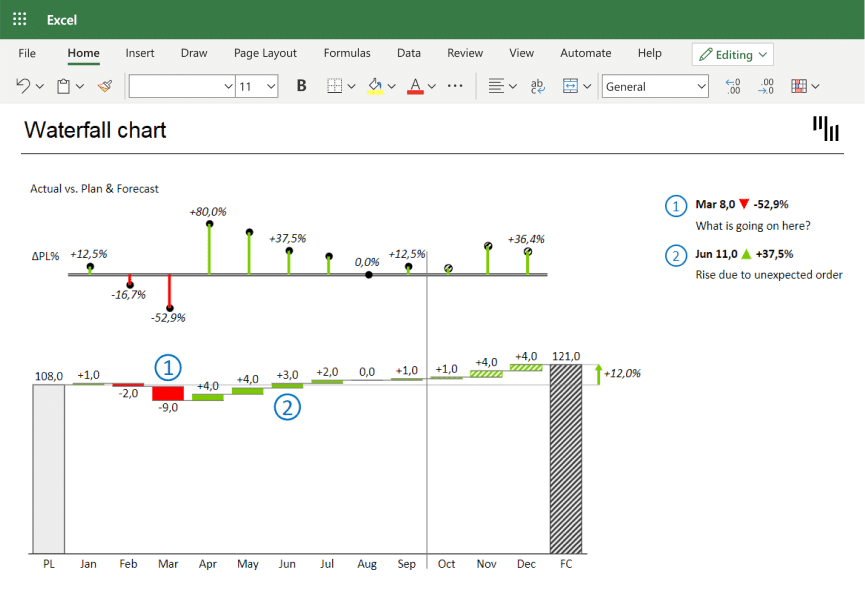
These visualizations are IBCS®-certified out of the box, which makes them the first and only of their kind on the market. They enable you to reveal hidden insights and make impactful decisions based on actionable insights. The visuals are interactive and responsive, so you can easily drill down into your data for a more detailed view & get the best experience out of every visual, no matter the size. That's why Zebra BI is not just another dataviz tool – it's a revolution in how you perceive your data. You can also get it for PowerPoint, and it works seamlessly on both platforms.
2. Power Query
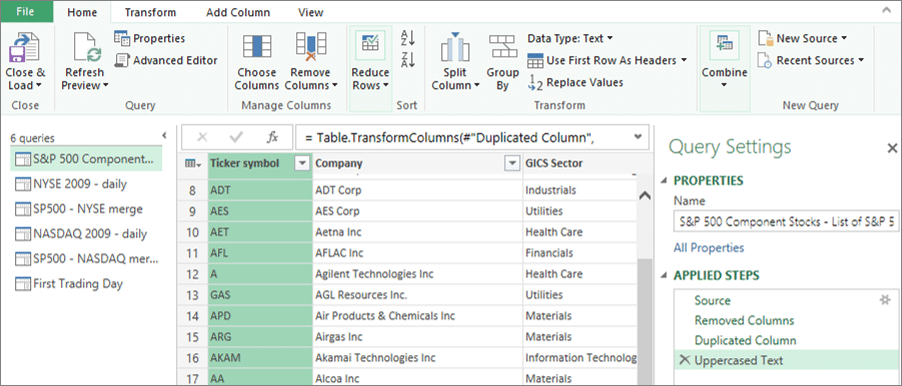
Then we have Power Query, an ETL (Extract, Transform, Load) add-in that turns you into a data wrangling cowboy. It's your go-to tool for connecting, transforming, and consolidating data from a cornucopia of sources. Import data from databases, websites, or CSV files – Power Query is your oyster.
With it, messy data doesn't stand a chance. It lets you clean and shape data, amalgamate multiple data sets, and even automate data refresh workflows. For those who love to get hands-on with data preparation and analysis, Power Query is a dream come true. Learn how to master it in our guide on Power Query data transformation.
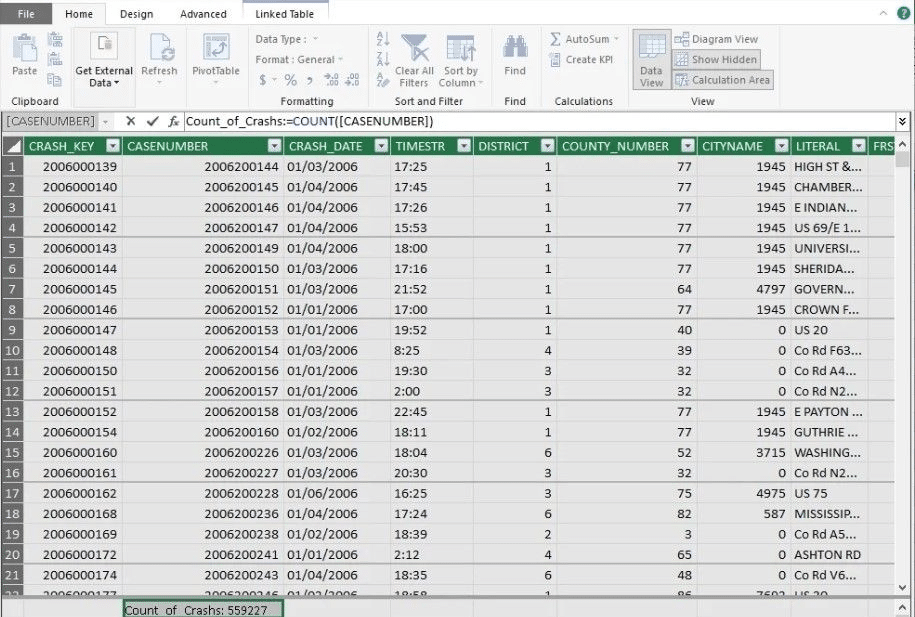
3. Power Pivot
Next in line is Power Pivot, the heavyweight champion of data modeling. This add-in lets you build intricate data models within Excel by creating connections between multiple tables. Need to perform calculations that would make a regular Excel sheet quiver? Power Pivot has you covered with its robust DAX (Data Analysis Expressions) formulas. It's like the Swiss Army knife for complex financial analysis. Whether you're creating consolidated financial statements or scrutinizing large data sets, Power Pivot is a complete game-changer.
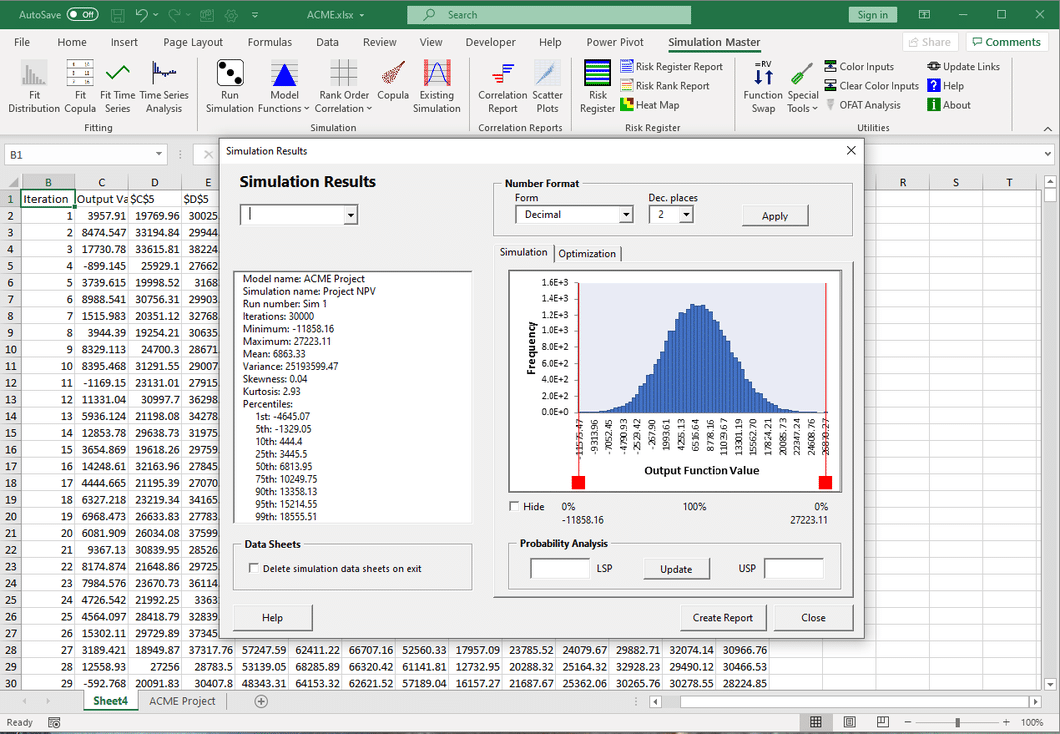
4. Monte Carlo Simulation
Moving on, we have the Monte Carlo Simulation, the master of probabilistic forecasting. This add-in uses statistical techniques to simulate a range of outcomes based on varying input assumptions, which makes it a perfect tool to understand the uncertainty and risks associated with your financial forecasts. You can run multiple simulations and analyze the probability distribution of results, which can help you manage risks better and make smarter decisions.
5. Solver
Last but not least, Solver is the problem-solving guru of Excel add-ins. It helps you find optimal solutions to complex conundrums by adjusting multiple input variables within specified constraints. If you're looking to maximize profitability under certain limitations or determine the best production mix, Solver has your back. For those who fancy themselves a Sherlock of forecasting and strategic decision-making, Solver is your Watson.
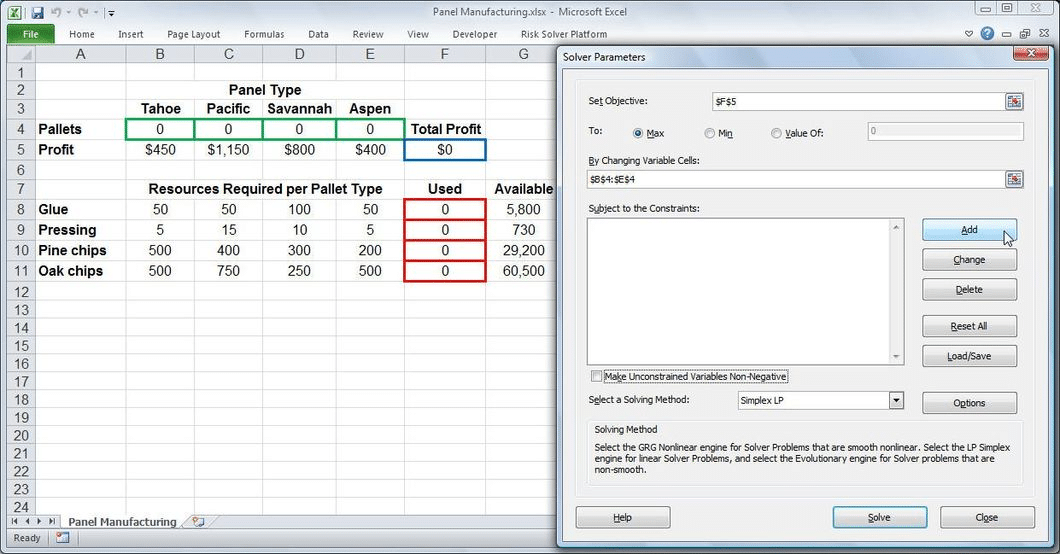
Solver helps you find optimal solutions to complex problems by adjusting multiple input variables within specified constraints
So there you have it—five powerhouse FP&A tools for Excel that can propel your Excel experience into a new dimension. Because in 2023, being good at Excel isn't enough—you need to be extraordinary. And with these tools, extraordinary is just the beginning.
Try Zebra BI for Office in your Excel for FREE
Zebra BI is so powerful that even Microsoft uses it for internal reporting. The best part? You can try next-level data viz tool FOR FREE. Grab it now & automatically receive an instructional file that will help you get started.