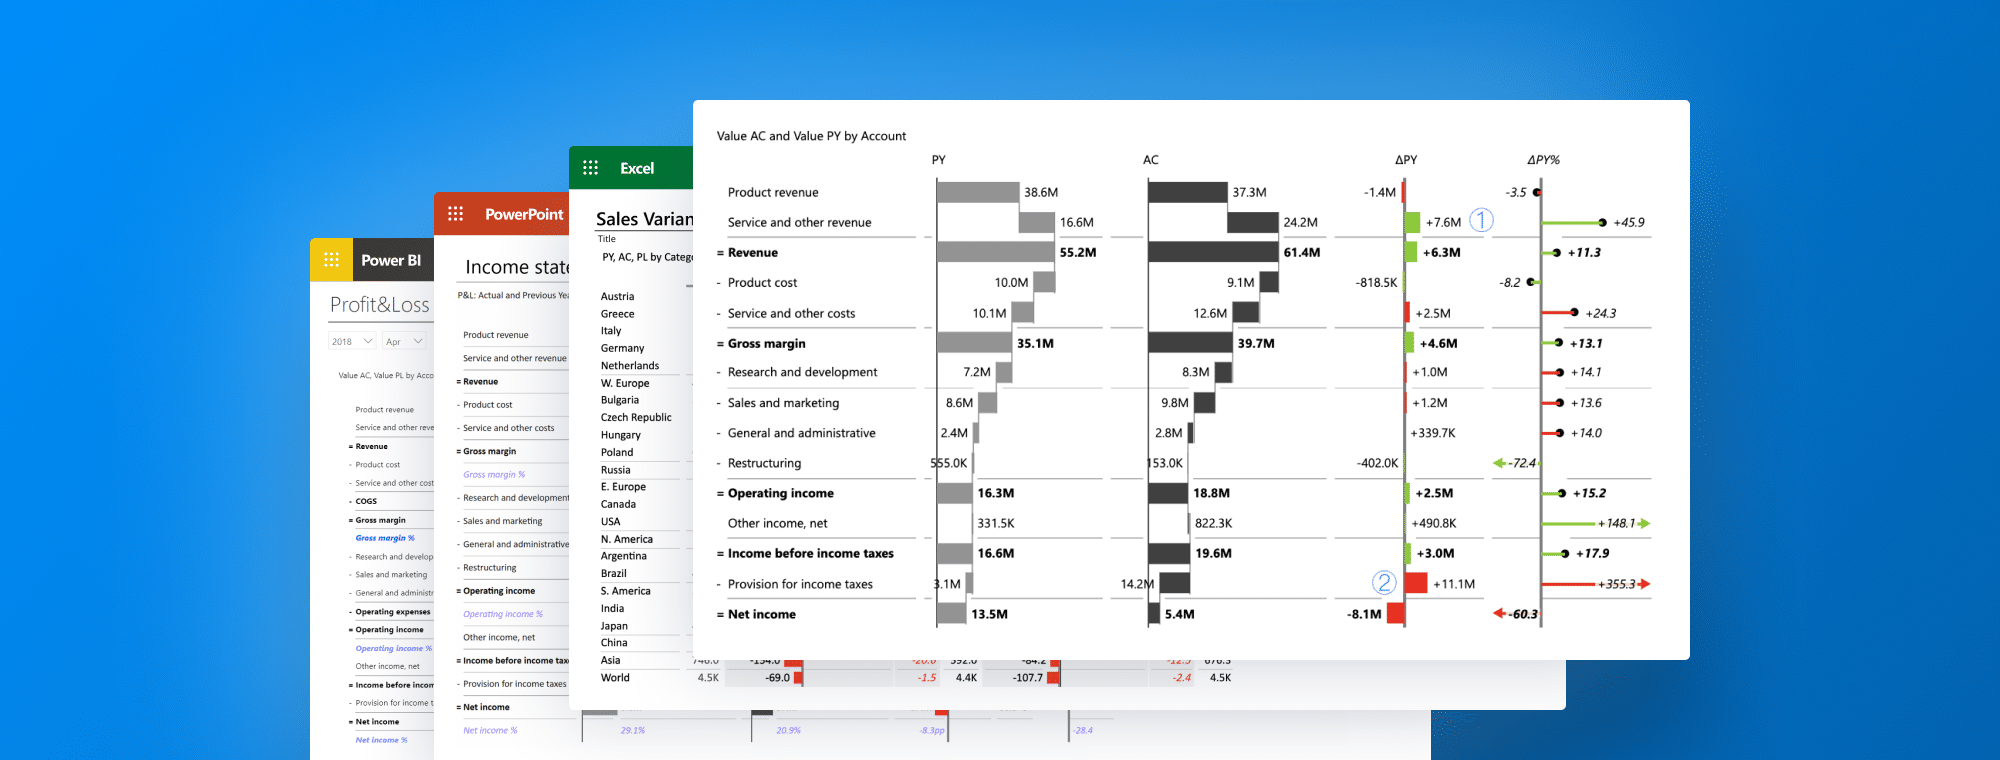
Zebra BI Tables: The Best Matrix & Table Visual on The Market in 2024
PRO Trial
Having the ability to visualize and interpret complex datasets effectively has become an essential ability in today's age of data-driven decision-making. It transcends the boundaries of being a 'nice-to-have' tool and has established itself as a quintessential component in the business intelligence domain. Professionals across industries lean heavily on potent visualization tools to sift through data noise and extract actionable insights.
Within this dynamic landscape, Zebra BI Tables emerges as a frontrunner, setting new benchmarks in capabilities and versatility, offering users a tool and a formidable ally in data analysis and reporting.
Introduction to Zebra BI Tables
At the intersection of technology and business intelligence stands Zebra BI Tables, a powerful visualization tool that promises to redefine how data is presented and consumed. Its design pivots on the principles of clarity, precision, and flexibility, thus enabling businesses to craft data narratives that are as compelling as they are insightful.
Its seamless integration capabilities across platforms like Power BI, Excel, and PowerPoint breaks down silos and fosters a collaborative data analysis environment. Whether creating comprehensive financial reports, analyzing performance metrics, or crafting detailed forecasts, Zebra BI Tables stands as a beacon of innovation and effectiveness in the market.
As we venture further, we will unpack the rich feature set of Zebra BI Tables, diving deep into each one's unique functionalities and the unparalleled advantages they bring to the business intelligence tableau.
Stay tuned as we unfold the story of a tool that is not just leading the market but reshaping business intelligence and data visualization.
Unveiling the Dominant Features of Zebra BI Tables
In this section, we will explore the robust features of Zebra BI Tables, highlighting how each functionality contributes to making it a market leader.
Additional Measures
Zebra BI Tables visual goes beyond just displaying data; it aids in a more profound analysis by allowing the incorporation of additional measures. This functionality allows users to depict various dimensions and metrics simultaneously, enabling a comprehensive view and analysis of the data.
Adding additional measures such as "AC as % of Sales/Revenue" gives insight into your data. Understanding the structure of your Income Statement is essential, especially when it comes to optimizing your costs and increasing profitability.
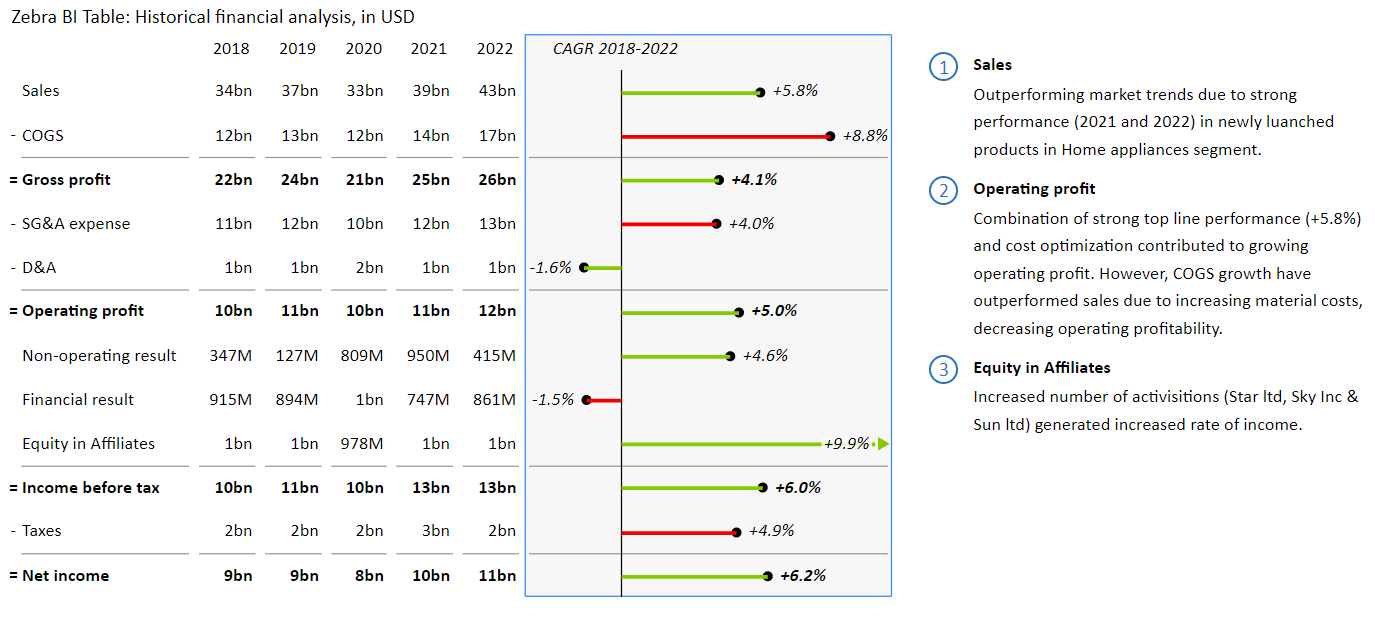
When looking at historical (as part of your annual planning process) or planned figures, you should be able to understand trends in your performance. Calculate the Compound annual growth rate (CAGR) and visually present it alongside your Income statement. Elevate your analysis and reports by providing additional insights such as CAGR and seeing if your sales are growing faster than your profit, presented meaningfully and efficiently.
Multiple plans & forecasts
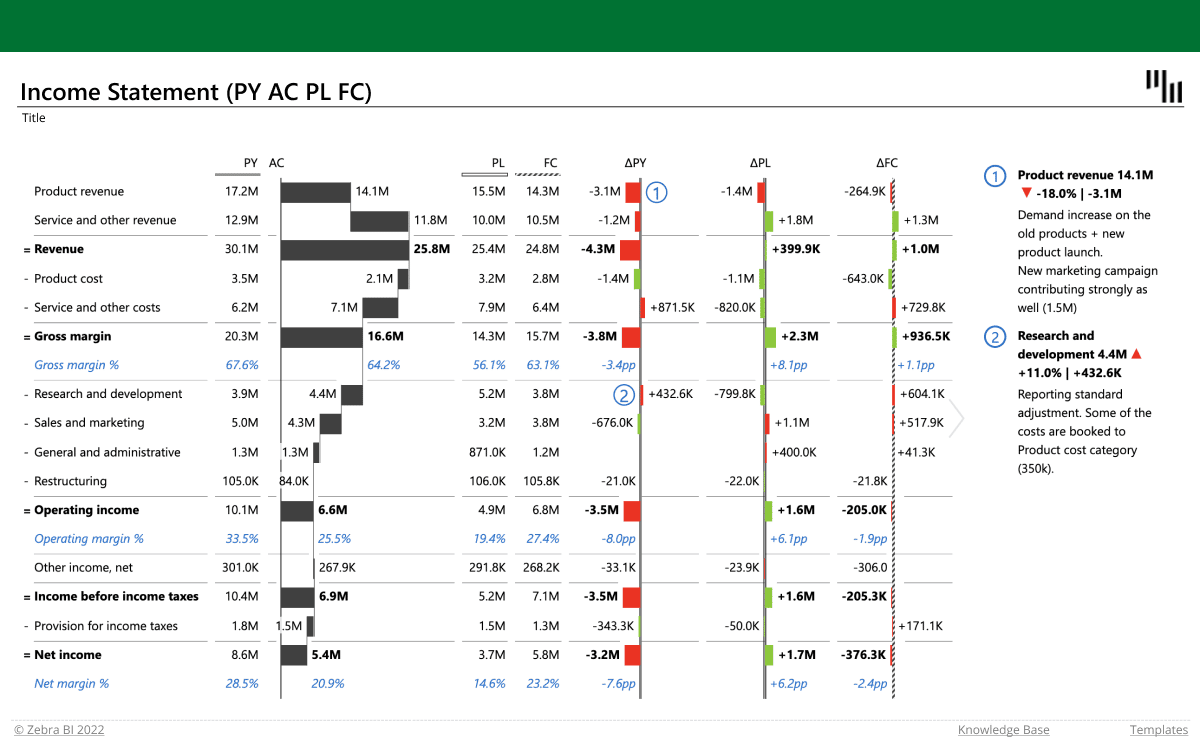
The tool allows users to display multiple plans (PL) and forecasts (FC) in a single view. This facilitates detailed comparative analyses and empowers organizations to craft nuanced strategies based on historical and forecasted data.
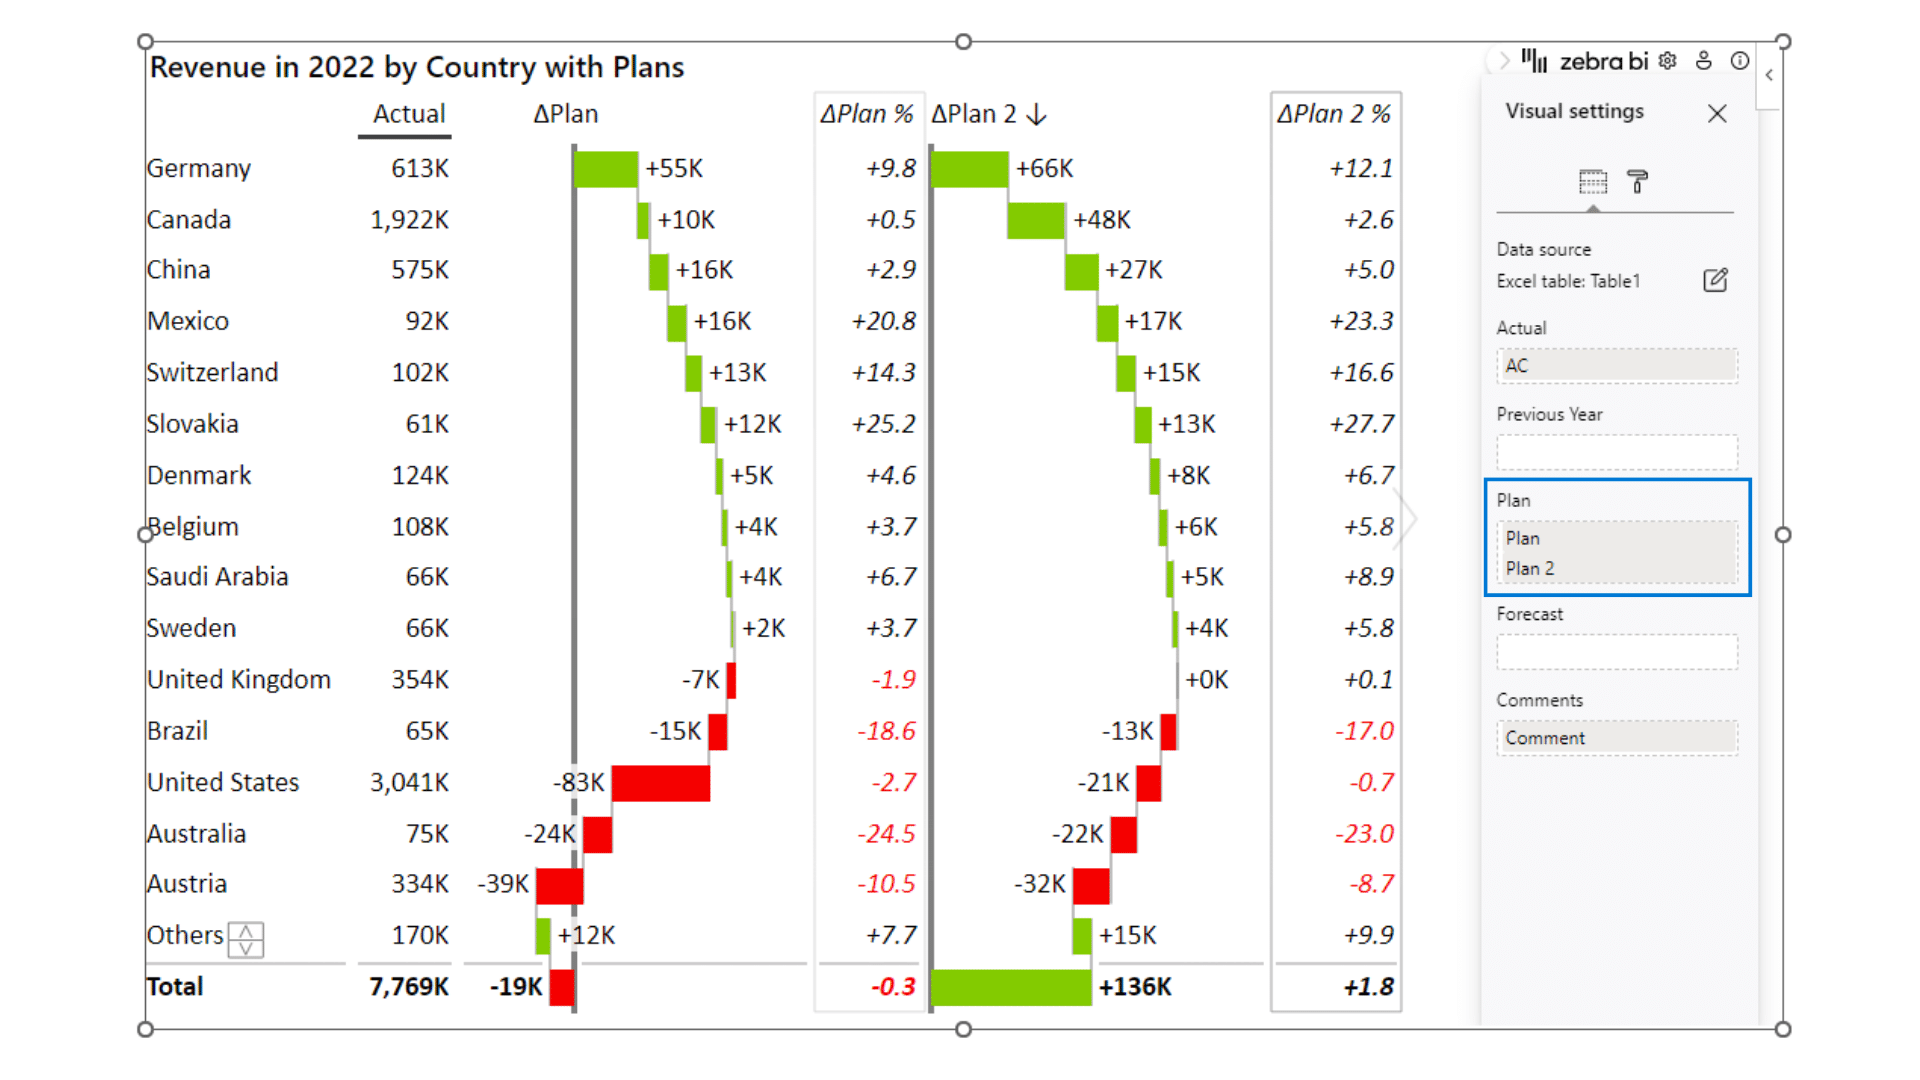
Compare actuals against different scenarios (optimistic, realistic) and see how you are doing: automatically calculated variance for all of them, instantly highlighting the main drivers of your performance. No need to create several tables and charts and paste them together. Zebra BI Tables compares your plans (PL) to actuals (AC) by highlighting major variances out-of-the-box and allows you to give insights through tables with integrated charts like waterfall charts to get your audience engaged and on the same page.
Automatic Variances
In a business environment where time is of the essence, the automatic variance feature is a testament to efficiency. It calculates and highlights discrepancies automatically, thereby saving time and reducing the possibility of errors, a common occurrence with manual calculations.
Bring two numerical columns into the Zebra BI Tables visual, and the visual itself will tell you where the focus should be put by calculating and presenting variances.
Comments
Offering an interactive platform, Zebra BI Tables permits users to add comments directly within the reports. This encourages collaborative analysis and allows for the consolidation of insights and observations, fostering an organization's data-driven decision-making culture.
Use comments to complete your report and increase performance awareness across your organization. Everyone should be able to read and understand reports! No more endless emails and repeating questions.
Also, you can add comments directly to the visuals, edit and delete them, highlight key points, and easily tell dynamic data stories.
Top N + Others
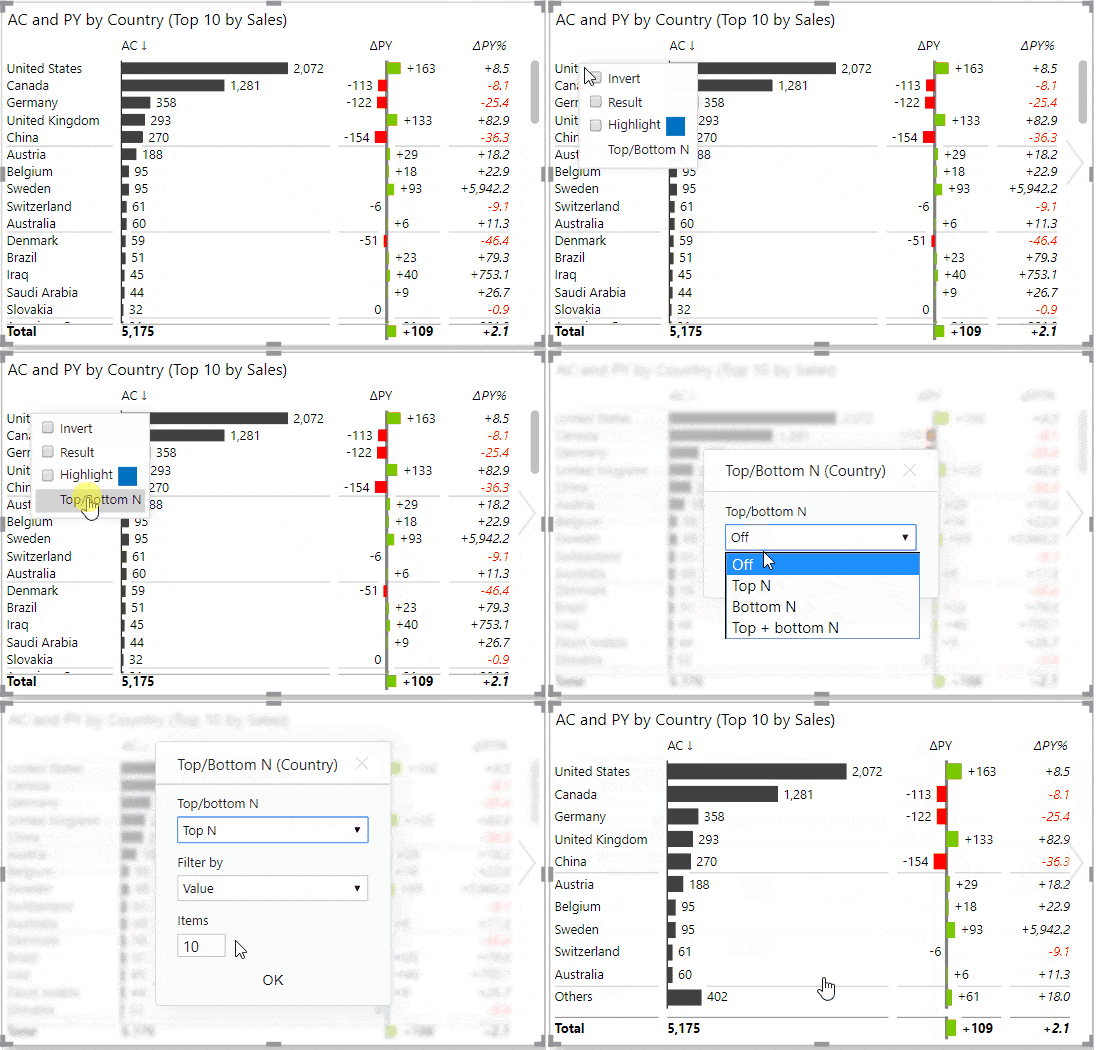
Business reports should not look like an extended “phonebook”-style list of items. Instead, they should quickly expose the most critical data elements, topmost important variances, etc. That is why all Zebra BI visuals offer practical functions for displaying Top and/or Bottom N elements that will make your reports and dashboards much more focused and actionable.
All Zebra BI visuals offer the Top N + Others functionality. In Zebra BI Tables, you can use it to display, for example, the Top 10 or Top 20 most essential elements in your rows (either by value or by the variance), while all other small elements are automatically summed up into a new row called Others. Here’s an example:
Formula editor
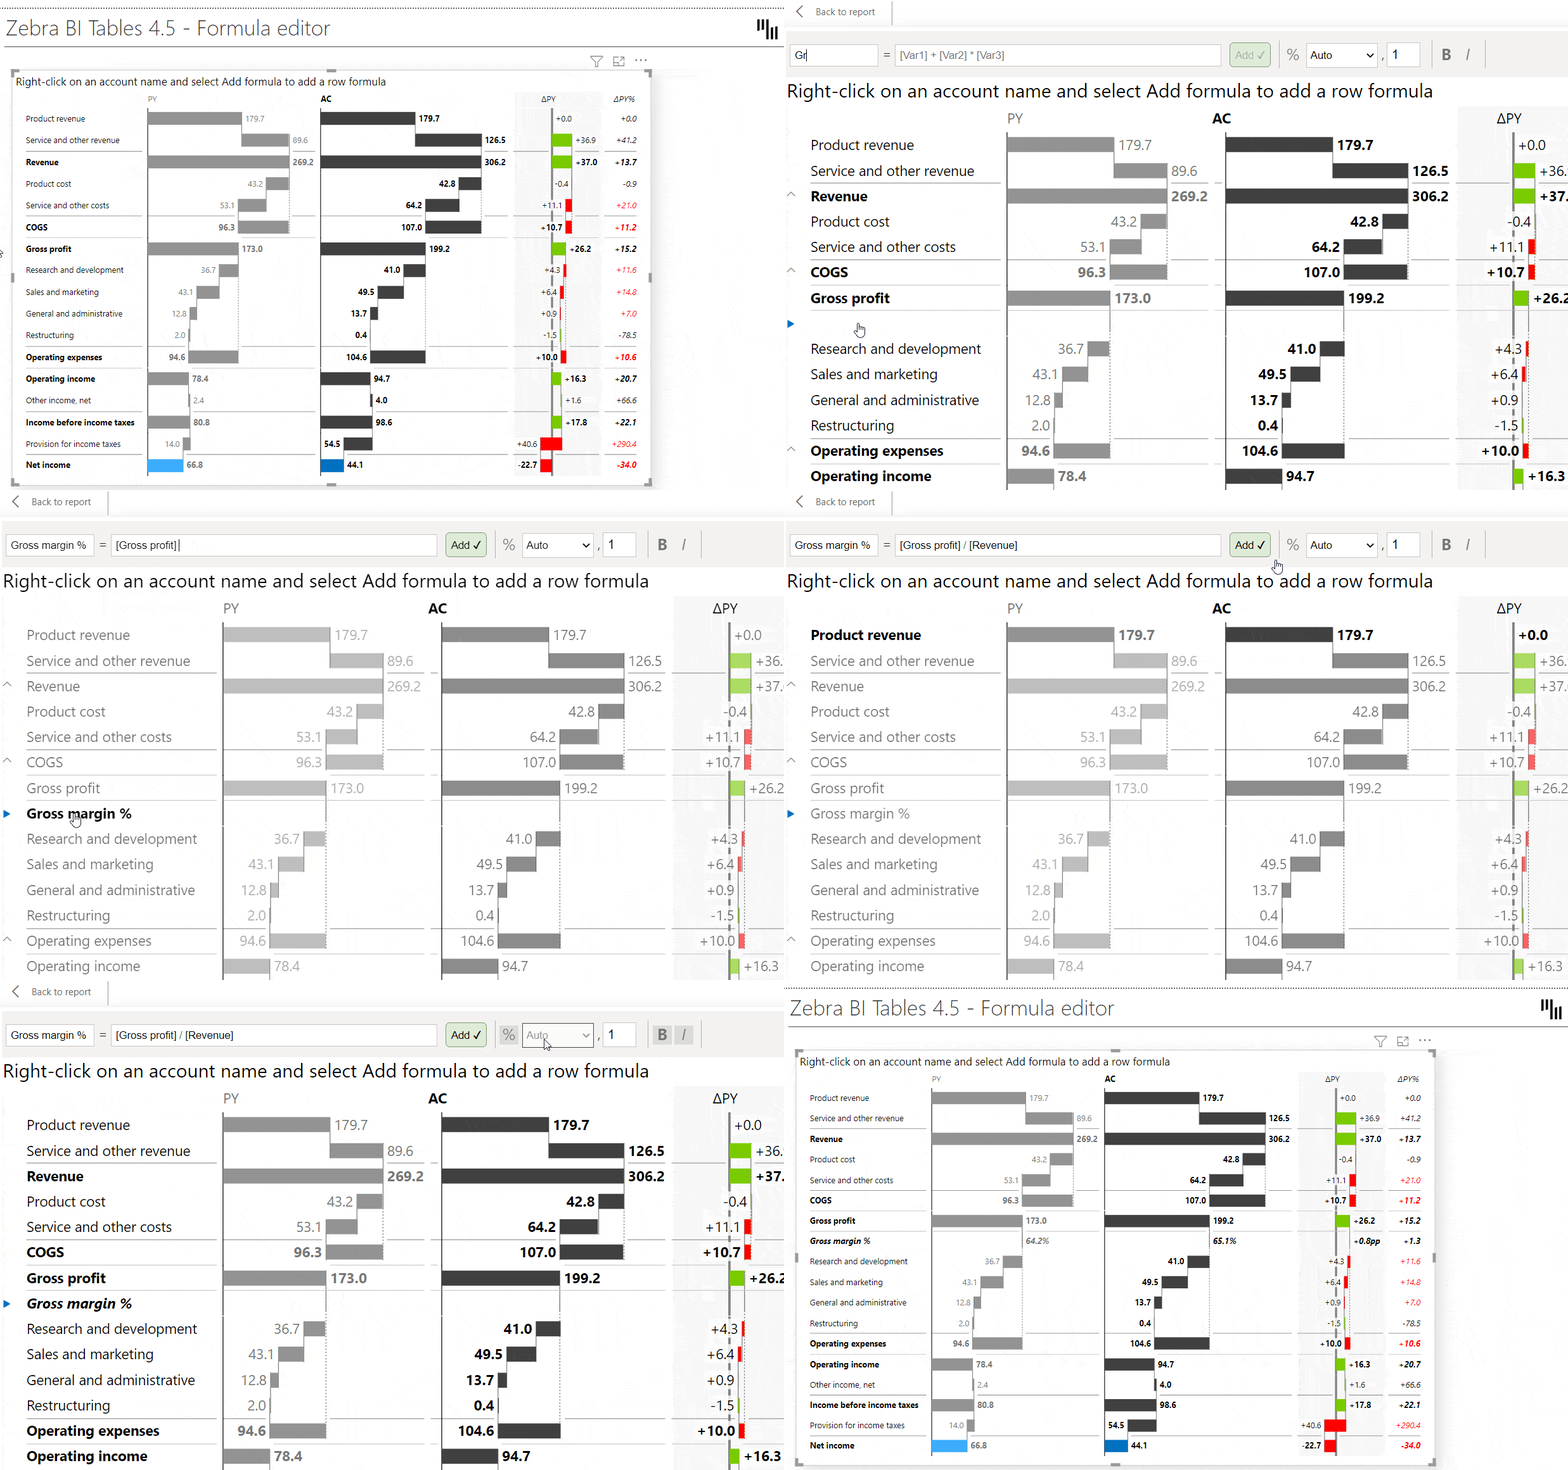
Whenever you want to add a new element to your table, and it’s not in your data set, you can calculate it with a custom formula within a Zebra BI Tables visual.
Zebra BI Formula Editor provides powerful capabilities not available in native Power BI and helps you to write formulas and easily calculate new data elements within your tables.
Text columns
Zebra BI Tables is equipped with a powerful feature that allows users to add additional text attributes next to the primary data category. This function is essential for those who need a richer context and faster understanding of their data.
Features and Benefits:
- Comprehensive Reporting: Insert multiple text columns adjacent to your main values to create a report that tells the full story behind your numbers.
- Seamless Integration with Data Structures: These text attributes are compatible with various table formats, including hierarchical and cross-tables, allowing for sophisticated and structured data analysis.
- Intuitive Customization: Rearrange and sort these text columns with simple, built-in Power BI functionality, offering a tailored view that aligns with your reporting needs.
Responsive Design
The tool's responsive design ensures optimal viewing across various devices, adapting effortlessly to different screen sizes without compromising the integrity of the data visualization. This feature ensures that insights can be garnered anytime, anywhere, cementing its place as a versatile tool in the business intelligence toolbox.
Dual Views - Table Only or Table with Charts
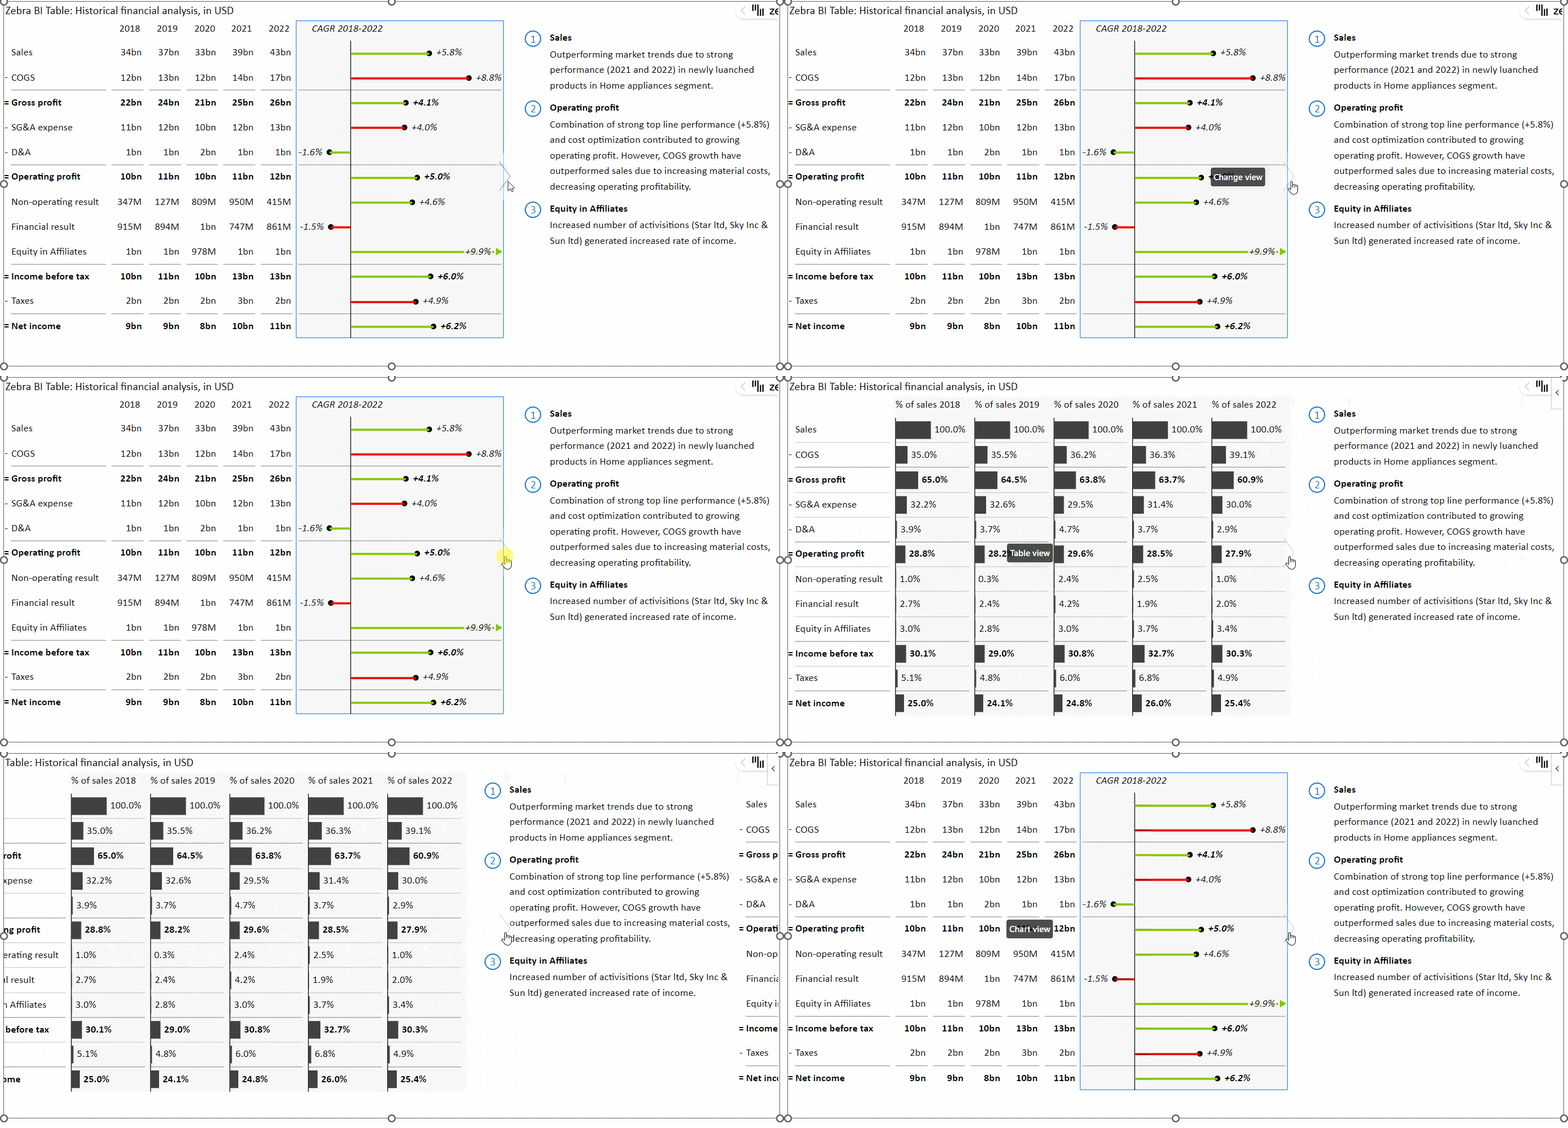
Zebra BI offers two distinct views to cater to diverse user preferences – a table-only view for those who prefer data in a tabular format and a combined table and chart view for those who appreciate visual representations alongside data. This flexibility lets users choose the view that best complements their analysis style.
Additionally, tables can be built with two views supporting each other, another example of efficient use of space. In combination with the “Hide column” feature, you may choose to show some columns (for example, growth rates) on one view and the other ones (structural breakdown, as % of total) on the second view so as not to overcrowd the table.
Complete Flexibility
Tailoring reports and data visuals have never been more accessible. Zebra BI Tables provides complete flexibility, allowing users to modify various elements, including, but not limited to, layout, metrics, and dimensions to suit their specific requirements, without compromising on data integrity and visualization quality.
Custom styling is available so your future reports can be standardized and familiar to readers. All it takes is just a single JSON theme upload, and every report created will have your company's branding colors.
Cross-Platform Compatibility
Not limiting its prowess to a single platform, Zebra BI Tables offers seamless integration across Power BI, Excel, and PowerPoint, fostering a unified approach to data analysis and reporting. This cross-platform compatibility ensures a smooth workflow, enhancing efficiency and productivity.
No more "Power BI vs. Excel" battle. Power BI experts and Excel masters can prepare the same-looking and functioning tables. As the final step, you can embed your Zebra BI table from Power BI to PowerPoint or use Data Linking to Excel to keep your presentation accurate, refreshable, and standardized.
Comparing Zebra BI Tables with Native Power BI Tables
Zebra BI Tables and native Power BI tables are pivotal data visualization and analysis tools. However, Zebra BI Tables offer a more advanced and user-centric approach. Here are some comparison points based on the specified criteria:
Efficient Use of Report Space
The Zebra BI Tables maximize report space without compromising clarity. The compact and organized layout allows more data to be displayed clearly and concisely compared to native Power BI tables.
Clear Message
With advanced visuals such as waterfall charts integrated within the tables, Zebra BI Tables ensure the message is clear and easily understandable. Unlike native Power BI tables, the visuals help better communicate data insights.
Increased Engagement
The intuitive and visually appealing design of Zebra BI Tables encourages more engagement from the readers or audience, making the data analysis process more interactive and insightful.
Advanced Visuals
Zebra BI Tables bring in a suite of advanced visuals within the table layout, including waterfall charts, which are not natively available in Power BI tables.
This feature enhances the data representation and helps better understand the data trends.
Ease of Use
Setting up and customizing Zebra BI Tables is straightforward and doesn’t require specialized knowledge, adhering to the analogy of not needing "Space X engineering." On the other hand, achieving a similar level of customization and visual appeal in native Power BI tables might require a steeper learning curve.
IBCS Compliance
Zebra BI Tables comply with International Business Communication Standards (IBCS), ensuring the visuals are standardized and universally understandable. This compliance addresses the challenges of modern business data communication, which is not inherently present in native Power BI tables.
Solving Modern Business Challenges
By offering a blend of ease of use, advanced visuals, and standardized communication, Zebra BI Tables are better equipped to address modern businesses' challenges in data representation and analysis than native Power BI tables.
Conclusion
In the rapidly evolving landscape of data analysis and business intelligence, professionals need tools that simplify data representation and extract actionable insights seamlessly. A dynamic blend of flexibility, responsiveness, and analytical depth distinguishes Zebra BI Tables as a top performer.
As we've explored, the wide range of features, including but not limited to automatic variances, additional measures, and multiple Profit and Loss and Forecast (PL & FC) layouts, have set a new benchmark in data visualization. Furthermore, the tool's versatility across platforms like Power BI, Excel, and PowerPoint amplifies its usefulness, fostering a cohesive and efficient workflow across different mediums.
But what truly sets Zebra BI Tables apart is its uncompromising commitment to evolving alongside the needs of business analysts and data enthusiasts. Its capabilities to integrate comments, offer responsive visuals, and provide two distinct yet equally powerful views (table only or table with charts) are not just features but a testament to Zebra BI's innovative approach. It is an approach that prioritizes complete flexibility, allowing users to tailor their data narratives in the most coherent and impactful manner.
The era of data analytics is on its way to a new phase, and Zebra BI Tables is ready to help you stay ahead of the competition with constant enhancements.
We invite you to experience the transformative potential of Zebra BI Tables firsthand. As you delve deeper, we are eager to hear your stories of how Zebra BI has revolutionized your data analysis and reporting efforts. Let's make better decisions with actionable insights in the future.
Ready to try the Zebra BI Tables visual?
Create jaw-dropping reports and dashboards with just a few clicks to deliver accurate insights from your data in record time.

 September 8th
 February 22nd