September 8th
 February 22nd
 26 Feb 2026
Raiffeisen Bank International (RBI), one of Europe’s leading banking groups, was facing a known challenge: Power BI had become the group’s default reporting tool, but its native visuals lacked the clarity and structure needed for effective financial reporting. Reports varied from one unit to another, and teams often reverted to Excel to make sense of the data.
Initially discovered by power users, Zebra BI quickly proved its value, offering International Business Communication Standards (IBCS)-compliant visuals, built-in standardization, and the ability to turn complex data into clear, actionable dashboards. The central BI team recognized the opportunity and enabled adoption across the group without mandates—just support.
One of the most successful implementations took place in Bosnia and Herzegovina, where Almir Mulahasanovic, Head of Business Intelligence and Financial Controlling in RBI’s Bosnian network unit, built a scalable reporting platform that’s now used by over 50 stakeholders. His team replaced static presentations with dynamic dashboards that drive faster, more confident decision-making.
Today, Zebra BI is used across several RBI countries. The result: visual consistency, stronger adoption of Power BI, and a group-wide shift toward more standardized, decision-ready reporting.
Raiffeisen Bank International has a long tradition, having been established 130 years ago. It is a leading commercial and investment bank in Austria and 12 markets across Central and Eastern Europe (CEE).
The RBI Group consists of banks as well as other financial service providers, such as leasing, asset management, and mergers and acquisitions.
Nearly 45,000 RBI employees provide services to around 17.8 million clients in approximately 1,550 branches, most located in CEE.
As Power BI usage increased across RBI, driven largely by the group-wide adoption of Office 365, it became the natural choice for reporting across network banks.
While Power BI offered the technical capabilities RBI needed, its native visuals fell short, especially for financial reporting. Reports lacked structure. The visuals were inconsistent. Each business unit applied its own interpretation of what 'good reporting' looked like. Instead of enabling faster insight, dashboards led to confusion, and users fell back on Excel to clean up and clarify the story.
Power BI was powerful, but visualizing data clearly was still hard. We needed more than standard charts to meet rising expectations.
Meanwhile, power users across the organization began looking for alternatives. At a Power BI community event in Vienna, they discovered Zebra BI. What stood out immediately was how easily it brought clarity to complex financial data.
We’d made mistakes in the past—buying extensions that were too narrow, used for one purpose only. Zebra BI was different. It covered multiple scenarios and came from a legit company.
When the central BI team looked closely, they saw the value: a tool that worked natively within Power BI, required no complex setup, and helped finance teams present data in a way that was consistent, readable, and decision-ready.
Compared to Power BI’s native visuals—or niche add-ons that solved only one problem—Zebra BI provided a full framework for financial storytelling. From variance analysis to board-level dashboards, it supported the entire reporting lifecycle. The UX was clean, the learning curve short, and the flexibility unmatched.
We didn’t just need prettier charts. We needed a visualization framework that was comprehensive, scalable, and well-supported.
Equally important was the vendor behind it. Zebra BI’s track record, documentation, and product maturity gave the central team full confidence in its long-term viability.
RBI’s central BI team moved quickly. They approved Zebra BI centrally, covered licensing costs, and made it available to any team ready to adopt it. There were no mandates—only enablement.
One of the biggest advantages? Zebra BI came with IBCS-compliant visuals built in, bringing instant standardization across departments without needing to reinvent design rules for every report.
One of the most impactful implementations happened in Raiffeisen Bank Bosnia and Herzegovina, where Almir Mulahasanovic took Zebra BI from concept to reality, replacing Excel reports and PowerPoint decks with interactive dashboards and turning finance reporting into a decision-making tool.
Almir, Head of Business Intelligence and Financial Controlling at Raiffeisen Bank Bosnia, knew he didn’t just want another visualization tool—he wanted to build a full reporting platform that could serve as the financial backbone of a bank. And he saw Zebra BI as the only solution capable of delivering that, both visually and strategically.
Zebra BI brought built-in visual intelligence, flexibility, and a structure that made even complex financial dashboards easy to read and use. From adjusting periods and viewing deviations to exploring interactive totals and drivers, Almir didn’t just adopt Zebra BI—he championed it throughout the organization.

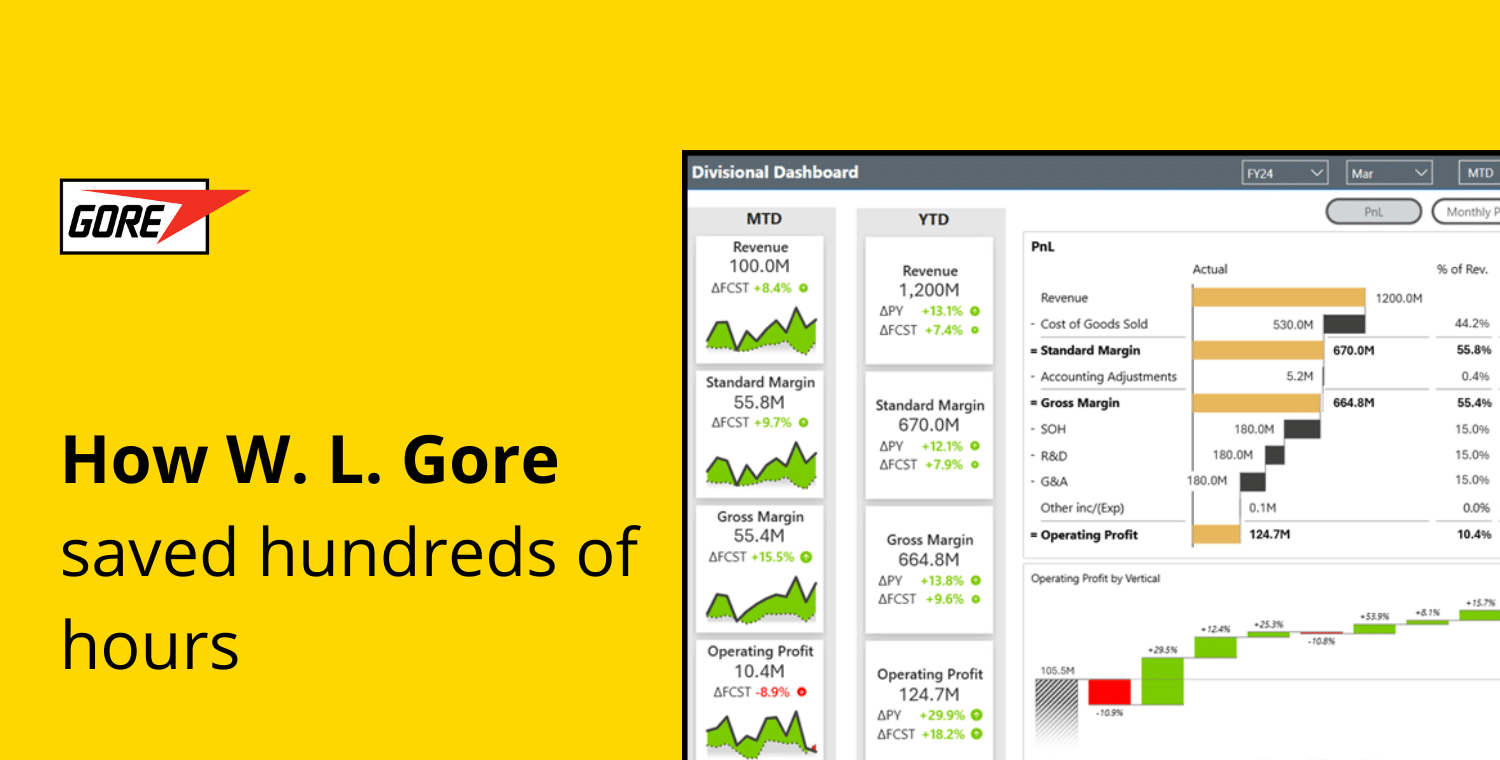
Disclaimer: The data and comments on the image are fictional and intended solely to demonstrate the layout and structure of the dashboard.
We follow the 3–30–300 principle. In 3 seconds you see the status, in 30 you understand the cause, and in 300 you’re ready to act.
Almir embraced the IBCS standards fully. He didn’t explain the dashboards to end users—he simply showed them. The design was self-explanatory. Even less experienced stakeholders immediately understood what they were seeing.

Disclaimer: The data and comments on the image are fictional and intended solely to demonstrate the layout and structure of the dashboard.
These dashboards became central to management discussions. Users could drill into variances, explore trends, and get the context they needed—all in a clean, consistent layout.
Power BI alone, he says, would not have been enough. Zebra BI turned it into a decision-enabling tool. Without it, he might not have chosen Power BI at all. This alignment was key to making reports immediately understandable, consistent across formats, and visually intuitive for finance stakeholders, regardless of their technical skill.

Disclaimer: The data and comments on the image are fictional and intended solely to demonstrate the layout and structure of the dashboard.
Almir knew that simplicity drives adoption. He trained new users through live demos, designed dashboards with clarity, and kept advanced features hidden until users were ready. Zebra BI’s out-of-the-box functionality handled most needs, and when paired with Power BI bookmarks and modeling techniques, it created an unmatched reporting experience.
Zebra BI is a self-contained, self-explanatory tool. You don’t need to explain it—just show it.
Raiffeisen Bank Bosnia operates two reporting tracks: one in Power BI with Zebra BI, used for management reporting and planning discussions; and one in Excel, used for granular budget and forecasting tasks. Both run on the same data model. Zebra BI is the tool of choice when decisions need to be made, fast.
Zebra BI’s ability to deliver dynamic waterfall charts, time-based comparisons, and variance analysis transformed how Almir’s team reported performance. He specifically highlighted focus mode, drill-down, and interactive period selection as key features that helped less technical users understand complex metrics without needing extra explanation.
Building waterfalls manually in Power BI was a nightmare. Zebra BI solved that in minutes.
But one of the most impactful features? Commenting.
Rather than sending follow-up emails or attaching notes to slides, Almir's team could embed explanations directly into the dashboard, ensuring every viewer saw not just the numbers but the reasoning behind them.
It’s better to show the report first and explain later. With Zebra BI, the comments are right there—so people understand immediately.

Disclaimer: The data and comments on the image are fictional and intended solely to demonstrate the layout and structure of the dashboard.
The impact of Almir’s reporting transformation was immediate and lasting. What started as a local initiative in Bosnia quickly became a benchmark for financial reporting across the RBI network.
By replacing static PowerPoint presentations and fragmented Excel files with live, interactive Zebra BI dashboards, Almir helped his team shift from reporting numbers to explaining them. These dashboards became central to management discussions, allowing stakeholders to explore KPIs and instantly access the context behind the figures—all in one place.
Monthly reviews became faster and more focused. Finance teams stopped spending hours formatting slides and started spending that time analyzing trends. Even stakeholders with limited BI experience embraced the dashboards thanks to their simplicity and clarity.

Disclaimer: The data and comments on the image are fictional and intended solely to demonstrate the layout and structure of the dashboard.
Today, over 50 regular users across Raiffeisen Bank Bosnia rely on Zebra BI dashboards for decision-making.
Zebra BI’s built-in support for IBCS has also helped align reporting across countries and teams, turning visual consistency into a competitive advantage. What started as a local success in Bosnia is now helping shape how reporting is done across RBI’s network of banks.
The central BI team, through the BI Community led by Zoran Blagojević, continues to support this growth by removing adoption barriers and promoting best practices through internal workshops and events.
Zebra BI is now actively used in the Raiffeisen Banks in Austria, Serbia, Bosnia, Slovakia, and the Czech Republic. Some teams use it for core dashboards; others apply it selectively. In every case, it bridges the gap between technical reporting and business understanding.
Zebra BI makes Power BI more actionable. It brings clarity that helps drive real decisions.
RBI supports an internal BI community of 800+ members through:
Almir’s internal demos have inspired other banks to request licenses and replicate his approach.
This is more than just rolling out a tool. It’s about scaling a way of thinking—clearer, faster, smarter reporting for everyone.
Start giving your execs the answers they need.