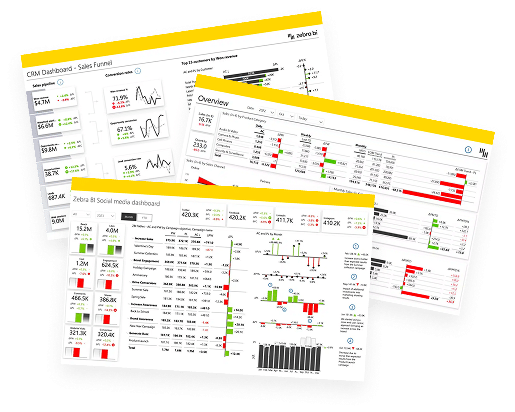
11 Ways Zebra BI SuperchargesFinancial Dashboards in Power BI
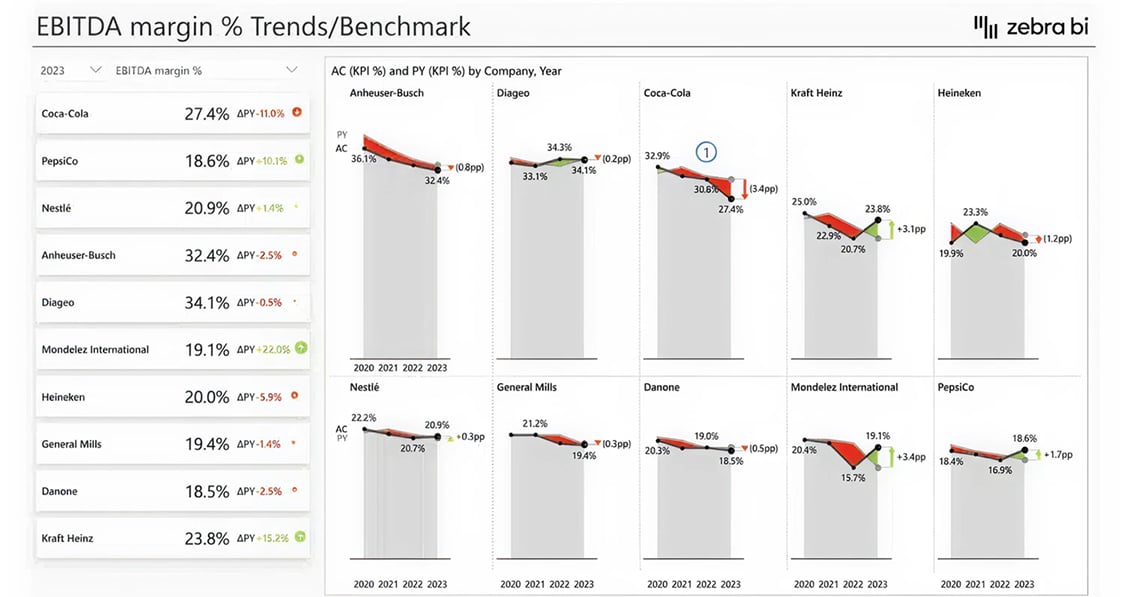
1. Trend Analysis: Spot patterns in financial performance and predict future outcomes.
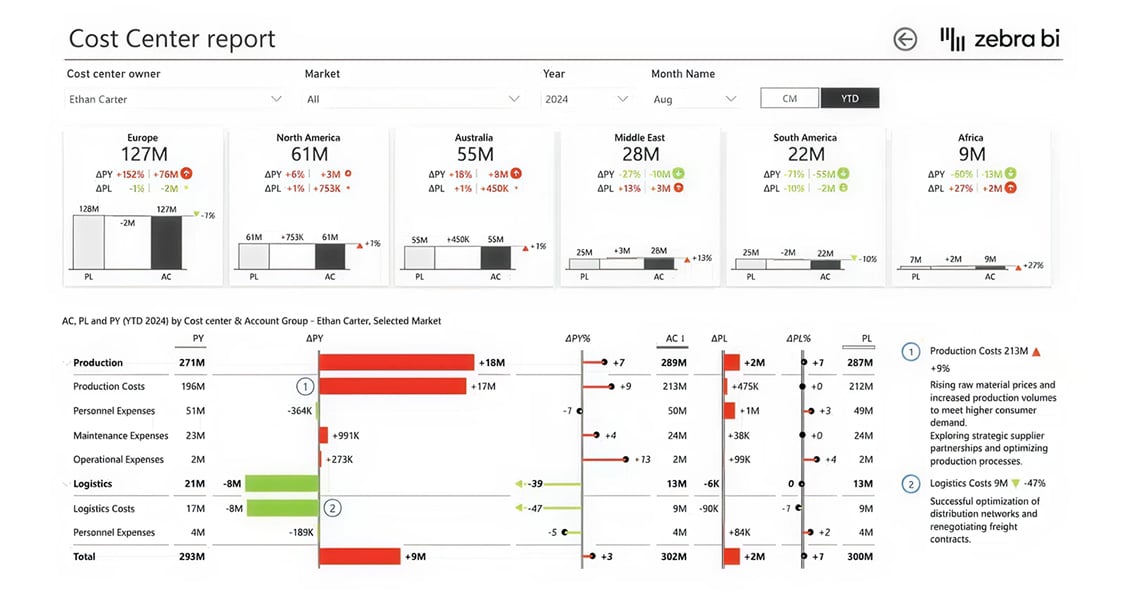
2. Variance Analysis: Compare differences in metrics such as Plan vs Actuals, Forecast vs Actuals, and Previous Year vs Actuals to determine areas of deviation.
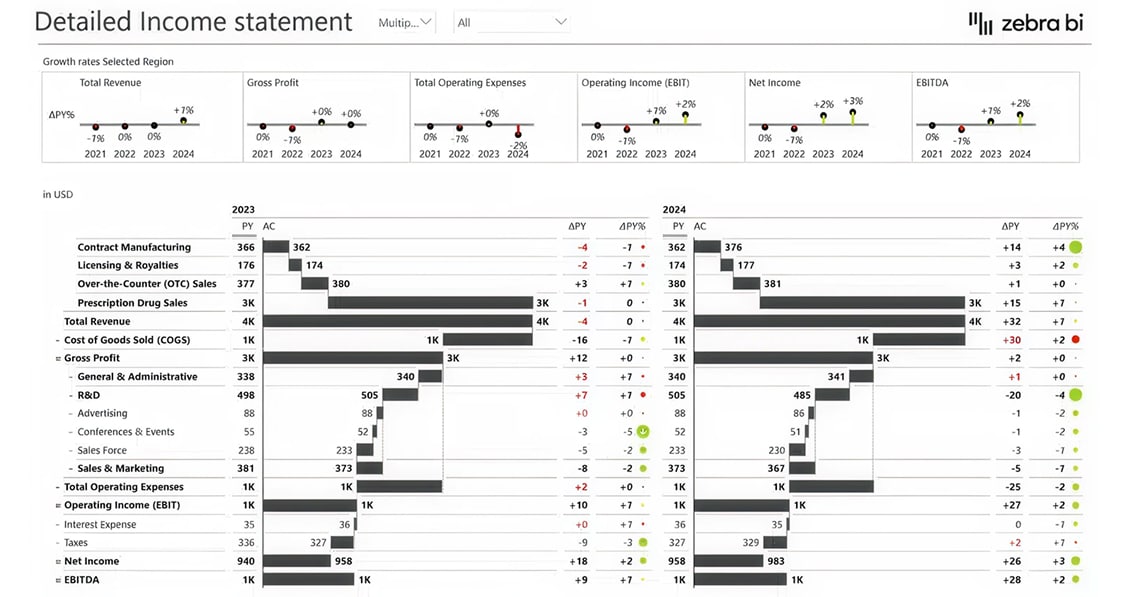
3. Financial Statement Analysis: Gain insight into financial health by analyzing income statements, balance sheets, and cash flow statements.
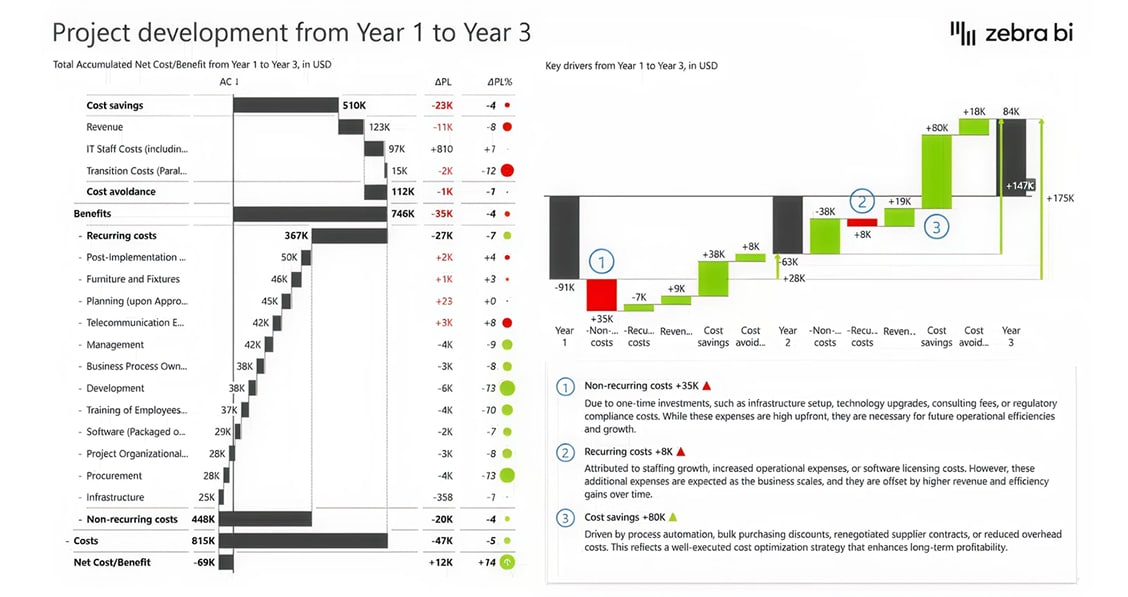
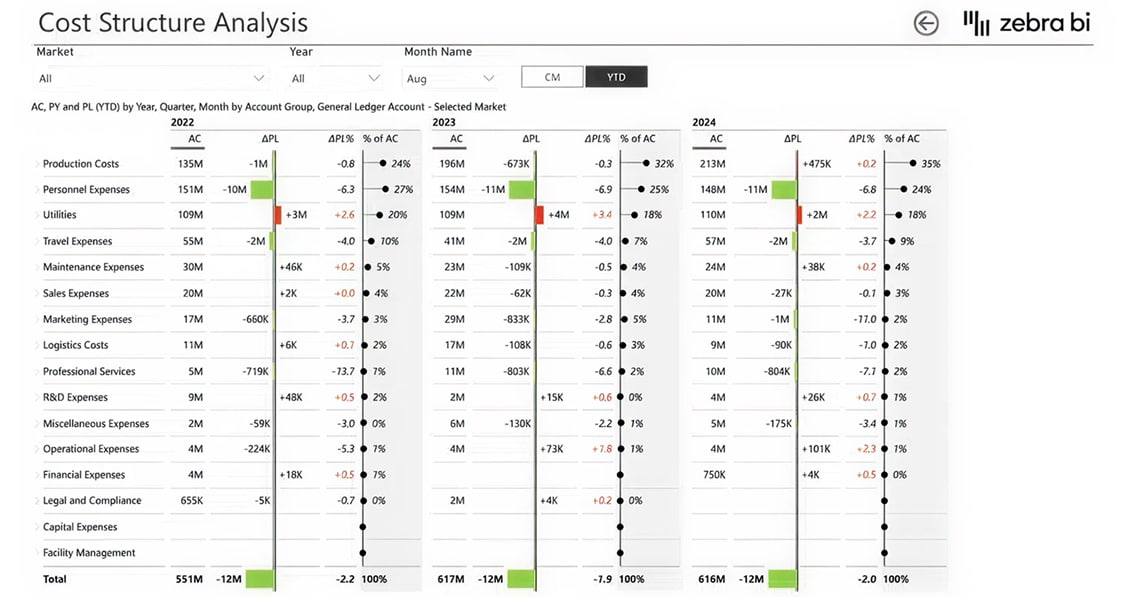
4. Structural (Breakdown) Analysis: Break down financial data into granular components to understand how each contributes to the overall picture
5. Financial Ratio Analysis: Use key ratios to evaluate financial performance, such as net profit and loss (P&L) Analysis, liquidity, and efficiency metrics.
6. Contribution Analysis: Assess how individual elements or business segments contribute to total performance or results.
7. Cost Analysis: Explore and optimize cost structures to improve efficiency and profitability.
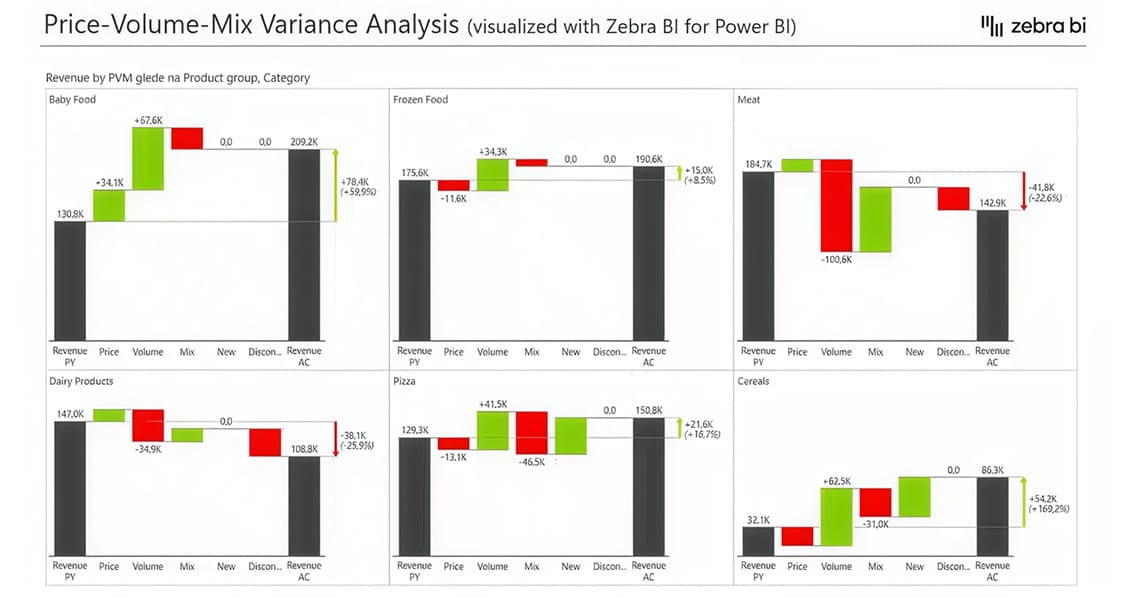
8. Price-Volume-Mix Analysis: Examine the relationships and impacts of price changes, volume shifts, and mix variations on profitability.
9. Drill-Down Financial Exploration: Navigate from higher-level overviews to transaction-level details for thorough investigation.
Loved by data-driven teams
The 6 Most Common Financial Metrics and Reports
A detailed breakdown of revenue, expenses, and profitability that helps you evaluate financial performance, spot inefficiencies, and uncover opportunities for growth.
Number 1
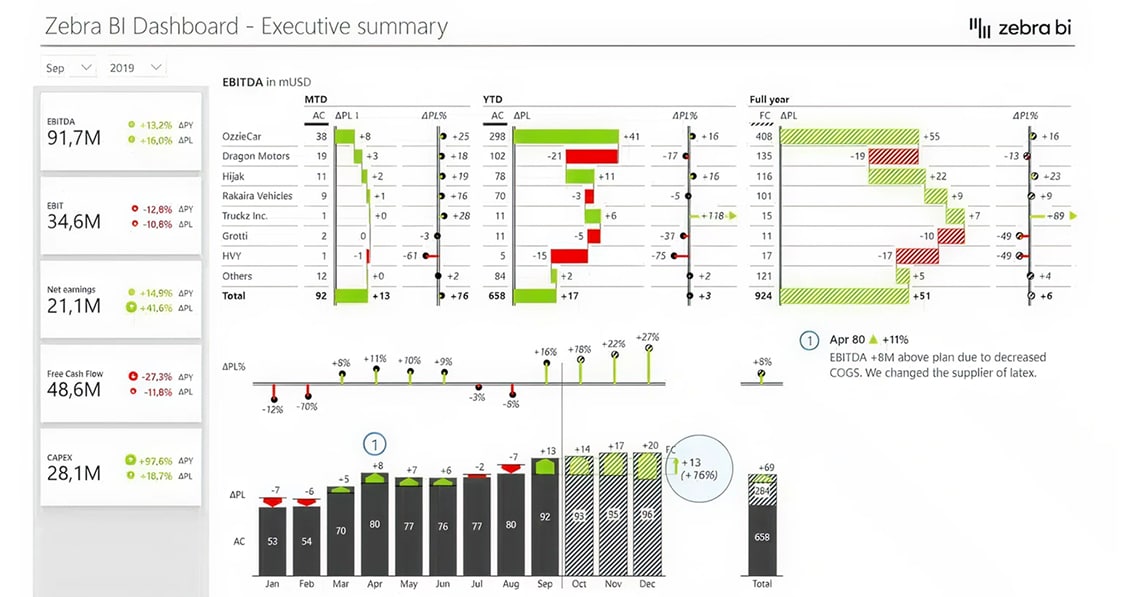
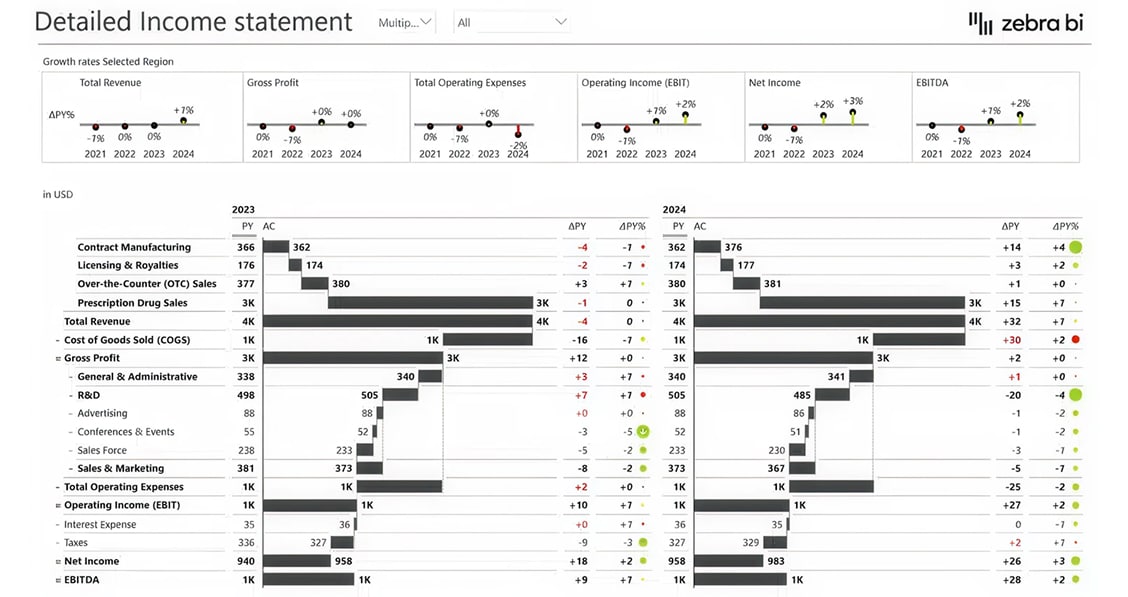
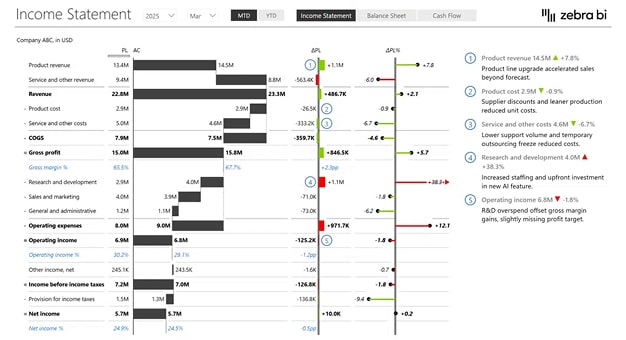
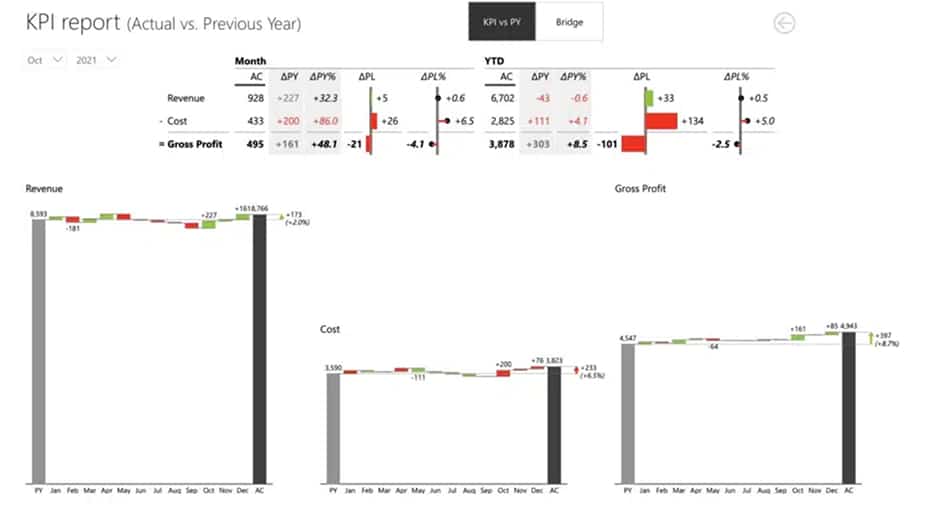
Income Statement
The income statement is a key financial document that tracks a company’s financial performance over a specific period. It includes total revenue earned, the cost of goods sold (COGS), gross profit, operating expenses, and overall profits or losses.
This report helps businesses understand their profitability and identify areas where they can improve efficiency or cut costs
Number 2
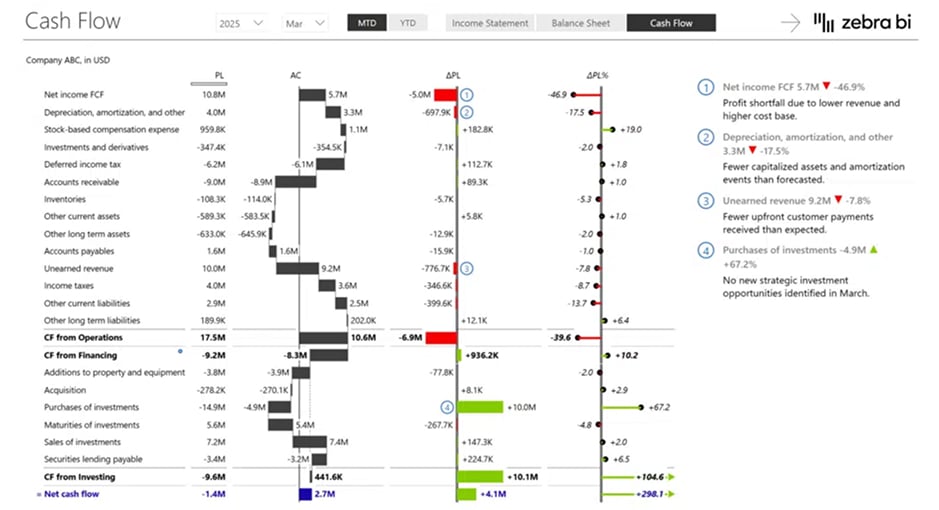
Cash Flow Statements
Cash flow statements provide a clear visualization of the movement of cash in and out of a business.
They highlight cash generated from operations, investments, and financing activities, giving insight into the business’s liquidity and its ability to meet financial obligations.
Number 3
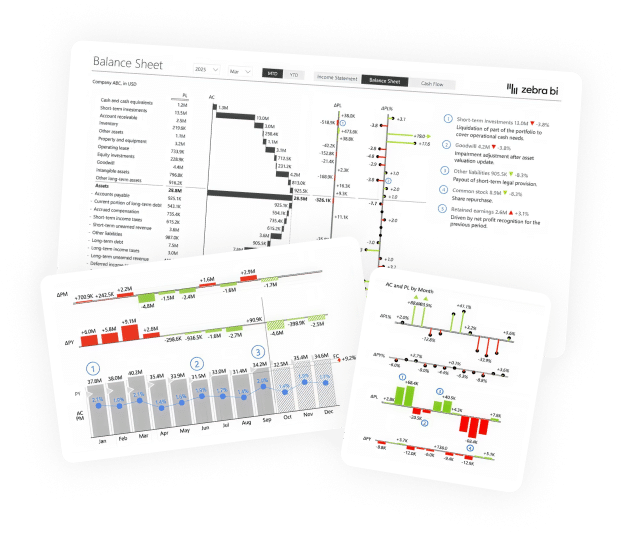
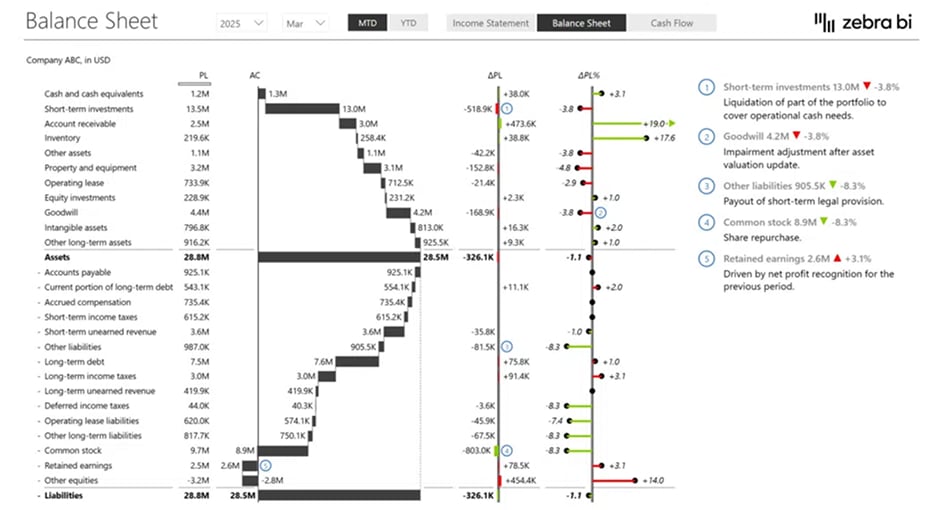
Balance Sheet
The balance sheet is a financial snapshot of a company at a specific point in time.
It includes details about assets, liabilities, and equity, helping stakeholders evaluate the financial health and stability of the business. It’s an essential tool for both internal analysis and external reporting.
nUMBER 4
Profit Margins
Profit margin analysis measures the profitability of a company by examining ratios such as gross profit margin and net profit margin.
These metrics help businesses determine how much income they retain after covering production costs and operating expenses.
Number 5
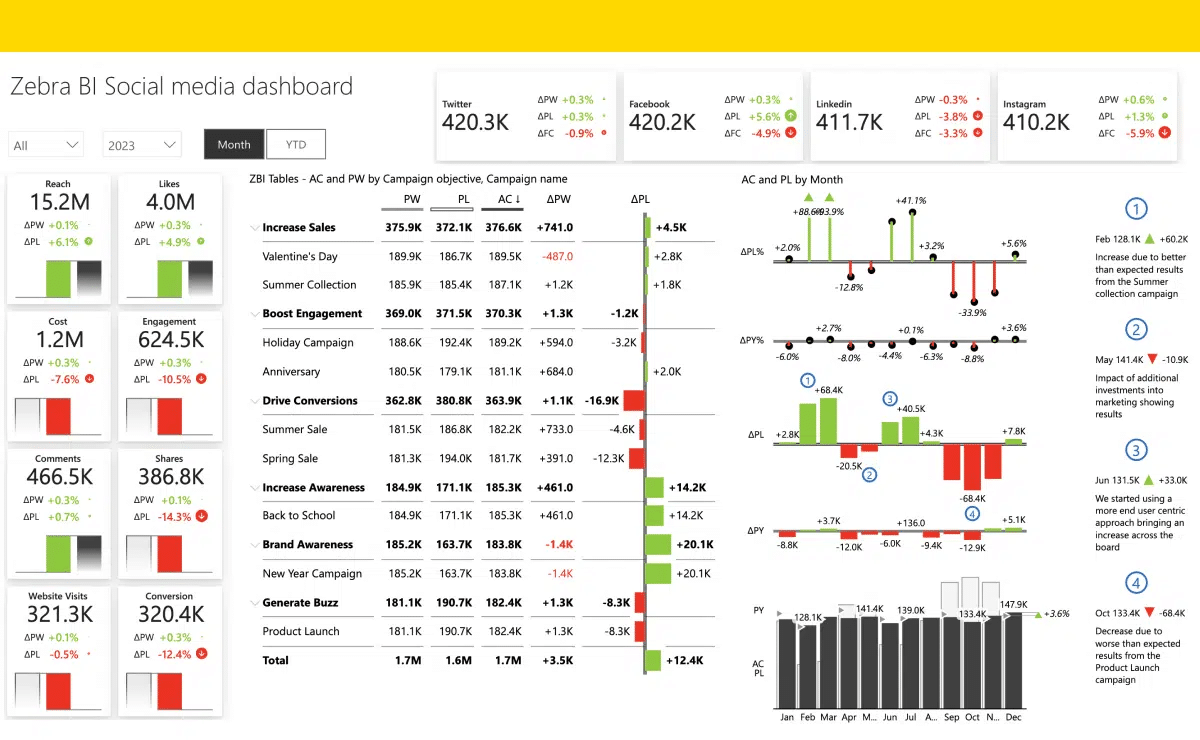
Sales Performance
Analyzing sales performance allows businesses to identify trends, top-performing products,and geographic sales patterns. This data is crucial for refining marketing strategies, improving sales techniques, and boosting total revenue.
By the way, you want to learn more about building insightful sales dashboards in Power BI, check out our guide about this
nUMBER 6
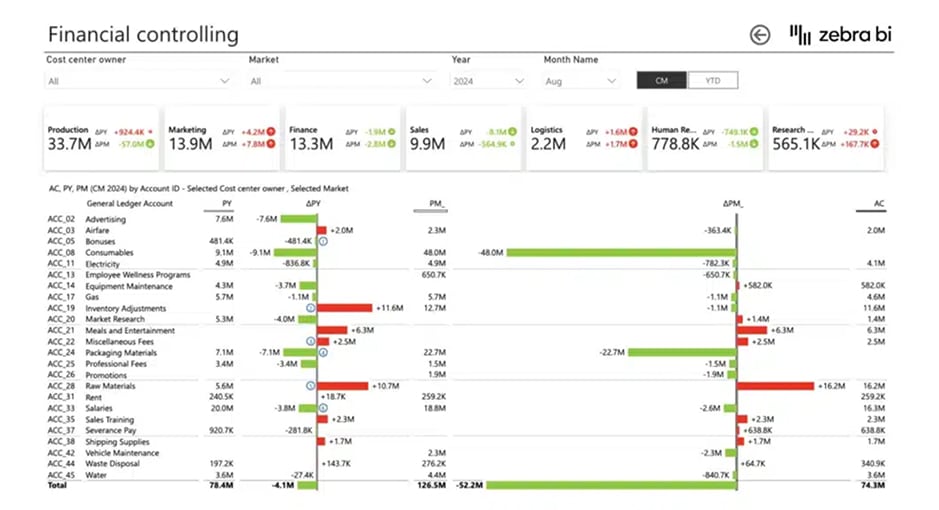
Operational Expenses (OpEx)
Operational expenses (OpEx) represent the ongoing costs of running a business.
Monitoring and optimizing these costs ensures the company operates efficiently while minimizing unnecessary spending, which can directly impact profitability.
Used where it counts
Who Uses Zebra BI?
CFOs
Track P&L across regions, monitor KPIs, and visualize EBITDA, cash flow, and margins at a glance. Deliver consistent, executive-ready dashboards that tell the financial story clearly.
FP&A Teams
Run scenario modeling and what-if analyses with ease. Compare forecasts vs actuals, automate rolling forecasts, and provide leadership with fast, flexible insights for decision-making.
Controllers
Produce standardized month-end and close reports, explain variances with dynamic visuals, and ensure reporting accuracy and compliance across the organization.
Business Unit Leads
Stay on top of operational KPIs in real time, from sales to productivity metrics. Drill down into product, region, or customer performance, align with finance through shared templates, and act quickly on opportunities or risks.
How to Create an Actionable Power BI Dashboard in 6 Steps
1
Define Goals
Set clear objectives to shape your dashboard design and avoid clutter.
2
Clean Your Data
Ensure accuracy and consistency with well-prepared financial data.
3
Connect Data Sources
Link Power BI to ERP, databases, and Excel for seamless integration.
4
Create Data Models
Structure data for efficient analysis and clear insights.
5
Build Visualizations
Design charts and reports to highlight key metrics.
6
Add Interactivity
Use drilldowns, slicers, and themes to engage users.
The Challenges
Challenges & Limitations in Power BI
Creating dashboards from scratch takes hours or days, especially for beginners. Without the right tools, this delays decision-making and reduces efficiency.
Creating dashboards from scratch takes hours or days, especially for beginners. Without the right tools, this delays decision-making and reduces efficiency.
Creating dashboards from scratch takes hours or days, especially for beginners. Without the right tools, this delays decision-making and reduces efficiency.
Creating dashboards from scratch takes hours or days, especially for beginners. Without the right tools, this delays decision-making and reduces efficiency.
Creating dashboards from scratch takes hours or days, especially for beginners. Without the right tools, this delays decision-making and reduces efficiency.
Everything You Need, All in One Place
Why Leading Financial Teams Use Zebra BI
Automated Variance Analysis
Instantly spot and explain variances — spend less time checking, more time strategizing.
Drill Down Capabilities
Explore data at any level — from cost centers to GL accounts — for deeper, clearer insights.
Standardized Reporting
Create IBCS-compliant reports with consistent layouts that build trust and clarity.
Complex Reporting Made Easy
Simplify multi-version reporting and scenario analysis with ready-to-use visuals.
MORE THAN 1,500,000 EXPERTS USE OUR PRODUCTS DAILY
Hear it from our clients
“Zebra BI cut our dashboard creation time in half - and made the results easier to present to leadership.”
Ivana M.
Sr. Financial Analyst, Abbott
“These visuals weren’t just cosmetic upgrades—they helped us tell the right story faster and better.”
Pawel Raiter
Director of the Global Marketing, Commercial & PACS Intelligence team
“Before Zebra BI, we were spending hours manually assembling reports. Now, everything updates automatically, and leadership can access real-time data anytime.”
 September 8th
 February 22nd