IBCS Certified
Microsoft Certified

From Data to Insights. Instantly with Zebra BI.

#1 reviewed custom visuals
Create interactive, decision-ready dashboards that simplify your reporting and speed up decisions.
3.000+ companies are growing their businesses using Zebra BI
Loved by data-driven teams

Zebra BI Visuals are  #1 custom visuals for Power BI

Zebra BI Charts, Tables, and Cards are used by thousands of business analysts around the world. Available on Microsoft AppSource.
4.9
IBCS Certified
Microsoft Certified

Free 30-day Zebra BI For Power BI PRO Trial

    Ready-to-use tables, charts, and cards
    Serve execs and analysts with one report
    Standardize reporting across teams
    Speed-up decisions
    Increase Power BI adoption
    Stay secure & compliant

Fill out the form and get started

Advanced reports

One report. Multiple views. All in one visual.

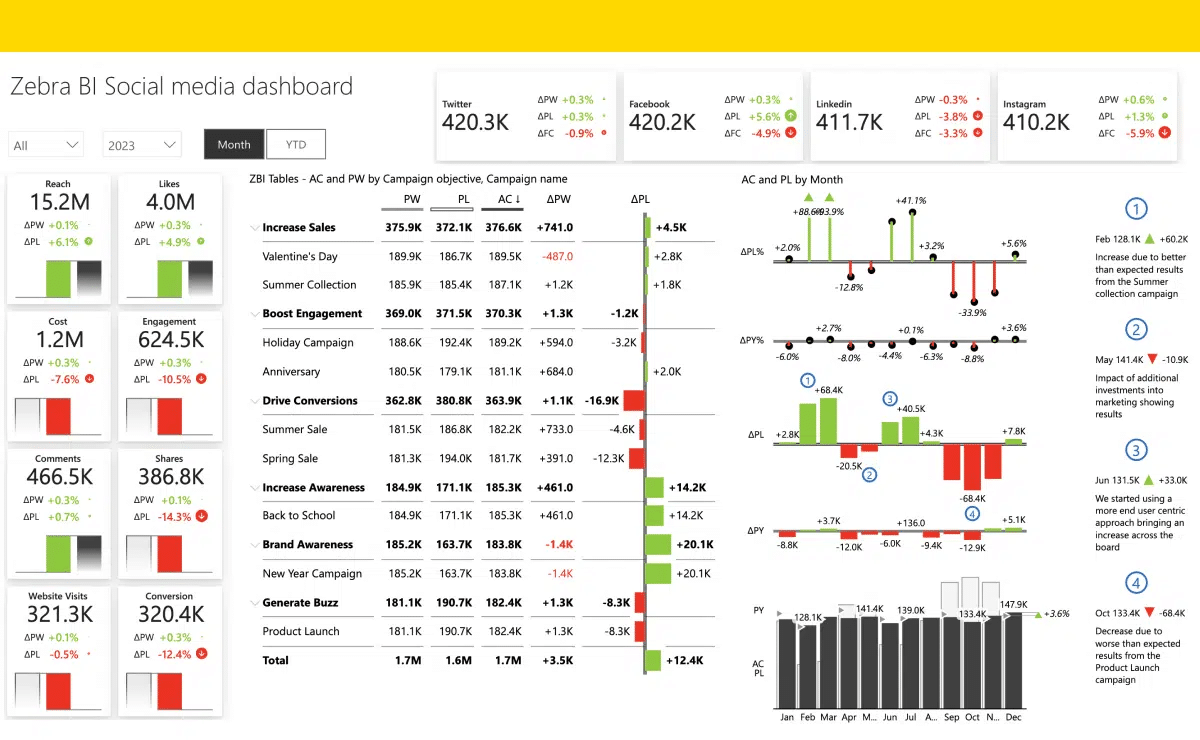
Build any report you need – from financial and sales dashboards to operational overviews – using Zebra BI's three powerful visuals: Charts, Tables, and Cards. Customize every detail, and effortlessly switch between multiple chart or table types within a single visual to serve different stakeholders with one report.
Visualization variety

All the charts you need.

Design the perfect view for every insight without switching visuals. Choose from stacked, combo, segmented, or waterfall charts, and more. You can even create small multiples or use tables with integrated charts — all with a single click.
Used by Experts. Built for Results.

Trusted by the world's leading professionals

150,000+
data professionals leverage Zebra BI product and resources
3,000
clients rely on our services and
trust us with their businesses
114
Countries from across the world uses Zebra BI
*Over 1 million Zebra BI users trust us worldwide. View customer by industry
Comparisons

Calculate comparisons out-of-the-box

Compare your data to something and put it into perspective. Variances are the holy grail of reporting because they help you understand performance in the right way. Zebra BI's utterly flexible and intuitive business Charts, Tables and Cards automatically calculate absolute and relative variances for you!
Annotation layer

Add context to your data

Explain the why behind the numbers by adding comments directly on your visuals - no need to manage them in the data model. All annotations stay with the visuals and comply with Microsoft certification (no write-back to the model).
ADvanced Multiples

Supercharge reports with advanced Small Multiples.

Create multiple charts to compare various data categories and discover insights in just a few clicks. All charts perfectly scaled. Zebra BI visuals contain the most advanced algorithms for rendering small multiples among BI software so far.
Formula editor

Calculate new measures on the fly with Formula Editor

Goodbye complex data set changes, hello custom calculations! Whenever you want to add a new element to your table and it's not in your data set, you can simply calculate it with a Formula Editor. That’s how you can add completely new elements to your tables. Without doing any work on your data set
MORE THAN 1,500,000 EXPERTS USE OUR PRODUCTS DAILY

Hear it from our clients

“Zebra BI cut our dashboard creation time in half - and made the results easier to present to leadership.”
“These visuals weren’t just cosmetic upgrades—they helped us tell the right story faster and better.”
“Before Zebra BI, we were spending hours manually assembling reports. Now, everything updates automatically, and leadership can access real-time data anytime.”
View more Success Stories
Responsive layout

Adapt information density with responsive layout

Zebra BI visuals for Power BI are the world's first fully responsive visualizations. The visuals will automatically adapt the amount of information presented to fit the available space.
Multiple KPIs

Add multiple KPIs within one visual

With Zebra BI Cards, you will transform the way of representing your Key Performance Indicators or your scorecard. Speed up the rendering and loading time of your reports significantly by adding as many KPIs as you need in one visual. Create a comprehensive entry page of your dashboard and use drill-through to access more detailed report pages with Charts and Tables!
Report Templates

Customizable bussiness report templates

carefully designed to cover every detail of your report.
Dashboard styling

Style your dashboards for best clarity

Use endless possibilities to design stunning reports and dashboards that work best for your business. From advanced highlighting to standardizing specific elements such as labels or even the design of all reports across the company with custom themes. All compliant with IBCS reporting standards.
visual styling zebra bi power bi
Advanced reporting

Create even the most advanced reports

Use enhanced report page tooltips for deeper insights.

Zebra BI report page tooltips can deliver much more details and insights than native Power BI tooltips as they can show additional dimensions that aren't even part of the visual.

With the Top N + Others functionality you can even limit the number of categories that are displayed and highlight only those with the greatest impact on your business.
IBCS Certified
Microsoft Certified

Free 30-day Zebra BI For Power BI PRO Trial

Start Free Trial
    Advanced small multiples
    All chart types
    P&L / Income Statements
    Flexible design
    Integrated Dynamic comments
    Unlimited number of KPI cards
arrow-right