 September 8th
 February 22nd
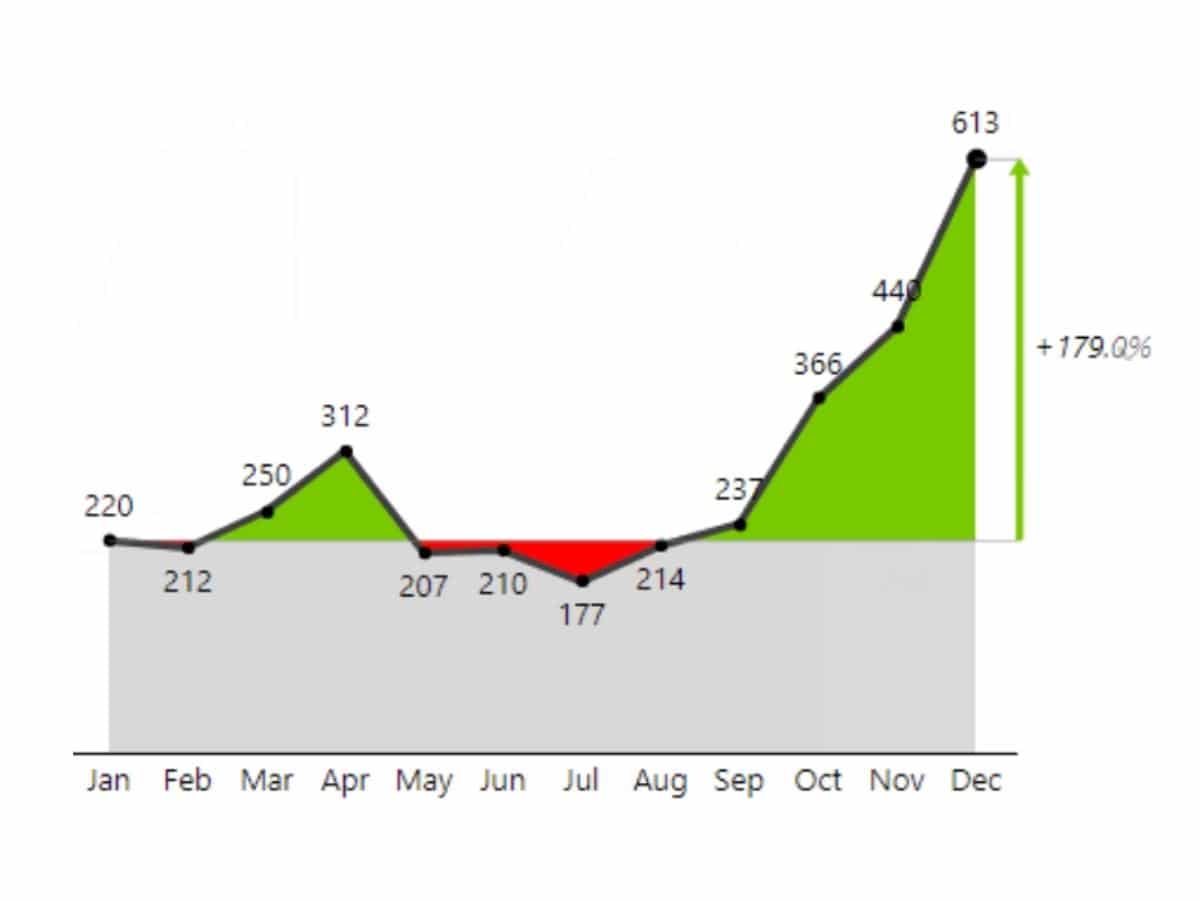
One visual, many charts. Simply click on the side arrows to get your data visualized in the most appropriate way. Zebra BI renders any chart you want: from a waterfall, variance, column, area, line, dot, lollipop, ‘hills&valleys’ to many others.
Professional data analysis made as easy as browsing pictures on your mobile phone.
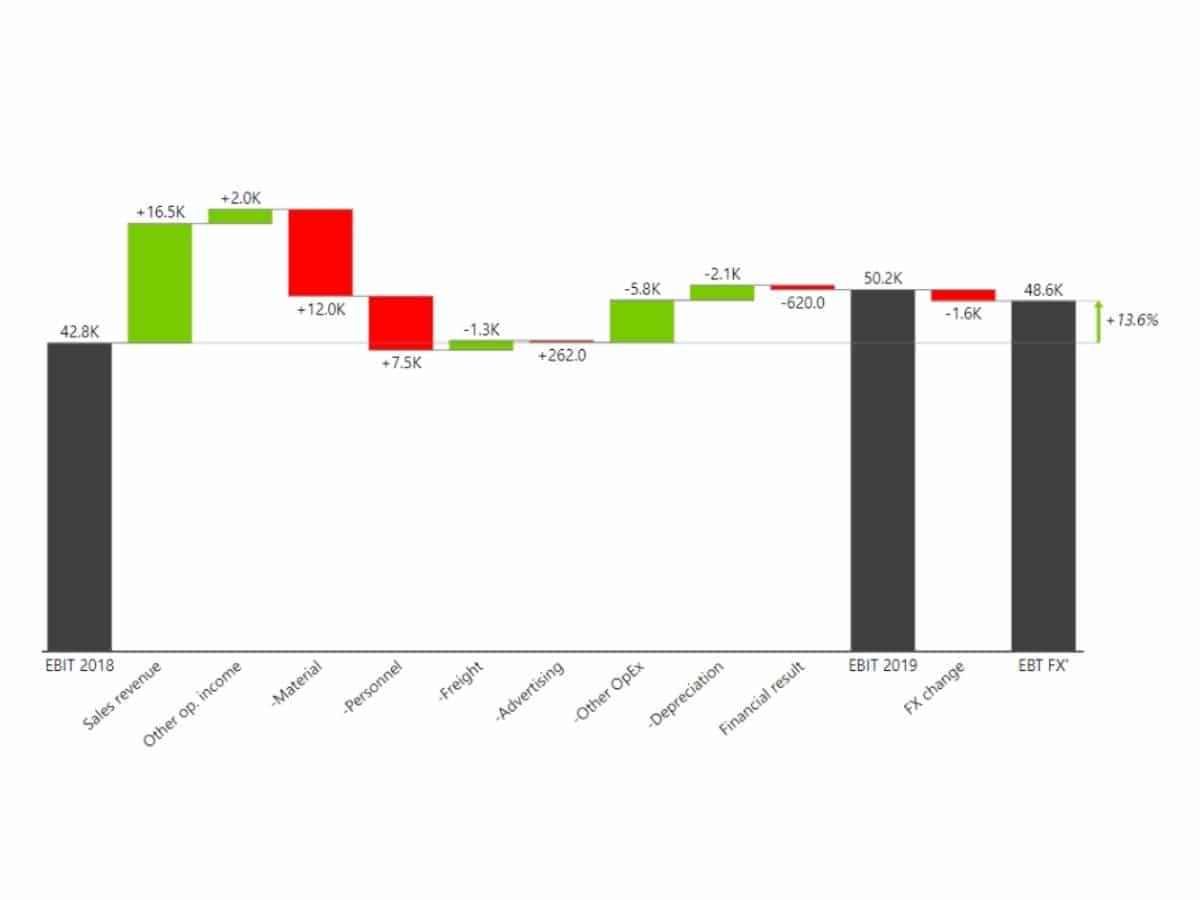
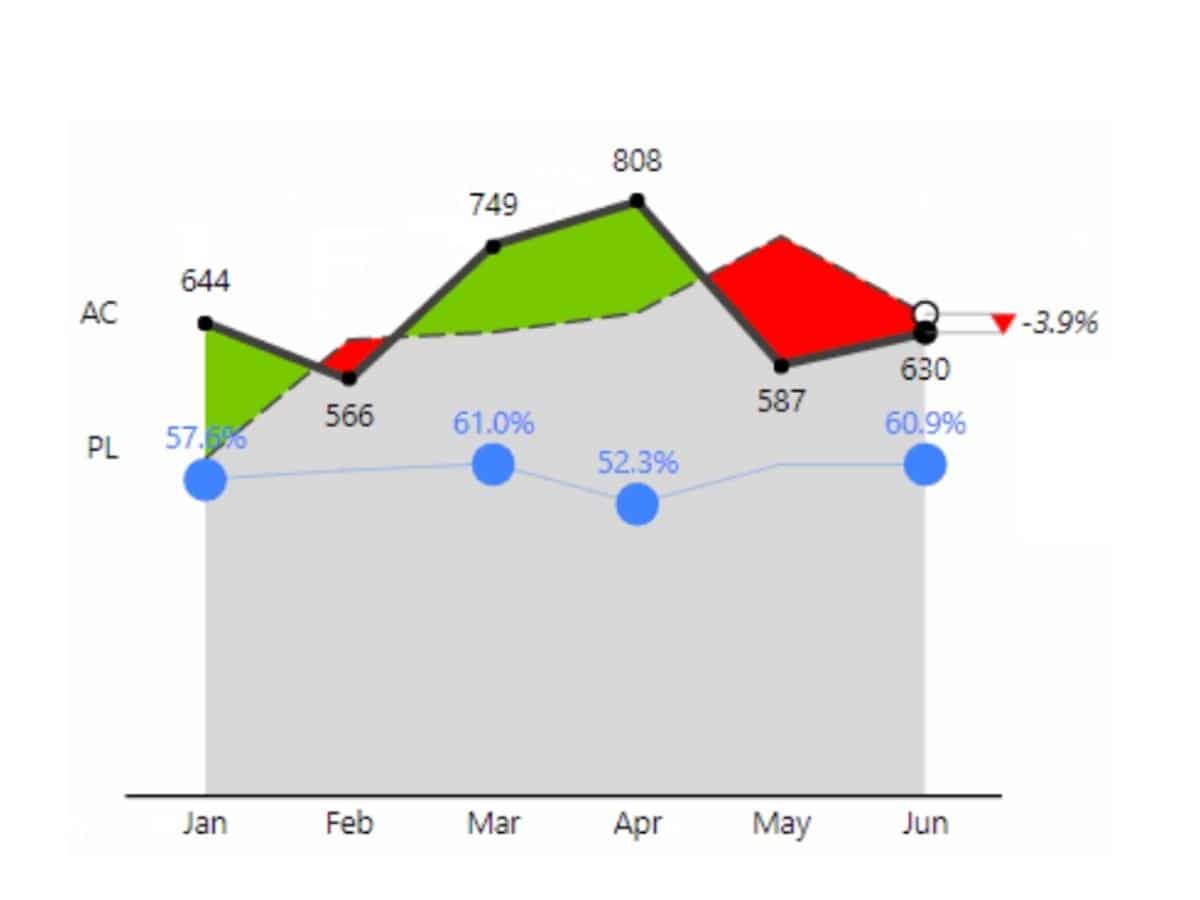
Let Zebra BI visuals automatically calculate absolute and relative variances for you, saving you weeks in developing advanced reports.
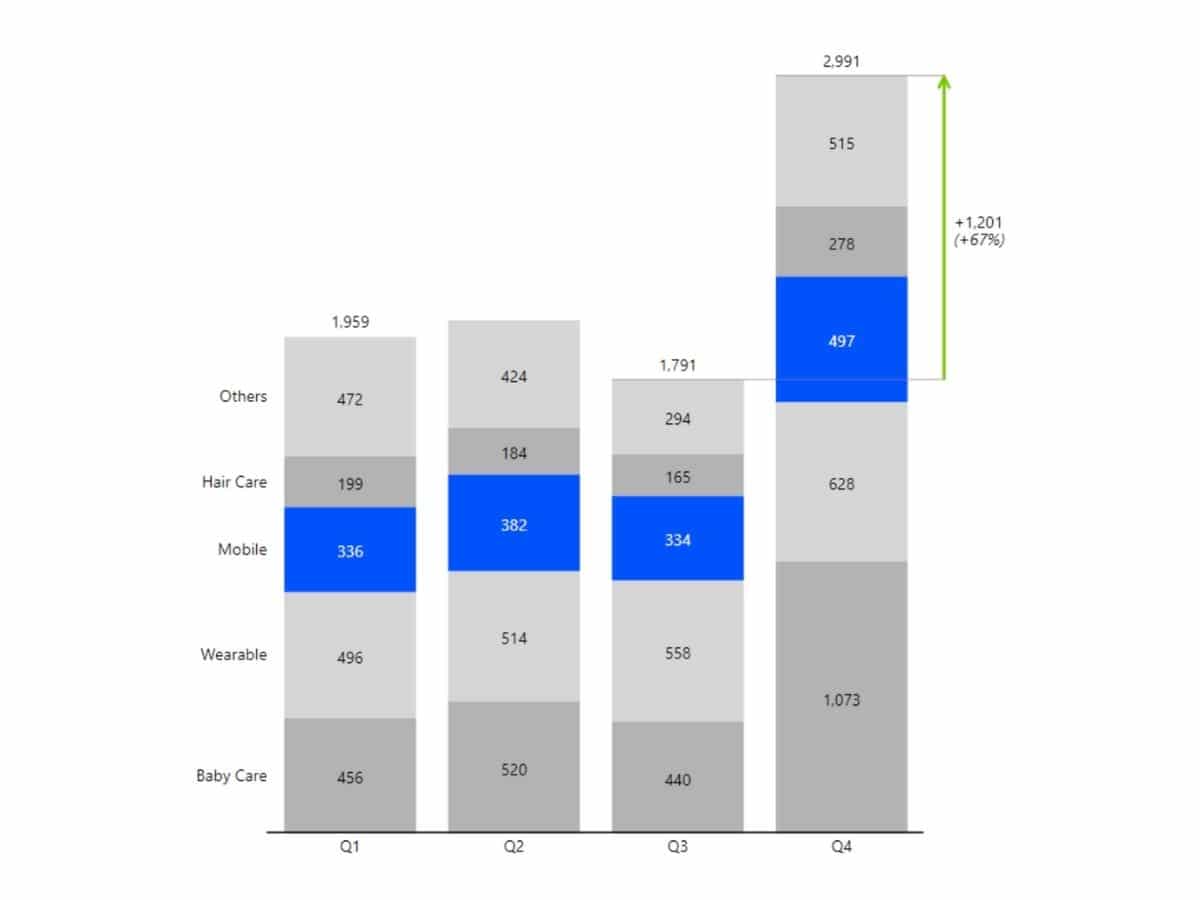
Highlight the categories that had the greatest impact on your business and limit the number of categories that are displayed in the visual with the Top N+Others function. All the other values are shown as Other element.
Zebra BI visuals for Power BI are the world's first fully responsive BI visuals, making them perfect for large screen dashboards such as in digital boardrooms, as well as for mobile apps.
Use endless possibilities to create stunning charts that work best for your business. From customizing variance areas and highlights to flexible number formats, fixed layout, displaying units in titles, and changing colors, fonts, shape, and much more.
You can also control the behavior of visuals for the whole company from one central place by setting up your own Custom Theme using JSON.


Small multiples are considered one of the most powerful data visualization methods and Zebra BI visuals contain the most advanced algorithms for rendering small multiples among BI software so far.
It doesn't matter what field you work in - you probably needed to compare multiple categories of data at some point. Using small multiples allows you to immediately see which categories are the most important and also analyze the trends.
Use dynamic Comment Markers for comments to appear in the tooltip when you hover over them. You can also use a Comment Box to display dynamic comments next to your charts in Power BI reports. Right inside the visual!
Comments are completely dynamic so you can simply switch the time period to see the relevant ones only.
Switch between the vertical and horizontal orientation of your charts whenever you need to. This way you can always make sure that the labels and data are displayed in the way you want.
Supported with integrated, waterfall, column, and pin charts.
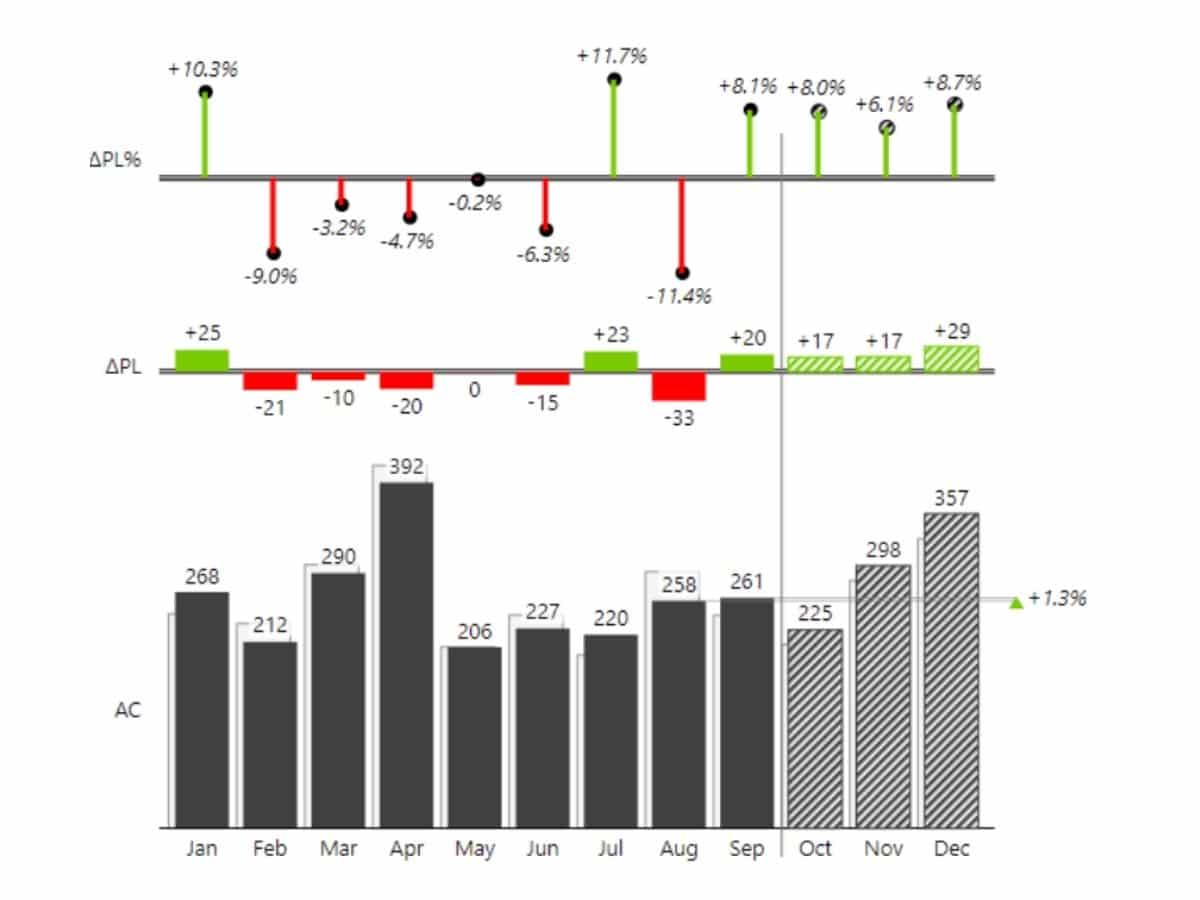
Not sure how would you do this with native Power BI visuals? With the help of the Zebra BI visuals, you can add and compare forecast values in just one visual without creating a mess. Because all this is done within one single chart, all the data bars are scaled and can therefore be compared to each other.
Change the number of charts displayed with one simple click. Even your viewers can increase or decrease the number of charts.
P.S. When you change the number of charts, everything else is still automatically calculated in the Other chart.
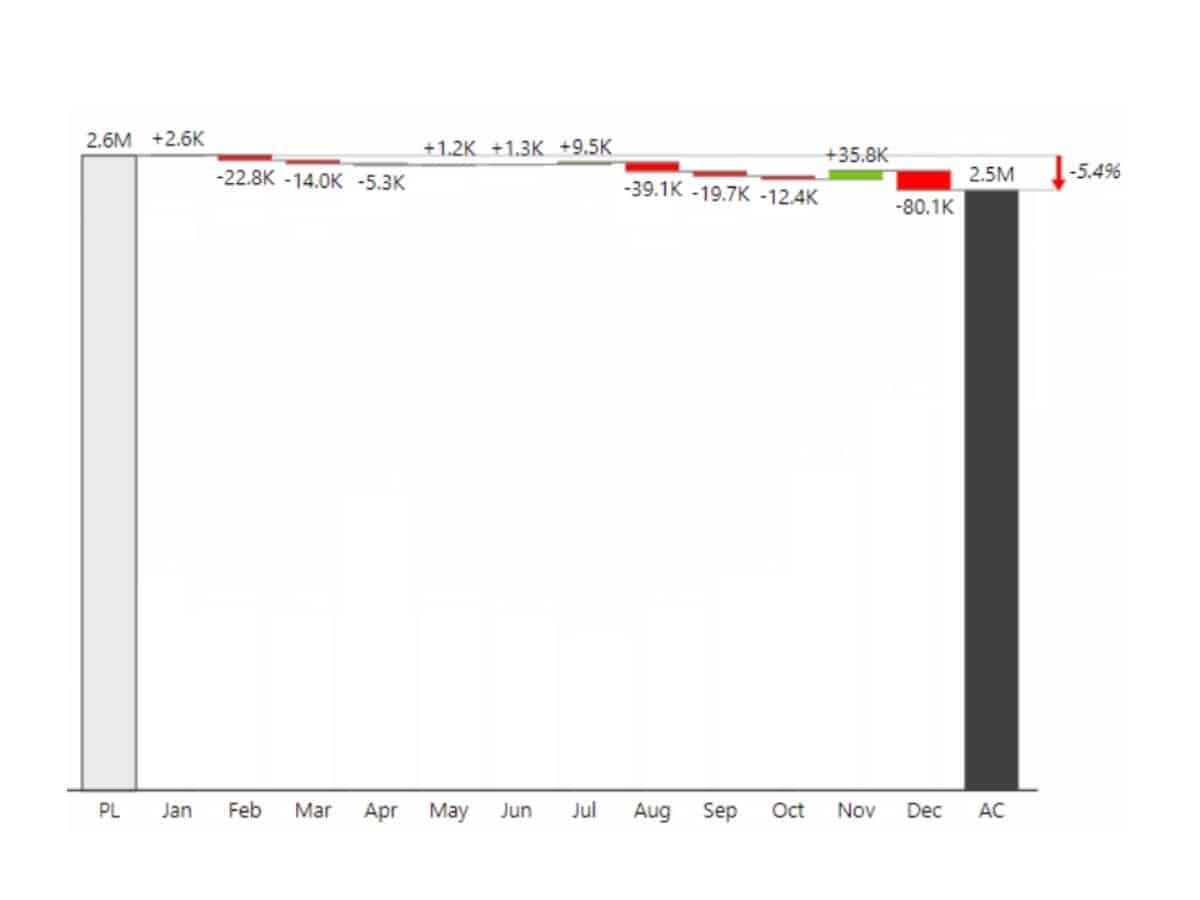
Axis break, while being a slightly controversial dataviz method, can help present the contribution of data elements to the total result more clearly.
This frequently requested feature in business reporting is just one click away with Zebra BI.
Provide additional insights to report viewers with Enhanced Tooltips that are way more powerful than native Power BI. Deliver much more details and insights by showing additional dimensions that aren't even part of the visual.
Since the report page tooltips are actually designed on a separate page in Power BI reports, there are endless possibilities of what you show in the tooltip and how you design it.
You can now highlight specific columns with a color of your choice. Right-click on axis labels and choose to highlight any element. The default color of the highlight can be set in the Style, but users can change the color of each individual highlighted element. The highlight is completely dynamic so if your end users sort tables in a different order, the highlight will stick with its data category.
Interactively explore data from a top overview down to the detail. Just add multiple data fields or even better, a hierarchy, into the Category.
Sounds trivial, but so many Power BI users out there are struggling to set up their favorite number format.
Not in Zebra BI! Simply choose to display negative values in parentheses or with a minus sign from the menu.
Many well-thought features of Zebra BI (such as Chevron Arrows etc.) make sure that your charts are understandable also for people with color vision deficiency (CVD).