 September 8th
 February 22nd

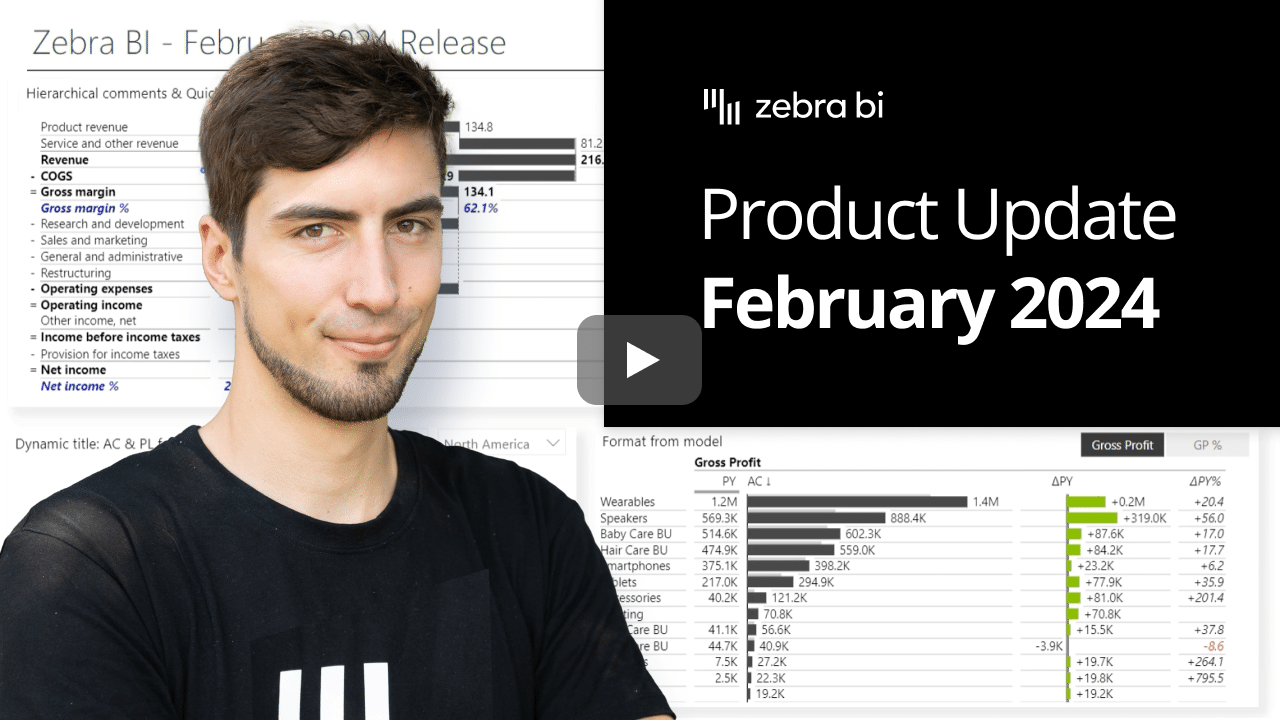
Now adding comments to an existing report is almost easier than adding the visual itself. 👀 You can add comments at every level of your hierarchical tables, ensuring all details are communicated clearly.
With Tabels 6.7, accessing and navigating comments is simple, even in the collapsed state. A small blue dot will appear, indicating the presence of hidden comments. By simply clicking on the dot, you can expand the relevant level.
Enhanced dynamic comments provide clarity, context and insights directly within your report. From detailed analysis to strategic planning, these insights drive informed actions. 🎯
You'll never lose your formatting settings from the model again. Say hello to formatting that aligns with your data model, simply switch the data label units setting to the "Power BI" option.
This feature is particularly useful when using slicers or filters to display diverse numerical formats within a single visual. As shown in the example, where we’re switching between KPIs formatted in millions and in percentages. 👈
You can now easily manage diverse data sets with slicers or filters while maintaining formatting integrity.
By utilizing predefined formatting values from your Power BI model, data representation across visuals remains consistent, enhancing overall visualization quality. 🤩
Analyzing your data just got a whole lot easier and quicker with "Quick column calculations" feature. With a range of preset calculations, like percentages of grand totals and running totals, you can apply calculations directly to your visualizations.
Customize columns, rename, switch to charts, and format as needed, tailoring your analysis to suit your business needs and preferences. No need to deal with adding additional measures to your data model with DAX, simply add those calculations on the fly, with just 2 clicks.
No more manual calculations in your Power BI model. This feature saves you time and reduces the risk of errors. Now, you can focus on interpreting insights, not performing repetitive tasks.
In interactive dashboards where cross filtering is common, it's crucial for visual titles to dynamically adjust to slicer values. This ensures viewers immediately grasp the filtered data's context, leading to better understanding of complex dashboards.
Now, your visual titles adjust to slicer values, ensuring clear communication of data presented and adds an extra layer of clarity and interaction. It is easier to understand data subsets and insights when titles are clear and context-rich.
This results in dashboards that are more usable, understandable, and easier to interpret.
Enjoy the flexibility of adding comments at any level of the hierarchy, easy locate hidden comments with a simple click when collapsing row
The date format is now being correctly recognized in groups and doesn’t display the long date-time format anymore
Using the TopN no longer prevents the data from being filtered out
Dynamic visual title with references to fields and measures; by adjusting the title content and referencing the pre-prepared measures, the title dynamically adjusts to the selected values
By popular request, we have added support for word wrapping of category names. If you’re using long category names, you can set the option to wrap the labels. Note: this approach is not IBCS-recommended. Better and more correct solution is to rotate the axis to display a vertical chart.
If you're using the AppSource version of Zebra BI (version 4.0.0 or higher), then your Zebra BI will be updated via Microsoft's AppSource marketplace automatically once processed. Expected release dates according to the Microsoft Power BI team:
If you're using an older (private) version of Zebra BI (e.g. 3.x.x or older), then this is a perfect opportunity to update your Zebra BI! When ready, just shoot us an email at support@zebra.bi and we'll help you migrate to the latest version.
Haven't tried Zebra BI before? Opt in for our 30-day free Pro trial here: