 September 8th
 February 22nd
 10 Jul 2025

Creating reports is crucial for communicating data insights effectively. However, the gap between the detailed reports analysts create and the insights executives need may be significant.
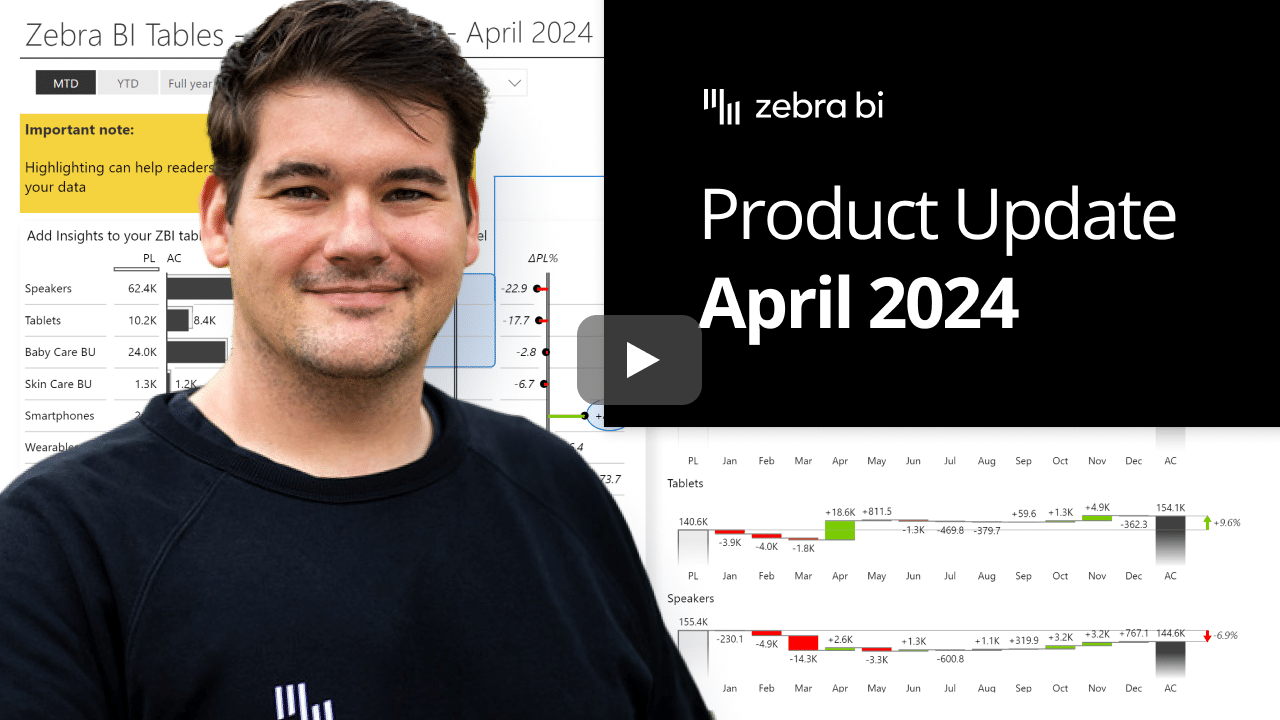
In this sense dynamic commentary is a game-changer. It is the missing link between raw data and actionable insights, providing real-time explanations directly in your Power BI reports.
Comments explain the "why" behind the data, making decisions easier for everyone involved. Instead of spending forever trying to understand the report, you can get the insights you need fast and make decisions on the spot. 🎯
Imagine reports that speak for themselves, eliminating the need for endless revisions and misunderstandings. It's like having a built-in translator for your reports that makes complex data instantly understandable.
Add comments directly on the visuals, edit and delete them, highlight key points and easily tell dynamic data stories. Whether you are an experienced analyst or an intern, you can enrich your reports instantly.
Comments don't need to be integrated into the data model first, but are available to everyone immediately right out of the box. This gives you the freedom to communicate insights on the fly.
We know it sounds too good to be true, but trust us—it's possible!😊 With instant insights and explanations directly on the reports and dashboards, meetings become more focused and efficient, saving you valuable time and energy. Participants spend less time trying to understand the data or asking questions. The result is shorter, more productive discussions and faster decisions.
Dynamic comments speed up decision-making, make meetings shorter and the results even better.
Combine qualitative and quantitative data in your reports easily on one page. All in a single tool. With real-time data updates, your reports always reflect the latest insights. And when you share your reports with your team, everyone sees the same data and can work on it together.
This means you no longer need an extra meeting or 10 emails to understand the why behind the numbers, as anyone can add their insights in the form of comments to a report without prior BI knowledge. The only truly collaborative way to create reports.
With Zebra BI Tables and Charts, no extensive data modeling or Power apps are required. Comments are immediately available to everyone, right out of the box. 🥳
Unlike other methods such as write-back, where the original data can be altered, we ensure that the comments are stored securely and separately from the primary data. This reduces the risk of errors and provides more flexibility and control when managing comments. In addition, our Microsoft certification guarantees the highest quality and security standards.
In summary, Zebra BI's dynamic comments in Power BI revolutionize the way reports are presented and understood. You can easily add, edit and delete comments directly on visual, highlight key points and tell dynamic data stories with ease.
The flexibility to adjust comments based on filters and slicers ensures that insights are always relevant. By leveraging the power of dynamic commentary, you can put an end to the cycle of report revisions, improve communication, and ultimately drive meaningful decision-making.
It's like upgrading from a basic report to a powerful storytelling tool.
To comply with Microsoft certification requirements, all comments are saved within the visuals and are not persisted back to the data model, means no write-back to the data model.
You can use slicers, filters, and other visual elements to filter the contents of your Tables, and annotations (comments and highlights) will respond to your filtered state correspondingly.
If you're using the AppSource version of Zebra BI (version 4.0.0 or higher), then your Zebra BI will be updated via Microsoft's AppSource marketplace automatically once processed. Expected release dates according to the Microsoft Power BI team:
If you're using an older (private) version of Zebra BI (e.g. 3.x.x or older), then this is a perfect opportunity to update your Zebra BI! When ready, just shoot us an email at support@zebra.bi and we'll help you migrate to the latest version.
Haven't tried Zebra BI before? Opt in for our 30-day free Pro trial here: