Zebra BI Visuals, the only IBCS®-certified software solution for Power BI, has just been updated to version 1.3 that brings several exciting new features that make it easier to create convincing and clear visual business presentations in Power BI.
This release is available for existing subscribers as well as a free trial and delivers improved comparisons and more options for formatting and designing data.
Let's browse through some of the new features in version 1.3:
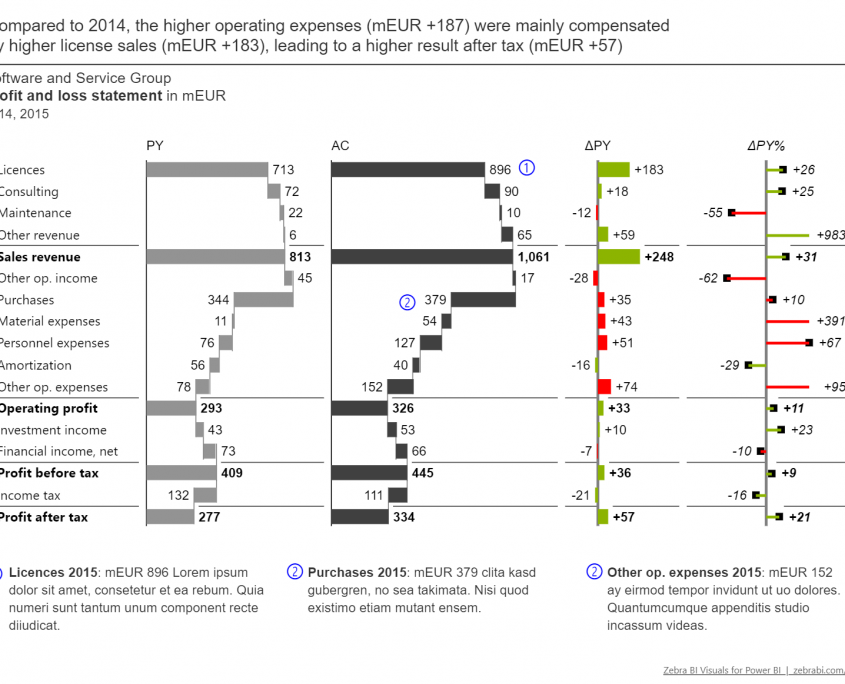
Pixel-perfect profit and loss layouts with waterfall charts for improved readability
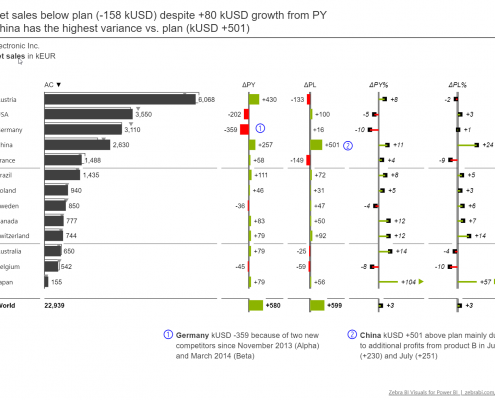
Support for multiple scenario comparisons that delivers the highly requested actuals vs PY vs plan reports
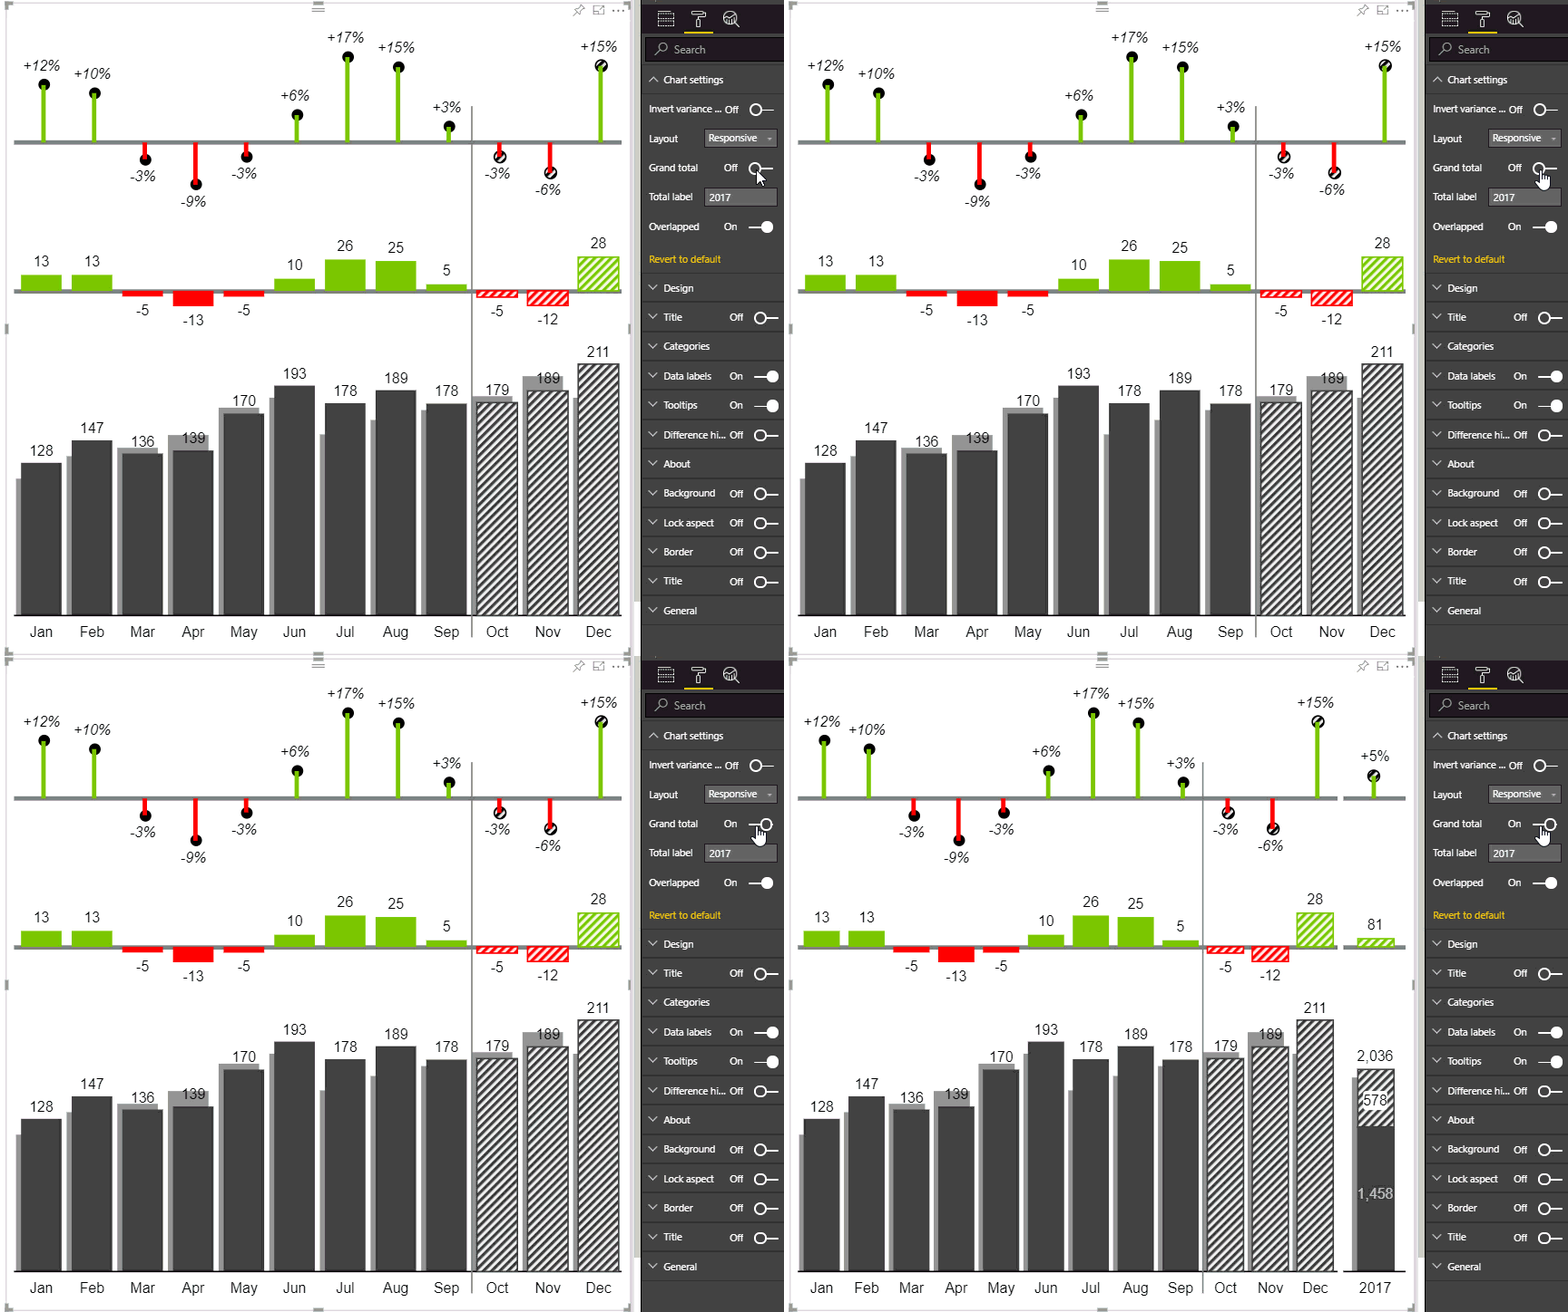
Ability to display yearly totals next to monthly charts within the same visual
Additional improvements to small multiples
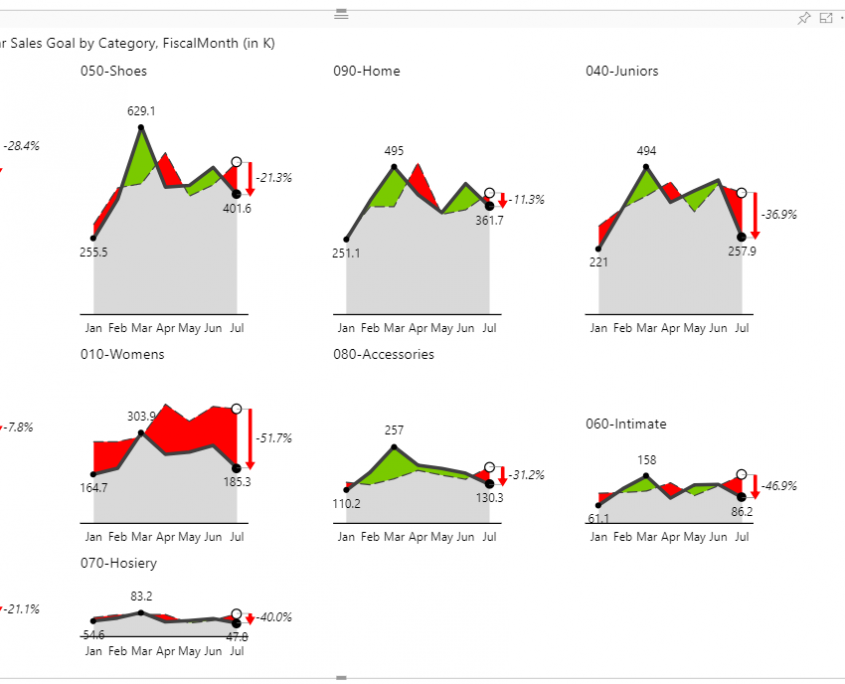
By setting the advanced layout options for small multiples and by controlling the minimal width of data categories in charts, you now have even more control over creating high-density displays of your data. Make sure you check out the 'Auto' and 'Smart row' datavis algorithms in Small multiples section and try out which sort order best suits your needs:
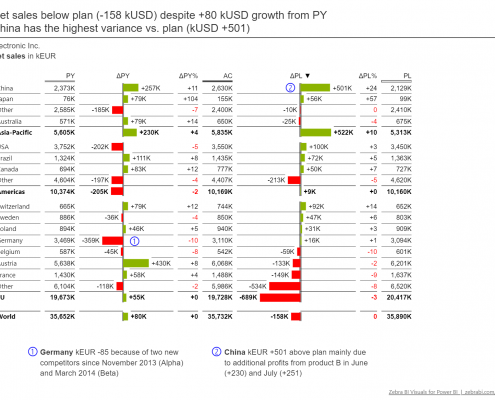
Significantly upgraded displays of hierarchical tables
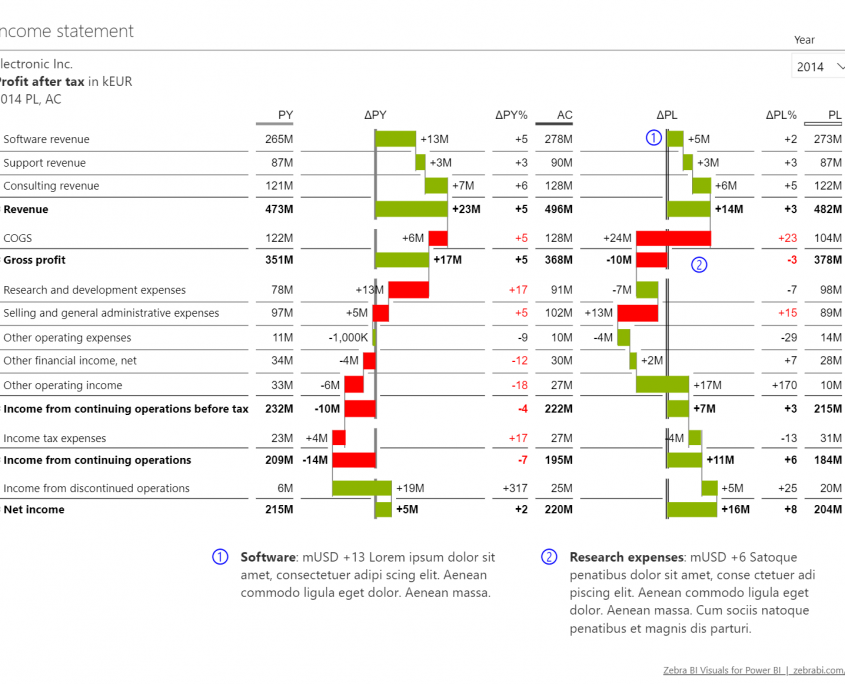
Hierarchical tables became even more powerful. For example, check out this P&L statement with comparisons to PY and plan at the same time:
Along with many other improvements and new features, Zebra BI Visuals for Power BI v1.3 allow you to build even more powerful business reports and dashboards. Here you can browse through a few more live examples, published directly from Power BI using the Publish to Web function:
Make sure you download the free trial!
In addition to out-of-the-box support for IBCS standards, Zebra BI visuals for Power BI feature 1-click data sorting, powerful outlier handling, advanced small multiples, responsive visuals, improved navigation and full customization. With support for Power BI, best practice reporting is now available on the desktop and mobile and in the cloud.

 September 8th
 February 22nd