 September 8th
 February 22nd
 10 Jul 2025

This time the Zebra BI team has tackled the important challenge of column structures in tables by allowing users to easily manage:
Both the grand totals and the subtotals can be easily renamed, shown or hidden directly on the visual, which makes the user experience enjoyable and extremely fast.
In addition, the user can sort the tables by any column, subtotal or grand total in one click.
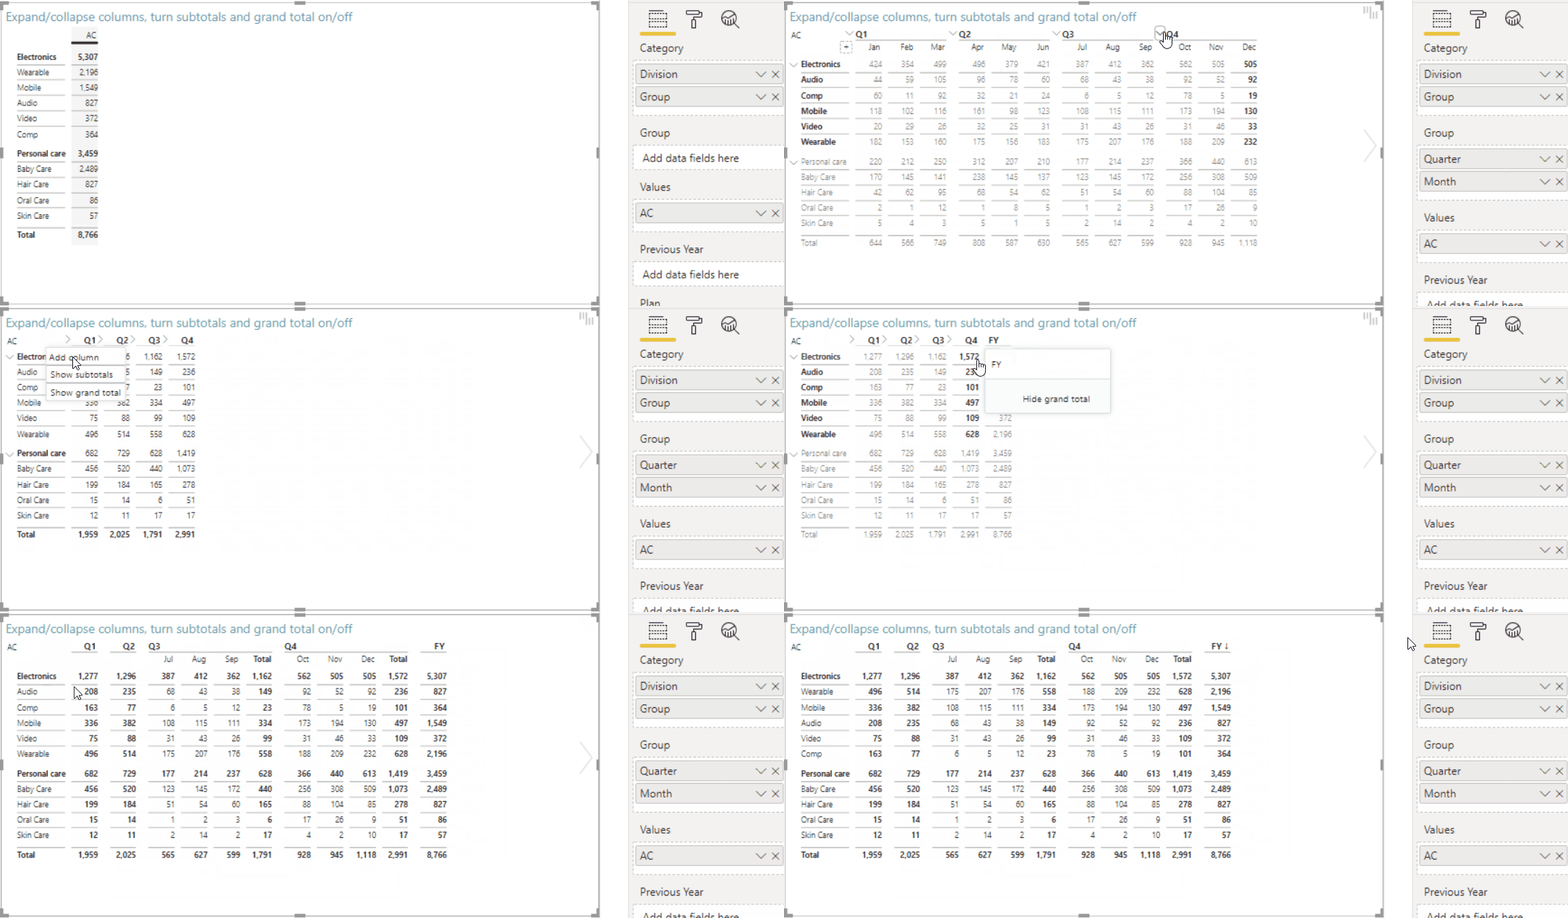
The new features work with all Zebra BI Tables layouts, charts, and settings. Here’s a real-life example where an additional measure for Previous year is added to the visual, thus creating a flexible variance table/matrix with automatically calculated variances and charts.

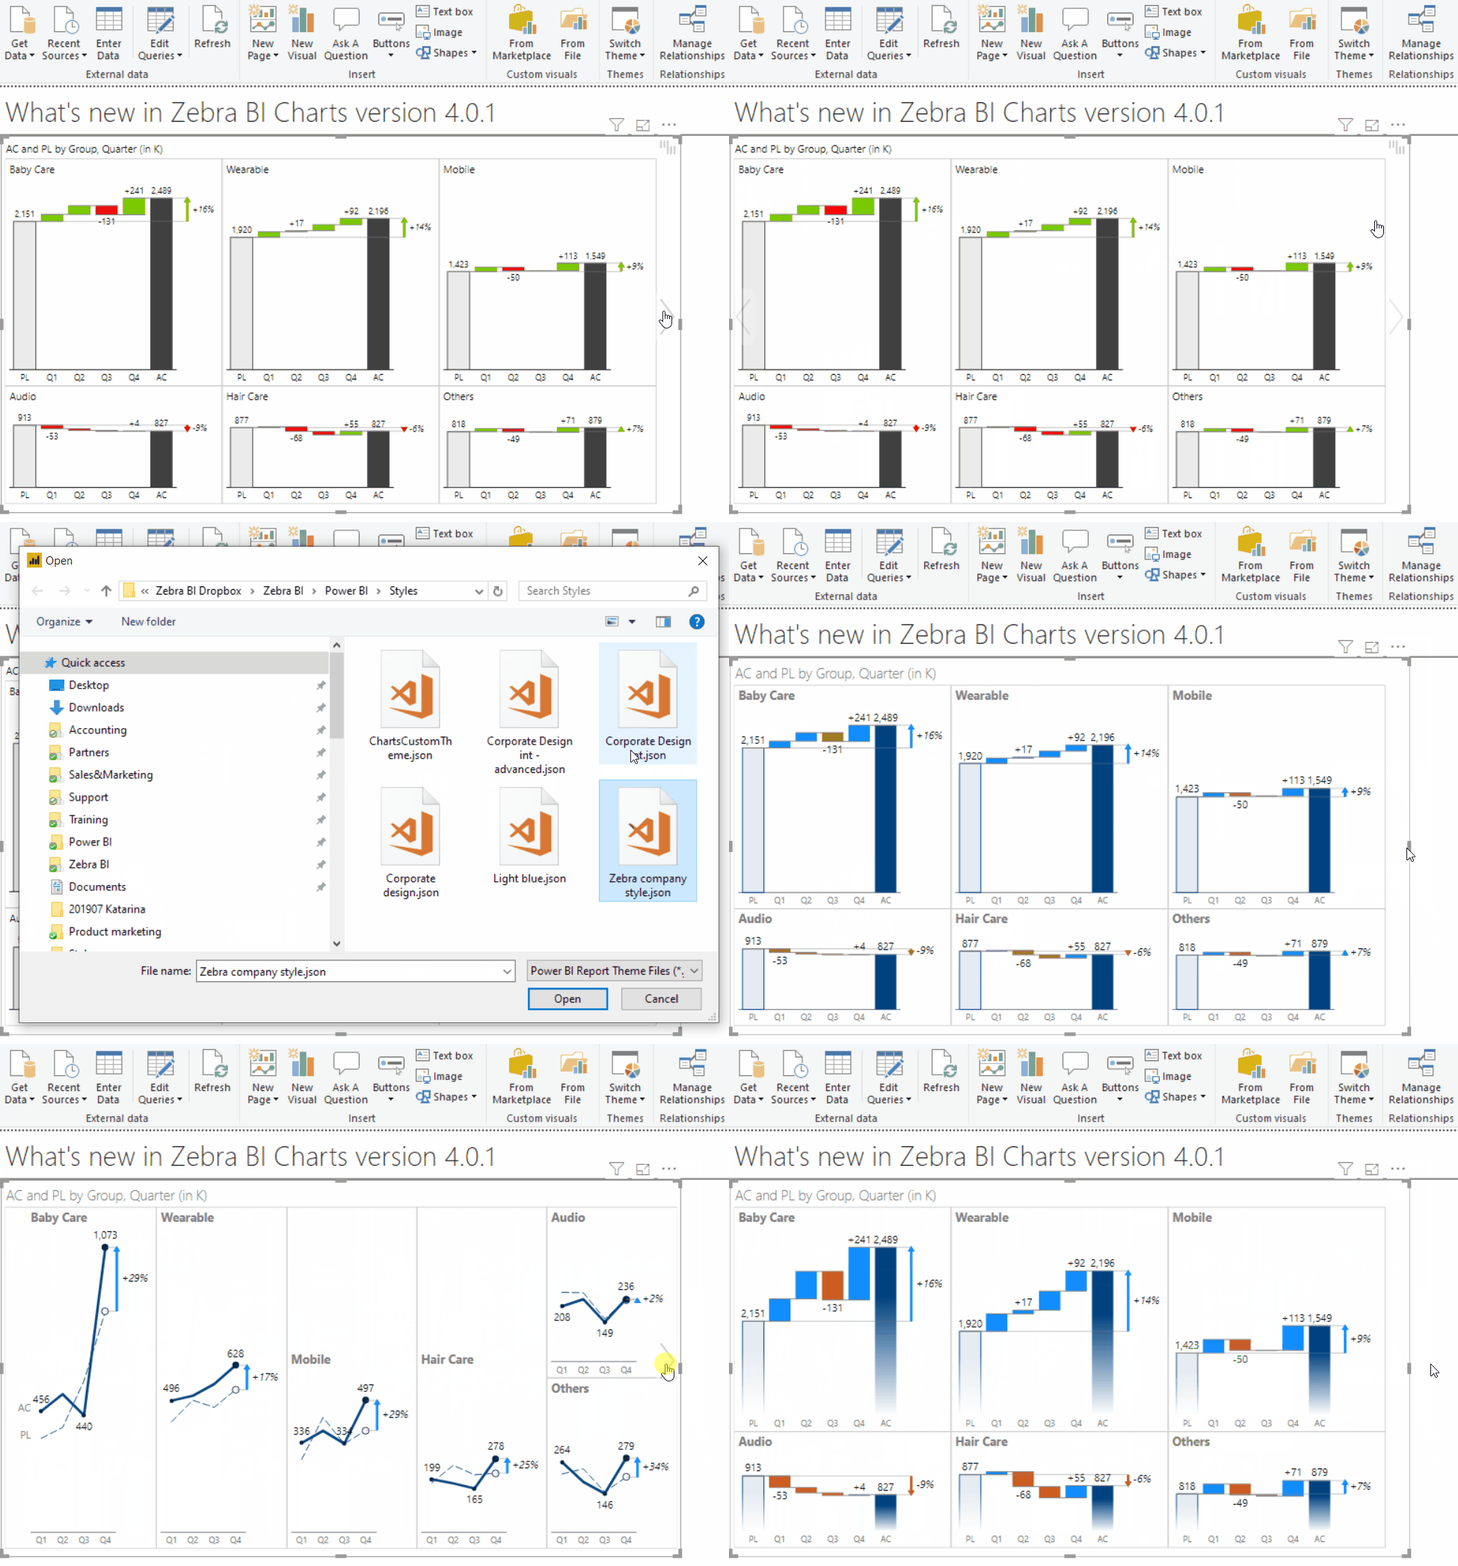
Zebra BI Charts, January Update (version 4.0.1) now fully supports custom themes, provided in the extended JSON format. This allows users to set up their preferred theme/style or align their Power BI reports and dashboards with their company’s corporate design.
All colors and fonts, that were previously customizable on each instance of the Zebra BI visual or set centrally in the Zebra BI member portal (for Pro users), are now fully exposed and can be specified in an extended JSON format for Power BI themes.
Once you create a custom theme (JSON file) you can import it by using the standard Power BI Import theme command. The theme covers all design settings and options for all Zebra BI charts and tables in one place.
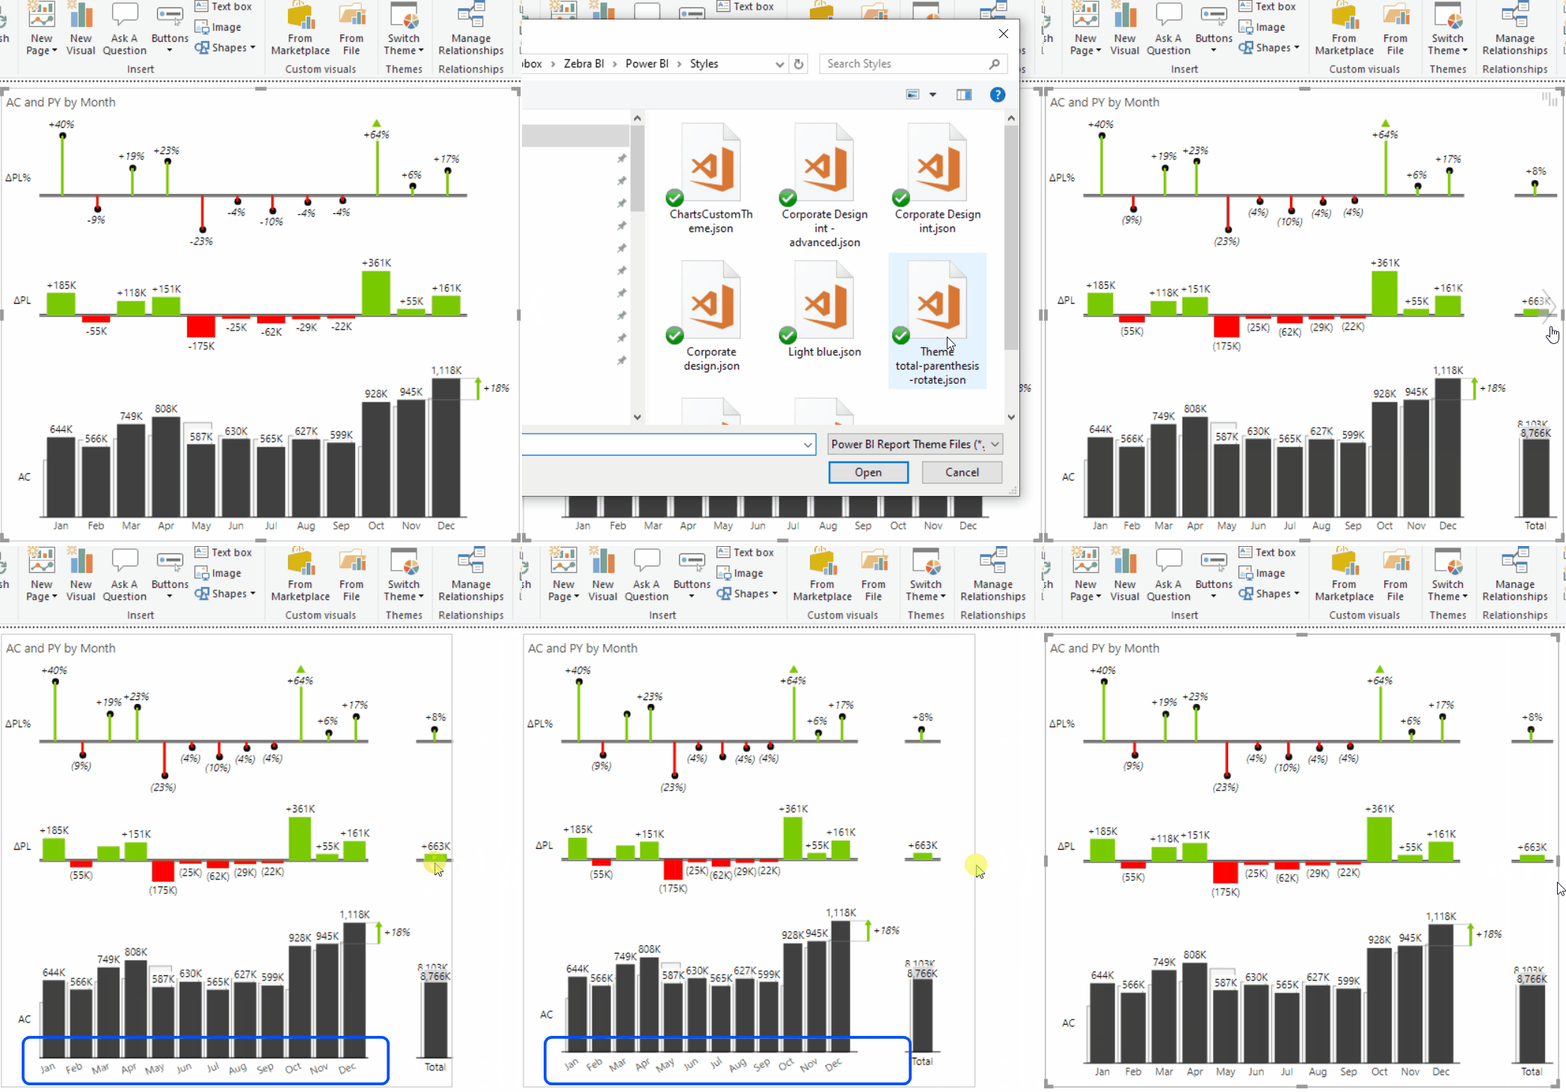
Even more importantly, a custom theme can now control any setting available in the Zebra BI Charts (as well as the Zebra BI Tables) visual. This provides extensive and detailed governance of all reporting aspects of Zebra BI for Power BI.
In this example, a custom theme enforces grand totals in Zebra BI Charts by default, switches the data label format for negative numbers in both Zebra BI visuals to parenthesis instead of being presented with a leading minus (-) sign, and sets the policy of displaying axis labels to rotate instead of trim in cases where space is limited - all in one go.
Check out the documentation on custom themes for further details
If you're already using the AppSource version of Zebra BI (version 4.0.0 or higher), then your Zebra BI has already been updated via the Microsoft's AppSource marketplace automatically. You're good to go!
If you're using an older version of Zebra BI (e.g. 3.x.x or older), then this might be a perfect opportunity to update your Zebra BI! When ready, just shoot us an email at support@zebra.bi and we'll help you migrate to the latest version.
Haven't tried Zebra BI before? Opt in for our 30-day free trial here: