IBCS® Certified
PBI Certified

Zebra BI for Power BI – 4.2 Update

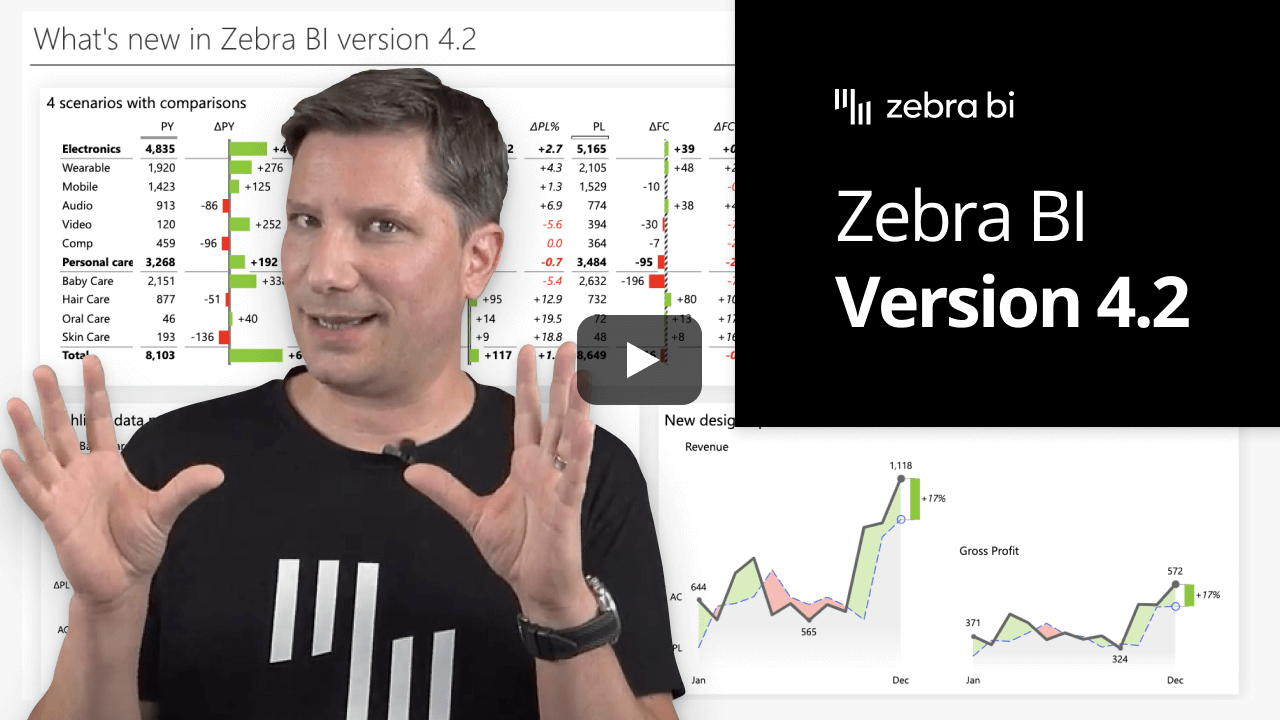
The 4.2 Update of Zebra BI visuals for Power BI enables you to display up to 4 base measures with variances at the same time (your most requested feature!), brings new highlighting possibilities for your Zebra BI Charts and Tables, as well as more design options that will make your dashboards even more understandable and actionable.

Get the PBIX file

Download the demo PBIX file that contains all the latest features illustrated with many practical examples.
Download PBIX

Watch the Video

Watch the video below for a quick and practical overview of all major NEW features & updates:
(0:17) Intro to 4.2 release
(1:45) Tables: Up to 4 different scenarios
(5:58) Highlighting option
(8:12) New design options
(14:20) Summary of the key features in 4.2 release
Share
Share
Share

Interact with Zebra BI for Power BI 4.2 👇

Play with our interactive example to get inspired and see all the new features in action. 
Tip: Make sure you put the interactive report in the full-screen mode (⤢) and check out all the pages by pressing the navigation arrows.

So, what’s new? 🎉

Up to 4 different scenarios in Zebra BI Tables 4.2

One of the most requested features is finally here: from now on, you can use up to 4 different scenarios (or base measures) in the same visual.

Here’s a real-life example of sales data where we want to compare Actuals, Previous Year, and Plan. Now we can add the fourth scenario, for example, Forecast.

Of course, you can add even more measures into your Zebra BI Tables and get additional columns. With the latest version, you can add up to 4 basic scenarios and then up to 10 additional measures!


Advanced highlighting

There are also new exciting highlighting possibilities. By default, there's always one column color that you specify in the style. The new version 4.2 now enables you to highlight specific columns with a color of your choice.

This works with Zebra BI Charts but also with Zebra BI Tables!

If you want to highlight an individual row in your tables, simply right click and enable this feature.

The highlight is completely dynamic so if your end users sort tables in a different order, the highlight will stick with its data category.


New design options

The new update unlocks new design options and more flexibility in designing your dashboards to show just the right amount of information and keep the focus of end-users on what's important.

Until now you've already been able to customize the color of your variance area, however, from now on, you can specify also the variance area opacity. This tones down the whole design and makes the difference in variance more visible.

There is also a new Difference highlight option that allows you to control the line width (if you want to draw attention or prefer a bit more sleek style), as well as use different arrow styles to fit your design purpose.

See how we used these two features in our dashboard showing the impact of COVID-19 on the global stock markets.


Even more importantly, the final new feature tackles one of the greatest challenges in data visualization: showing the right amount of labels and making sure they don't overlap. In previous versions, we already supported collision detectors which, for example, recognize when two labels start overlapping and hide one of them. With more control over the labels on the chart axis (a.k.a. the axis label density), you now get the flexibility to define your own rules for axis labels. For example, you can choose "First and last" which is good for density charts that show long periods such as 20 years of history. If more appropriate, you can choose the "Every Nth" option to show only selected labels.

Important: this feature is only supported by Zebra BI visuals and cannot be found in native Power BI. 

Time to give it a spin!

If you're already using the AppSource version of Zebra BI (version 4.0.0 or higher), then your Zebra BI has already been updated via the Microsoft's AppSource marketplace automatically. You're good to go!

If you're using an older version of Zebra BI (e.g. 3.x.x or older), then this might be a perfect opportunity to update your Zebra BI! When ready, just shoot us an email at support@zebra.bi and we'll help you migrate to the latest version.

Haven't tried Zebra BI before? Opt in for our 30-day free trial here:

Start Your 30-Day Free Pro Trial