 September 8th
 February 22nd
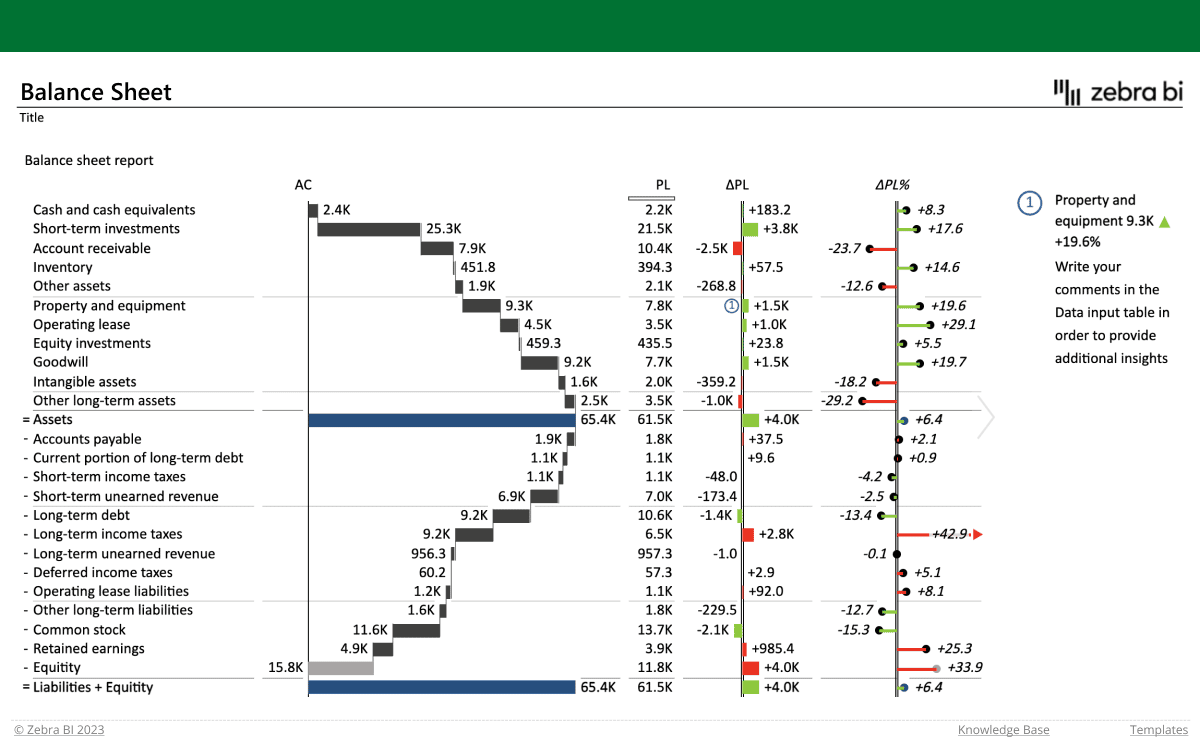
Tired of sifting through confusing and uninspiring balance sheet templates for Excel that leave you wanting? This next-level template will help you immediately turn your data into insights and present it in a way that is clear, easy-to-understand and actionable.
Easily track your performance
With its user-friendly design, it offers a snapshot of your company's financial position at any given point in time, allowing you to make informed decisions fast. The table with integrated waterfall charts enables you to see the contributions to the final result. The actual values of your assets, liabilities, and shareholder equity are compared to the previous year and plan for additional context.
Get insights at just a glance
The automatically calculated variances provide immediate insights into the changes in your financial position. This way, you can immediately see where your company stands and what areas need more attention. Additionally, it also features dynamic comments which enable you to leave notes and explanations directly in the visual. This makes it simple for you to share the reasons for the performance with your colleagues and stakeholders.
Emphasize the crucial parts
But there’s more. This balance sheet template for Excel includes highlighting options that allow you to easily draw attention to key data points. Point out the rows that need immediate attention or highlight the entire column and make it stand out with a border.
Grab your Zebra BI balance sheet template for Excel and experience a whole new world of instant financial reporting. Check out the video below to see how easy it is to use.