September 8th
 February 22nd
 26 Feb 2026
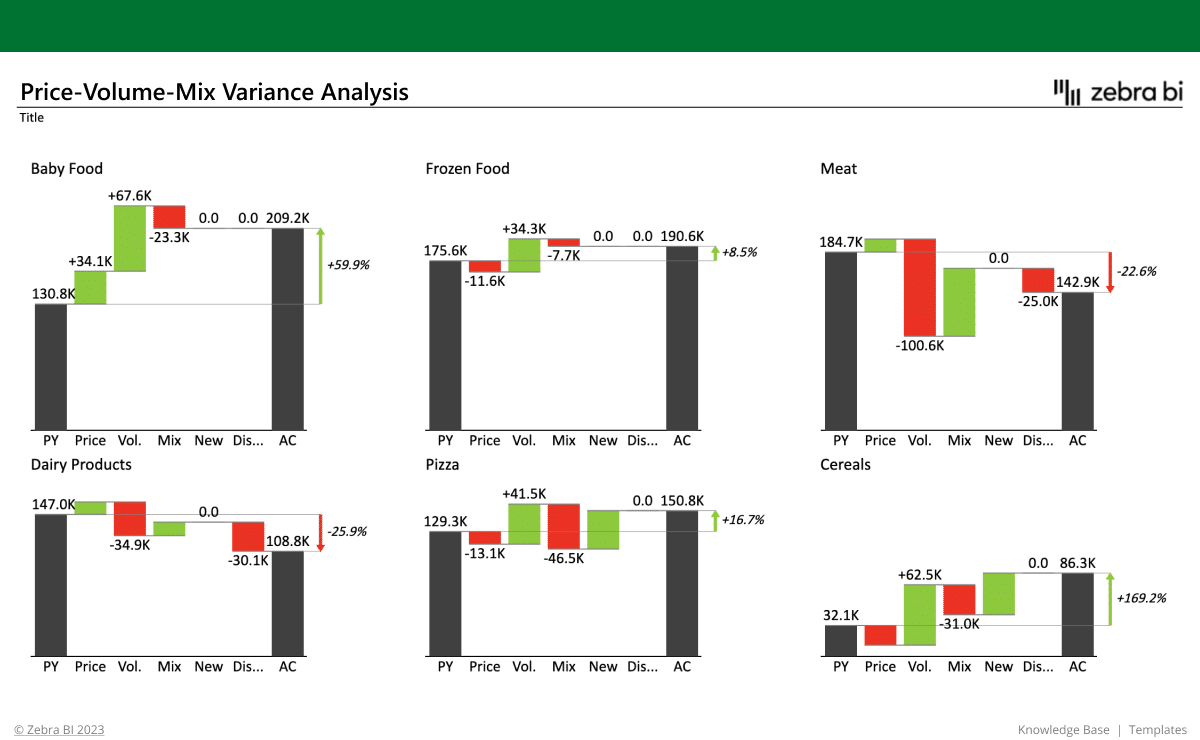
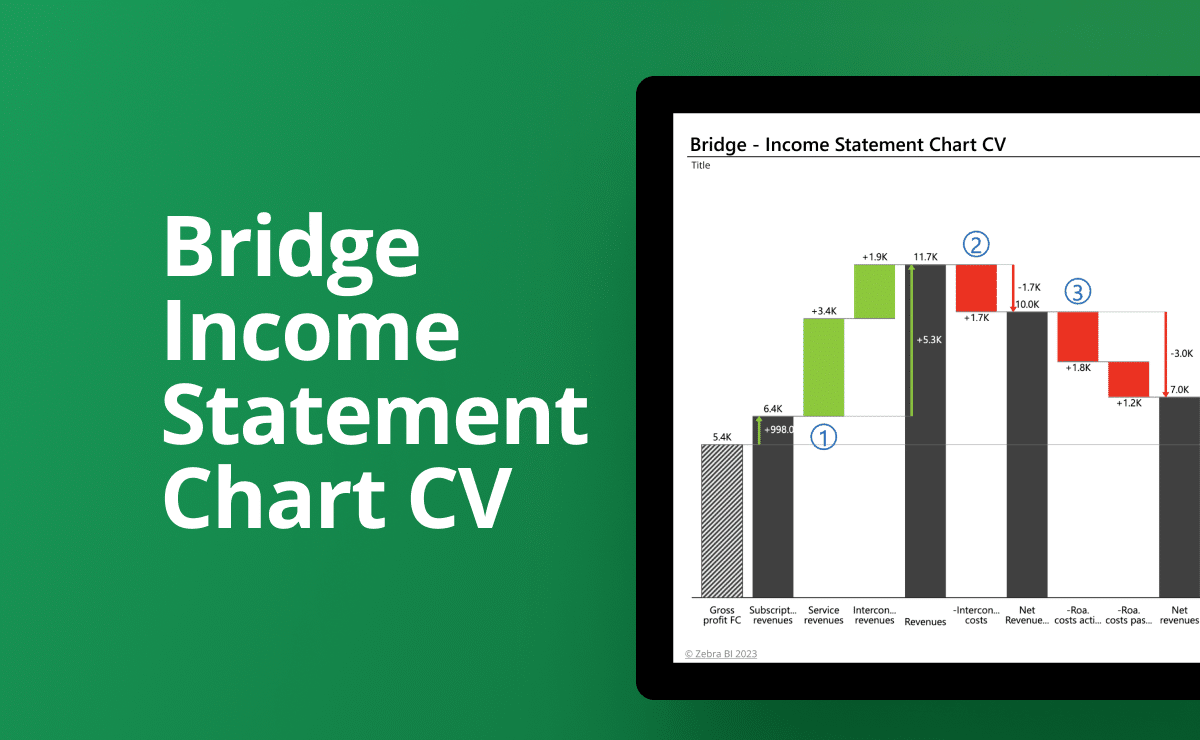
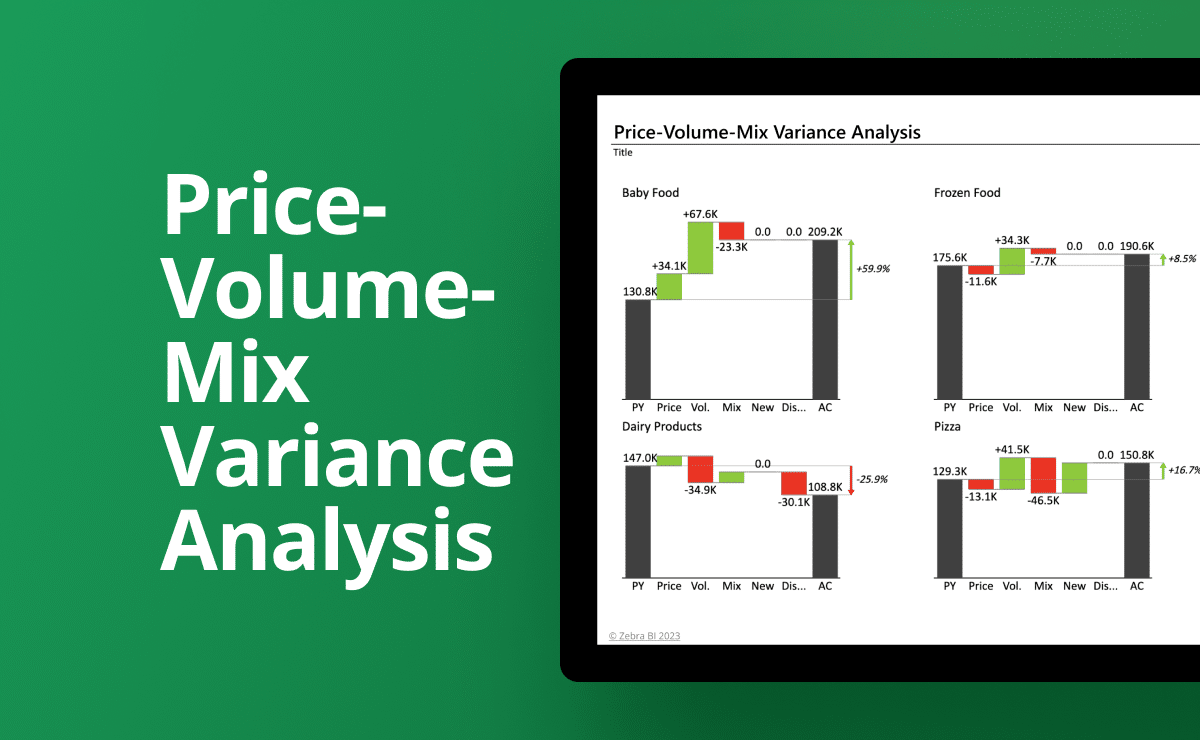
This Volume Variance Excel template helps you break down revenue changes using a clear and structured PVM (Price, Volume & Mix) analysis. A Price-Volume-Mix Analysis Report is commonly used in finance, sales, and business analytics to understand how changes in price, volume, and product mix impact revenue or profit.
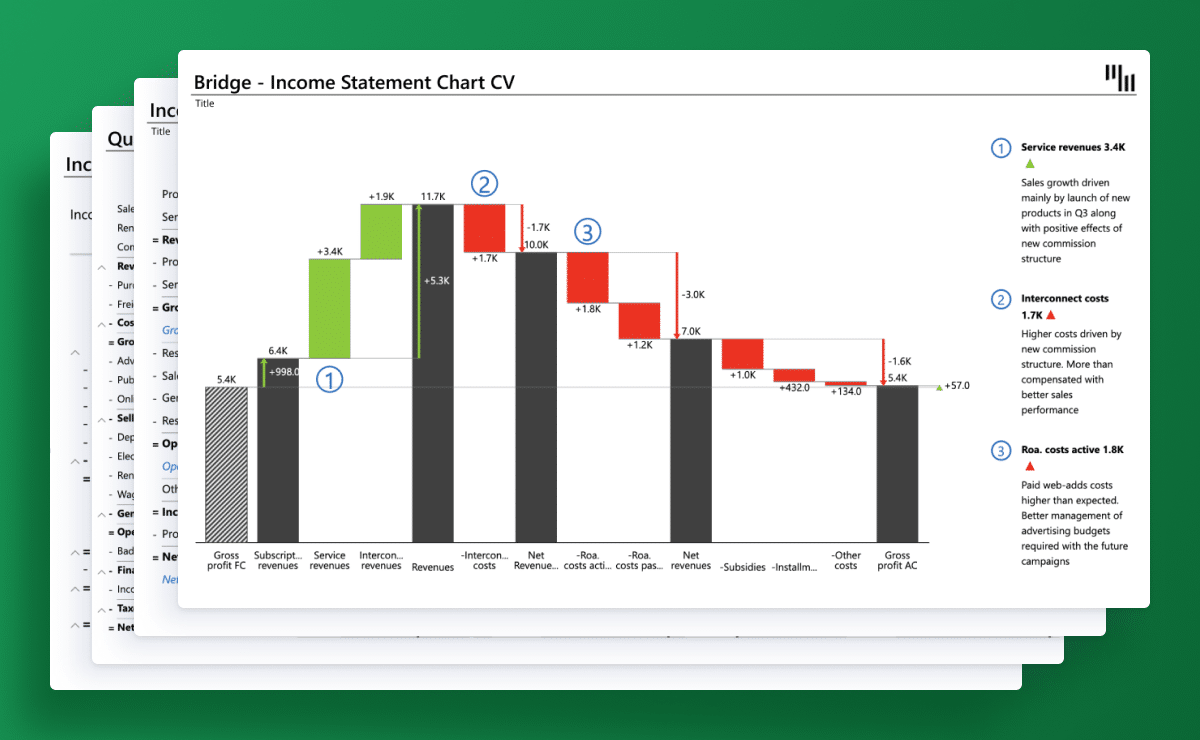
The report highlights three key components:
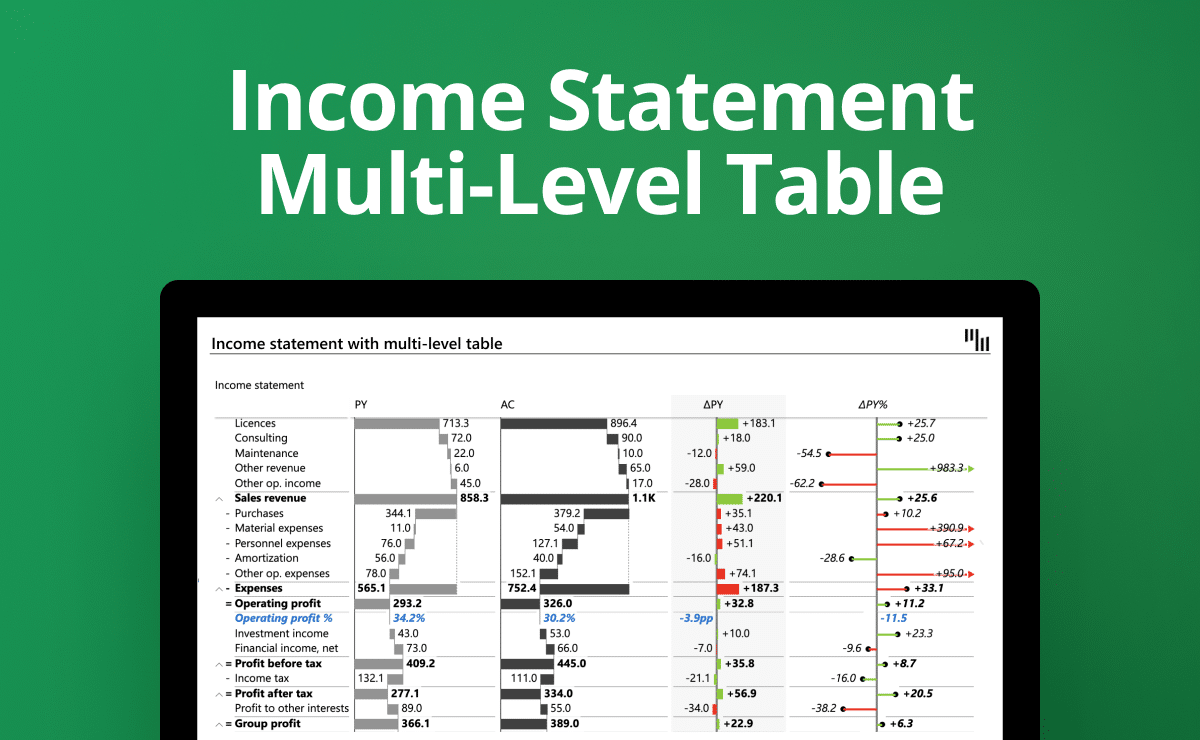
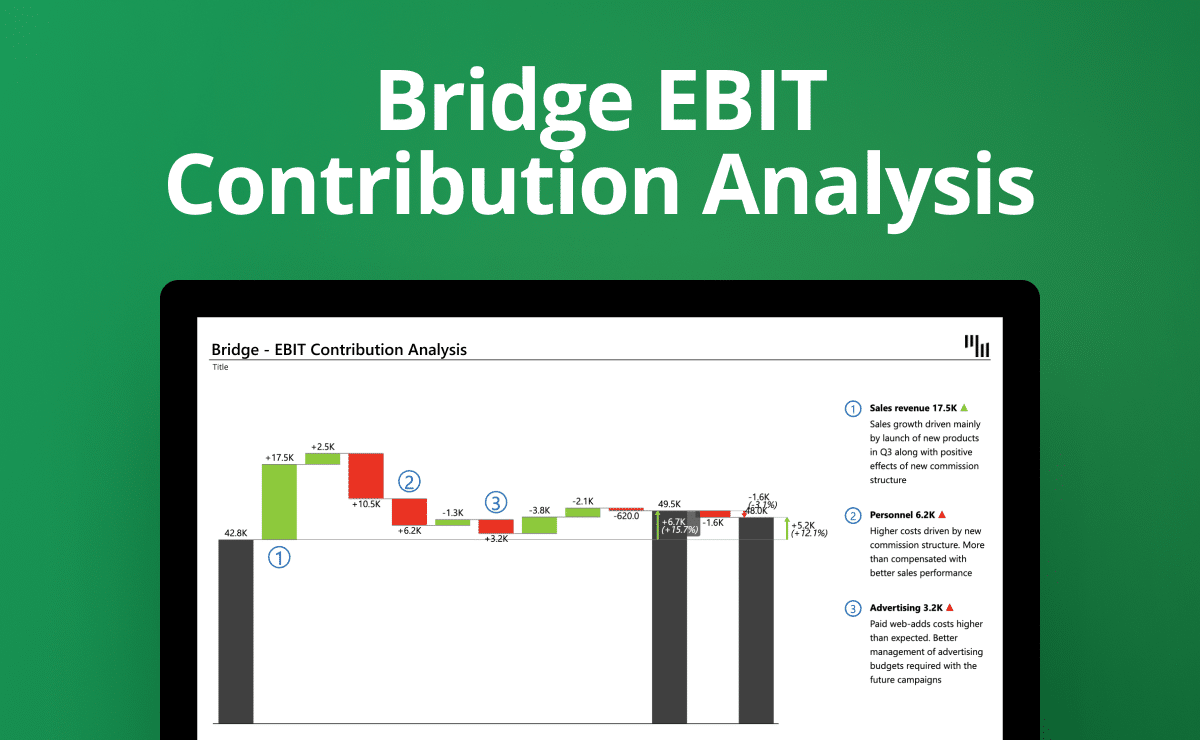
Built with Zebra BI visuals using standard tables and PivotTables, the report showcases how each factor—including new launches and discontinued products—contributes to revenue performance using professionally formatted bridge charts and small multiples with comment markers and automatic variance highlights for accurate and insightful reporting.
This Price Volume Mix variance Excel Template is ideal for finance professionals, business analysts, controllers, and FP&A teams who need to analyze and explain changes in revenue. It is especially valuable for:
Whether you’re in consumer goods, manufacturing, retail, or services—anyone looking to understand revenue drivers will benefit from this Price Volume Mix Excel Template. From business leaders to analysts, everyone can use this Price Volume Mix variance report template to drive business success.
"PVM" stands for "Price, Volume, and Mix" analysis.
A volume price analysis is used to understand the key drivers behind revenue changes over time (such as sales strategies changing, volume effects, sales volume increases or decreases, price changes, or the overall comprehensive price volume mix together).
By isolating how much of the revenue movement is due to pricing strategies, quantity sold, or changes in the product/customer mix, PVM analysis offers a deep, actionable view into business performance. It helps explain not just how much revenue changed—but why it changed and how this will impact the future strategy.
The Price Volume Mix Analysis Excel report helps you easily analyze your price volume mix data and answer critical business questions such as:
With these insights, you can:
✅ Draw revenue & profitability insights – Understand the "why" behind revenue variance for individual products according to negative or positive price variance or volume variance
✅ Make strategic pricing decisions – Identify whether price adjustments are helping or hurting the business, according to market trends and internal business reporting
✅ Improve your sales performance tracking – Evaluate whether revenue growth is from increased sales volume or product mix changes.
✅ Perform product portfolio optimization – Focus on the most profitable products and on increasing the impact of volume increases.
✅ Run forecasting & budgeting – Predict how pricing, volume drivers, and mix changes impact future performance and how your overall market positioning and business strategy impacts on revenue performance.
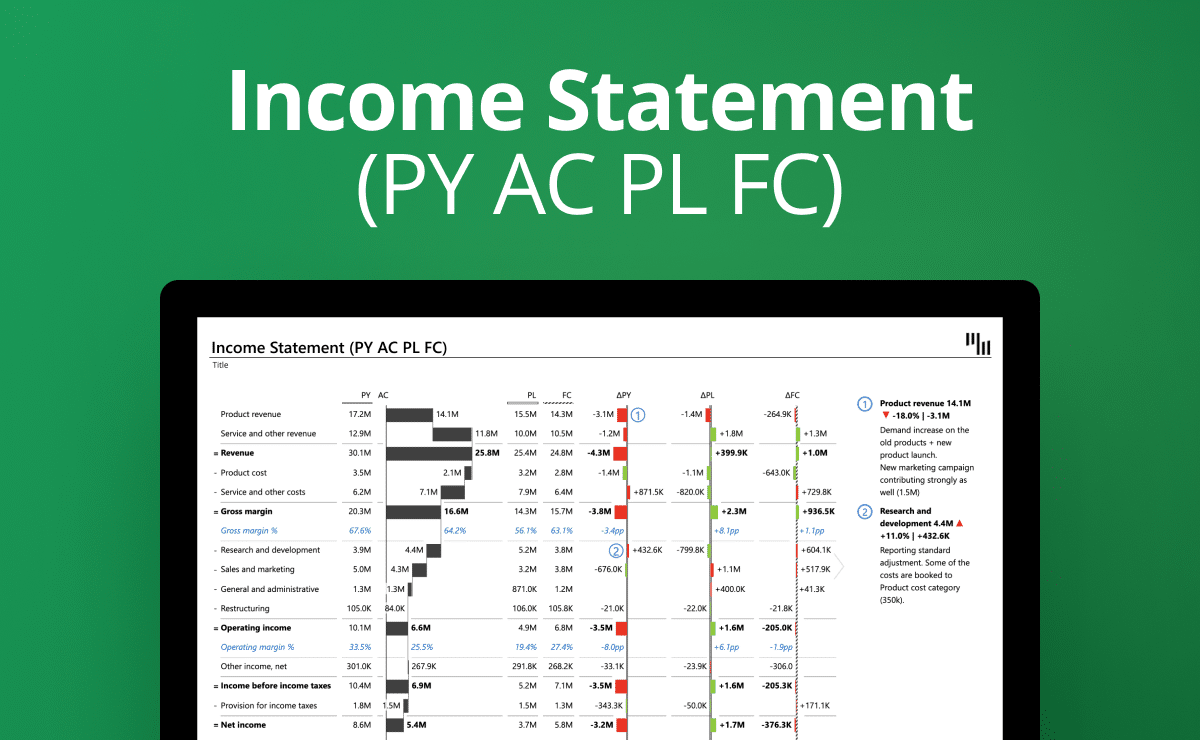
This Excel example is designed to apply best practices in data visualization right out of the box. It enables you to:
Whether you’re reporting to executives or diving into detailed analysis, this template ensures your message is crystal clear, your findings are accurate and well-structured, and your data actually drives decisions.
We wanted to make sure you get the most out of your Price Volume Mix analysis formula and template, so we enhanced it with the best and most suitable Zebra BI features:
All of these charts enable you to:
All Zebra BI templates are designed using IBCS® principles and real-world reporting experience. They help you build professional reports faster, reduce manual work, and ensure your insights are clear, consistent, and actionable — every time.
Getting started is quick and easy — even if you’re not an Excel expert.
1. Download this Excel template/example to find best practices and inspiration for actionable reporting techniques.
2. Use sample data to test it out and check what the background is to find the application for your use cases.
3. Use the free trial or another Zebra BI plan to create PVM analysis reports with Zebra BI visuals on your own data.