Contribution Margin Analysis Excel Template
Overview
An essential aspect of business intelligence and financial analysis is contribution margin. It offers a deep understanding of products or services' profitability and cost structure, serving as a foundation for informed decision-making. Our Contribution Margin Excel Template equips analysts with a comprehensive tool for effortlessly conducting detailed contribution margin analysis.
What is the contribution margin?
Contribution margin measures the profitability of individual products by subtracting variable costs from revenue generated per unit or in total. Unlike gross margin, which accounts for fixed and variable costs, contribution margin focuses solely on variable costs, clarifying how sales affect profitability.
Importance of Tracking Contribution Margin
Tracking contribution margins is crucial for businesses to identify the profitability of different products or services, offering several key benefits:
- Determine the Break-Even Point: It enables businesses to pinpoint the sales volume needed to cover all costs, ensuring financial stability.
- Making Pricing Decisions: Contribution margin insights help set prices that cover costs while remaining competitive.
- Planning Product Lines: Identifying products with higher contribution margins helps prioritize and allocate resources effectively.
- Assessing the Impact of Variable Costs on Overall Profitability: It highlights how variable costs influence profit, guiding cost management strategies.
When to Use Contribution Margin Analysis
To understand when to use contribution margin analysis, you must recognize its versatility across various strategic domains. Here's an expanded look at these pivotal areas:
During Pricing Strategy Development
Understanding the contribution margin is critical when setting prices for products or services. It allows businesses to determine how price changes affect profitability and to price their offerings competitively while ensuring they cover variable costs and contribute to covering fixed costs and generating profit. This analysis supports decisions about pursuing cost leadership or differentiating products through added value.
When Evaluating the Financial Viability of Upcoming Products
Before launching new products, companies need to assess their potential financial performance. Contribution margin analysis is crucial in estimating whether this product's revenue will cover its variable costs and contribute to fixed costs. This insight helps you make informed decisions about product development, launch, and marketing strategies.
Cost-Control Initiatives
Reducing costs is a common goal for businesses seeking to improve their bottom line. Contribution margin analysis clearly shows how variable costs impact overall profitability. This guides managers in identifying areas where cost reduction can lead to significant profitability improvements. It's beneficial for pinpointing products or services that may not be as profitable as expected due to high variable costs.
For Optimizing the Product Mix to Maximize Profits
Deciding which products to focus on or prioritize in production can be challenging, especially for businesses with multiple product lines. Contribution margin analysis helps by revealing which products have the highest contribution margins, indicating they are more profitable on a per-unit basis after covering variable costs. This information is invaluable for resource allocation, production planning, and strategic focus, enabling businesses to optimize their product mix for higher profitability.
By applying contribution margin analysis in these scenarios, businesses can make data-driven decisions that enhance their financial health and strategic positioning. This analytical approach provides a clear understanding of cost behavior and profitability, which is essential for pricing, product development, cost management, and strategic planning.
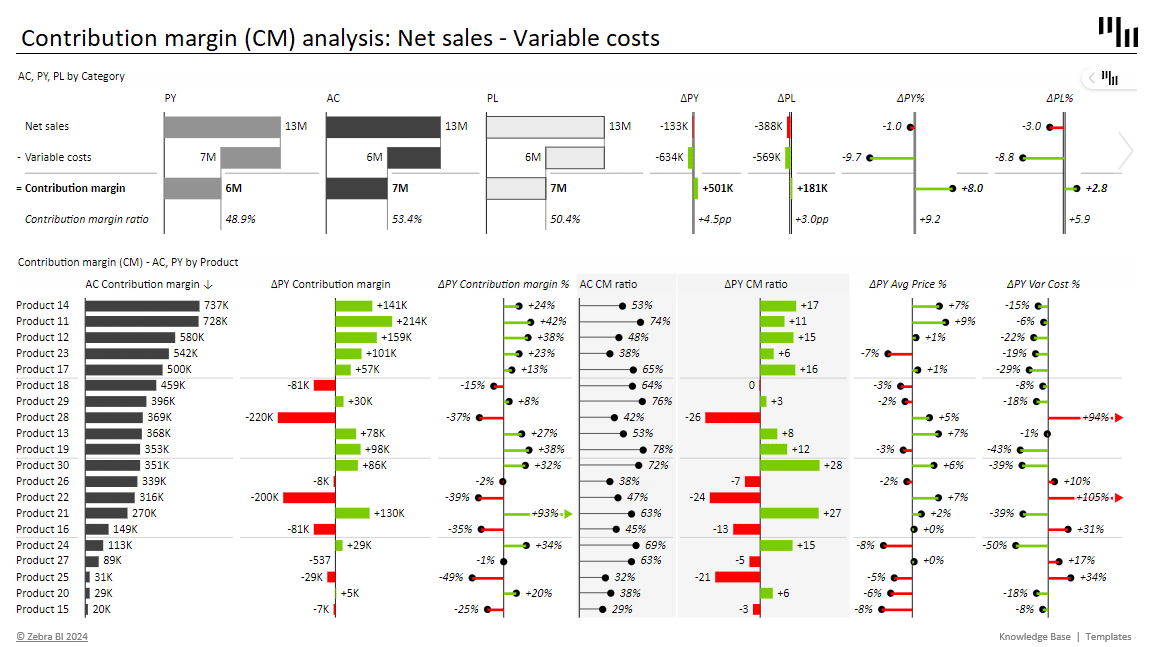
Visualizing Contribution Margin in Excel
Our template transforms Excel's capabilities, offering two levels of visualization:
Basic Visualization: Starting from a simple Excel table, our template allows straightforward visualization of contribution margins without additional charts.
Advanced Visualization with Zebra BI: Elevate your analysis with Zebra BI Tables and Charts integrated into Excel. This approach offers:
- Zebra BI Tables: Transform Excel tables into dynamic charts, providing a clear visual representation of complex data.
- Zebra BI Tables from Pivot Tables: Enhance pivot tables with the Zebra BI add-in for robust analysis without cumbersome Excel tweaks.
- Zebra BI Charts: Gain immediate insights into product performance, identifying high and low performers at a glance.
- Cross-filtering: Simplify your reports and explore data from various perspectives by selecting specific products, automatically updating the entire report to reflect the selection.
Formulas for Contribution Margin Analysis
Contribution Margin: Revenue - Variable Costs
At the product level: Contribution Margin per Unit = Average Price per Unit - Variable Cost per Unit
Contribution Margin Ratio: Contribution Margin / Revenue
At the product level: Contribution Margin per Unit / Average Price per Unit


